Abstract: In March 2018, we wrote a piece on the SegWit capacity increase and compared it to Bitcoin Cash transaction volume. Another topic we have focused on is coins moved for the first time since the split, on both sides of the chain (our September 2017 report). In this piece we briefly provide an update on the metrics we were tracking. The data shows that SegWit is enjoying strong and consistent growth, while Bitcoin Cash volume is also slowly increasing from its lows, to around 9% of Bitcoin transaction volume. As at October 2018, very few pre-split coins are moving for the first time since the fork.
SegWit transaction volume – Percentage of Bitcoin transaction volume (Daily data)
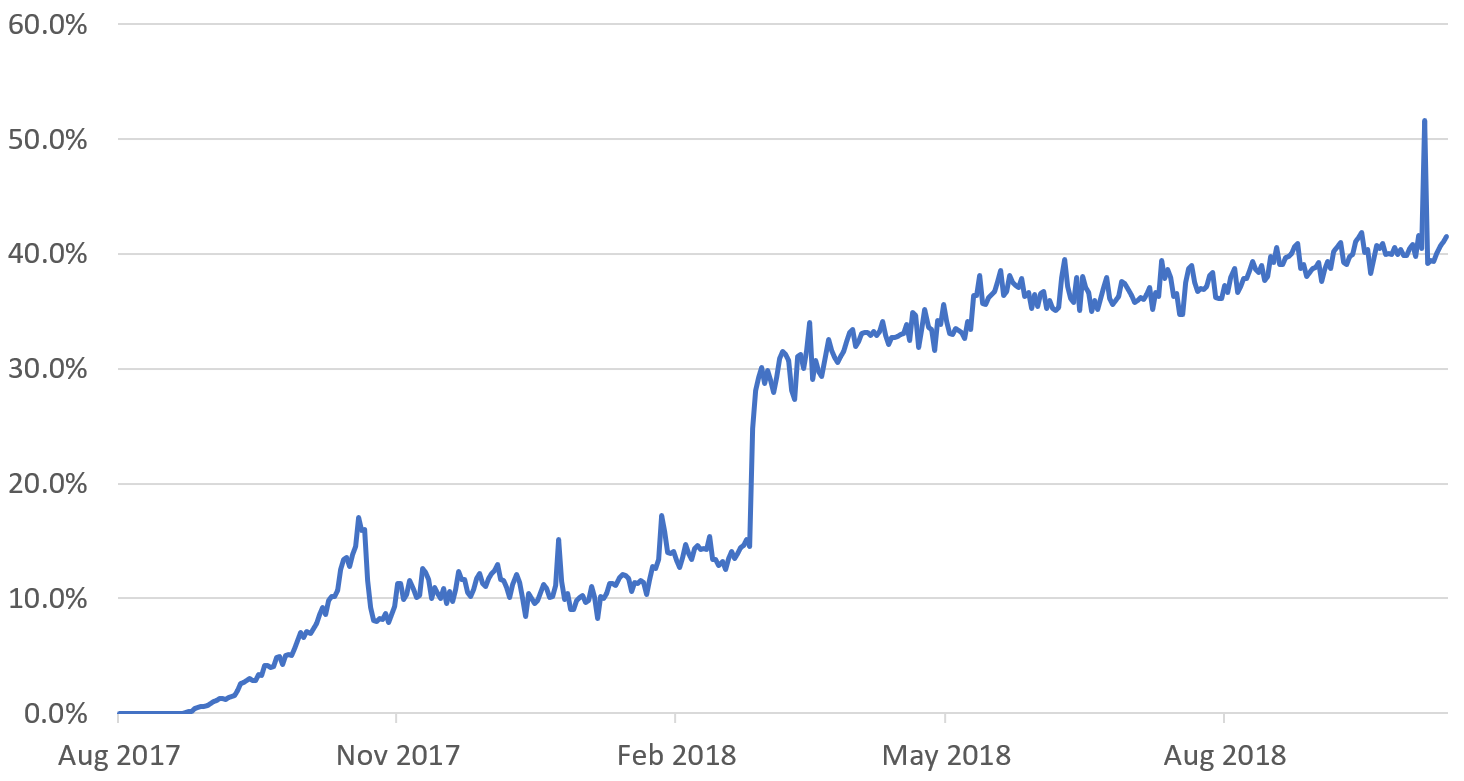
(Source: BitMEX Research, Bitcoin blockchain)
On the Bitcoin network, SegWit adoption has grown substantially since our first article on the topic in September 2017. Adoption now approaches 50% and the growth has been reasonably consistent and gradual throughout the period.
Daily transaction volume
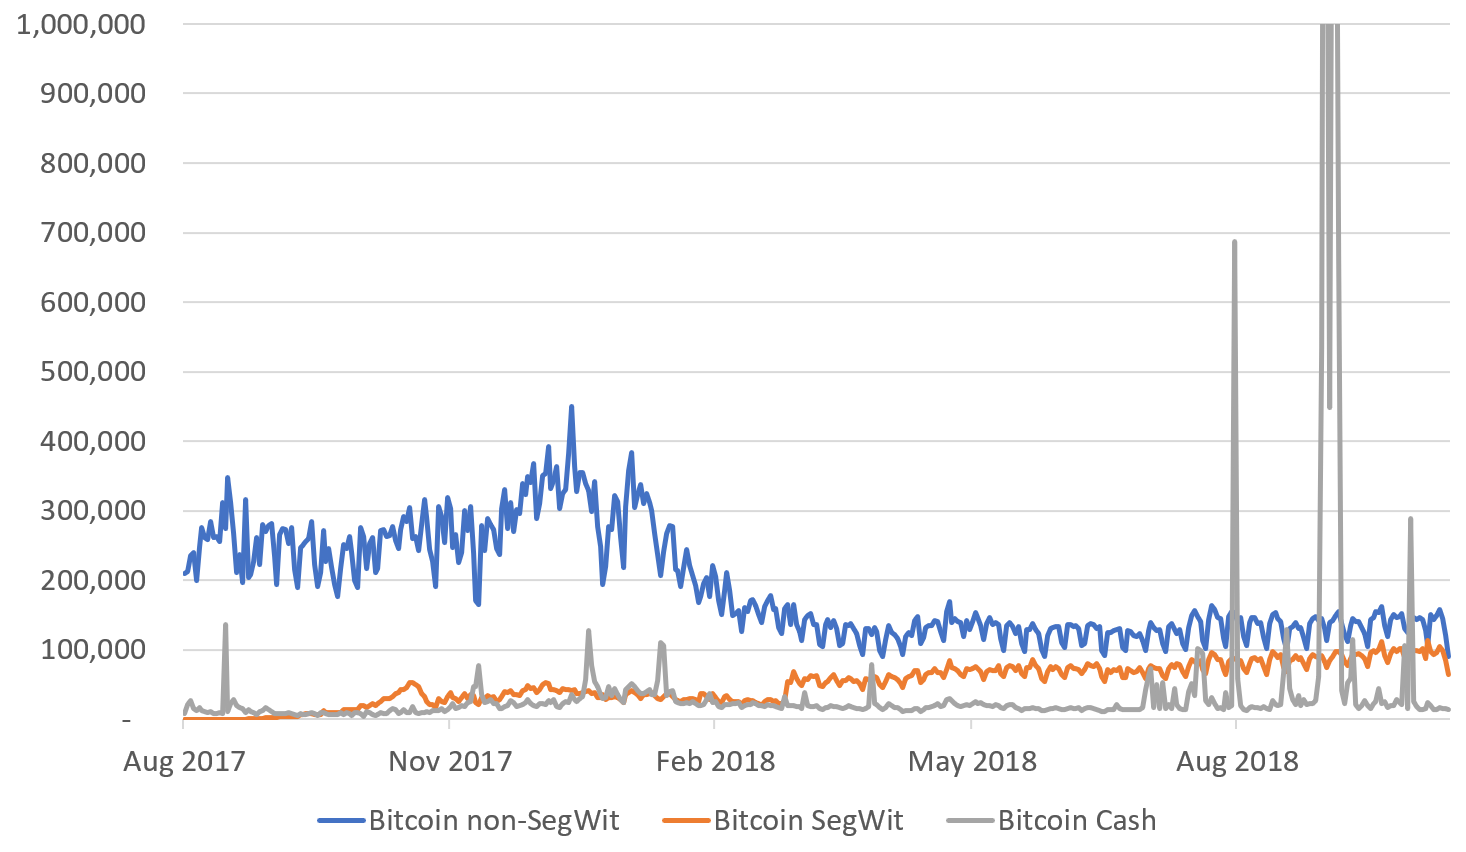
(Source: BitMEX Research, Bitcoin blockchain, Bitcoin Cash blockchain)
As the above chart indicates, Bitcoin Cash transaction volume declined from the c10% of Bitcoin level in March 2018, when we last commented on the topic, to around 6%. Then in the late summer of 2018 Bitcoin Cash volume picked up again, to around the 10% level. The Bitcoin Cash numbers are somewhat skewed by the “stress tests” which occurred in August 2018 and then September 2018. However, the median daily Bitcoin Cash percentage transaction volume compared to Bitcoin in the last six months is 9.0%, a recovery compared to earlier lows of around 5% or 6%.
Cumulative transaction volume since the launch of Bitcoin Cash
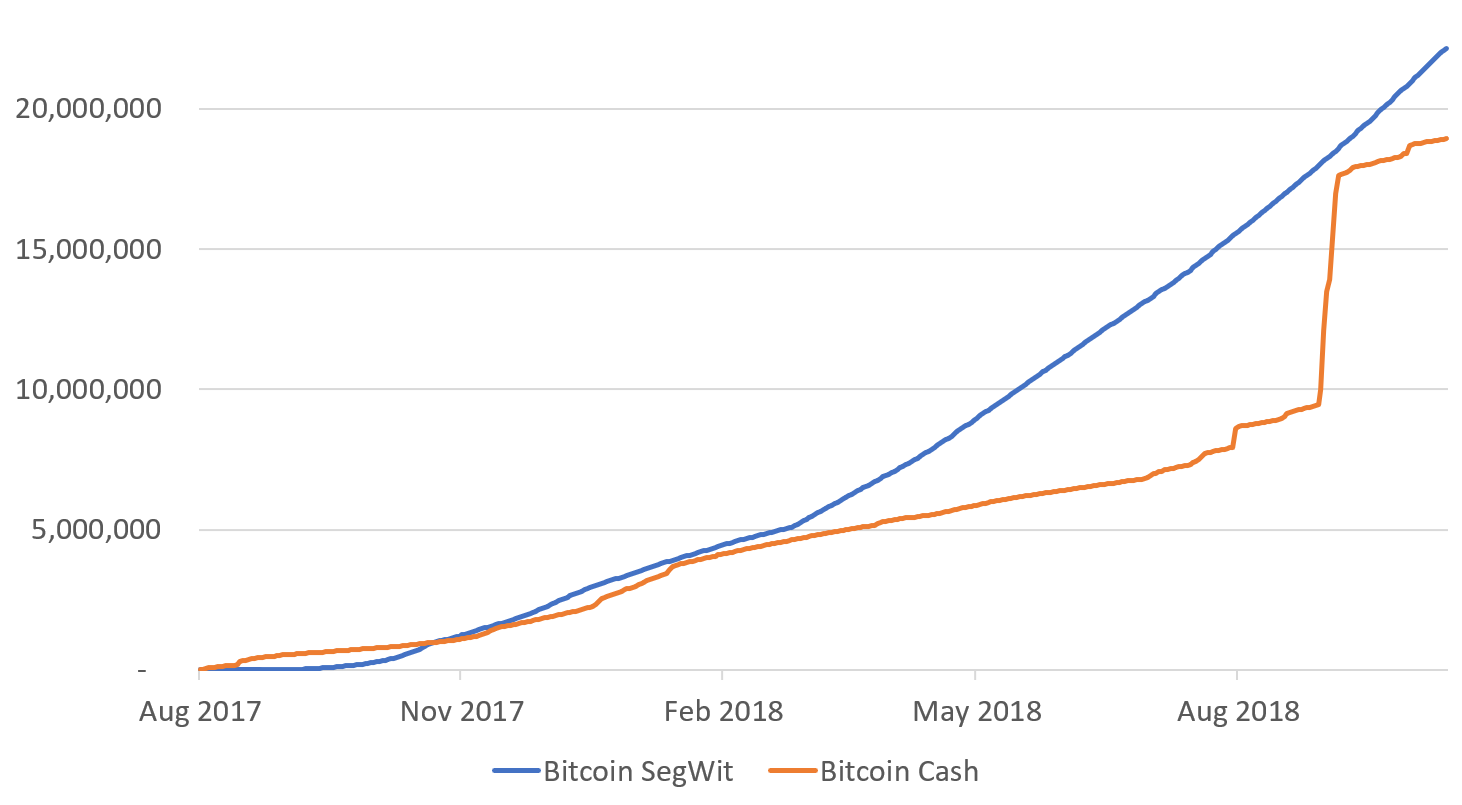
(Source: BitMEX Research, Bitcoin blockchain, Bitcoin Cash blockchain)
Since the launch of Bitcoin Cash, 22.1 million SegWit transactions have taken place, only 17.0% more than the cumulative number of Bitcoin Cash transactions, which stands at 18.9 million. Although, as the chart above illustrates, this appears to be skewed somewhat by the stress tests.
Prior to the start of the stress tests, in July 2017, there had been 15.5 million SegWit transaction, 95.1% more than the number of Bitcoin Cash transactions.
Coins moved for the first time since the fork
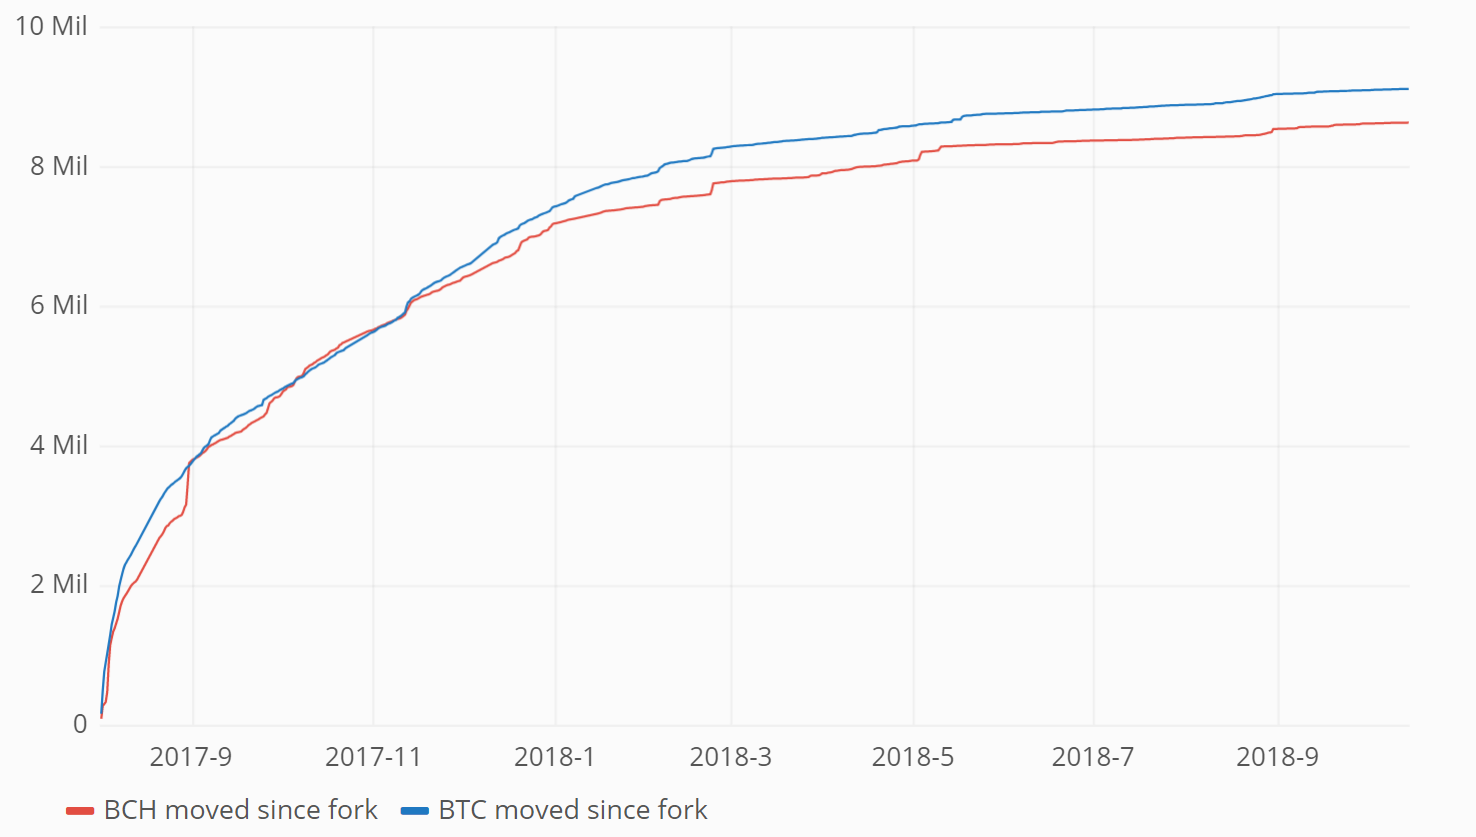
(Source: Forks.network, Original chart idea from BitMEX Research)
As for our investor flow analysis system, 9.1 million Bitcoin which existed prior to the spit has moved at least once since the fork, compared to 8.6 million Bitcoin Cash. As the chart above indicates, the gradient of the spend for the first time since the fork lines are flattening out on both sides of the split, potentially indicating further significant changes in the investor flow dynamics are unlikely.