Abstract: This is our third major piece on ICOs. In our first piece in September 2017 we focused on the interrelationships between ICO team members. In our second piece, in October 2018, we tracked the Ethereum balances in the ICO treasury accounts. In collaboration with TokenAnalyst, this piece focuses on the treasury balances of the ICO tokens themselves, on the Ethereum network. This report is based on tokens where the team controlled holding’s were worth an astonishing US$24.2 billion on issuance (in reality liquidity was too low for this value to be realized). Today this figure has fallen to around US$5 billion, with the difference primarily being caused by a fall in the market value of the tokens, alongside US$1.5 billion of transfers away from team address clusters (possibly disposals).
(Source: BitMEX Research)
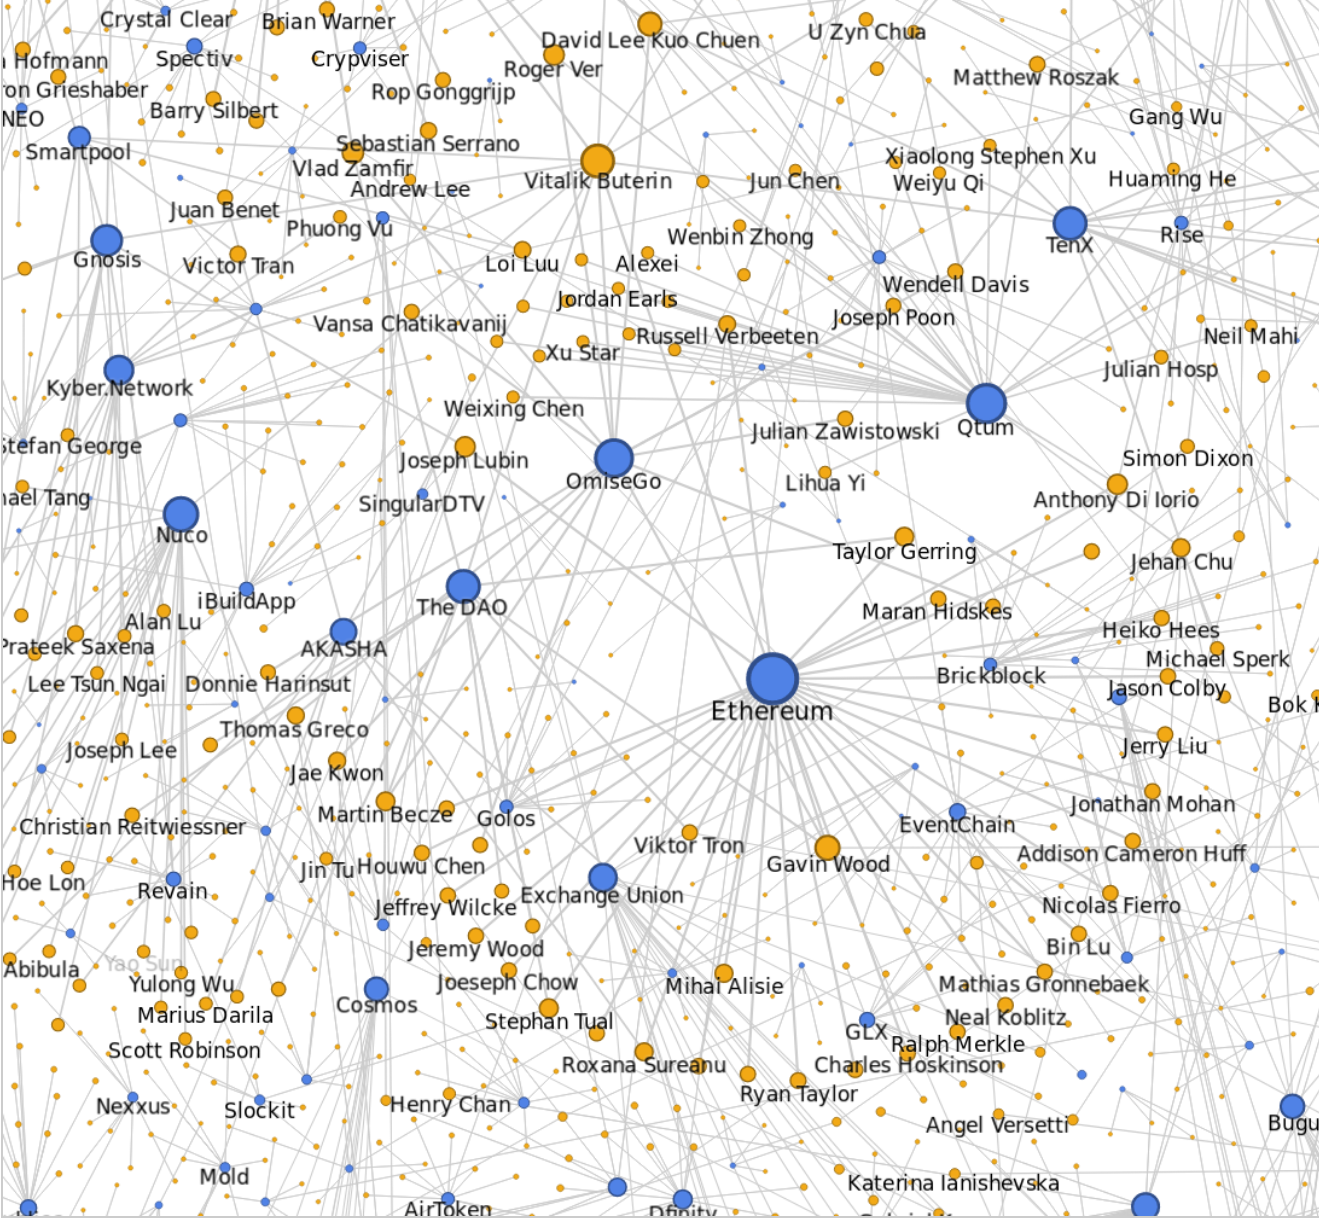
(Note: A reminder of the various interconnections between ICO team members, from our September 2017 interactive graphic)
Team controlled token holdings (Own tokens) – summary data
| US$ billion | |
| Value of ICO coins allocated to token teams | 21.5 |
| Issuance to team post ICO | 2.7 |
| Total issuance to team controlled wallets |
24.2 |
| Coins leaving the team address cluster (Perhaps sales) | (1.5) |
| Profits/(losses) due to token price changes | (12.0) |
| Net impact of Noah (token burn) | (4.4) |
| Net Impact of EOS | (1.2) |
| Current team holdings | 5.0 |
(Source: BitMEX Research, TokenAnalyst, the Ethereum blockchain, Coinmarketcap (for token prices))
(Notes: Price data up to Jan 2019, token data up to Dec 2018, based on data for 108 tokens)
Of the US$24 billion worth of tokens ICO project teams issued to themselves, 54% of the value has been lost due to coin price reductions. The peak valuation of the team holdings of their own tokens, using the individual price peak for each coin, is over US$80 billion. This larger figure implies US$70 billion of “losses” from the peak. Although peak valuation highly is dubious due to a lack of liquidity and most of the tokens were granted to the teams essentially for nothing, therefore classifying these price movements as losses may not be appropriate. Unlike ICO investors, the teams did not have an offering price or initial investment. However, some trading activity occurred at these ridiculously high valuations, therefore we believe it’s still interesting to consider these figures, while bearing these caveats in mind.
Based on current illiquid spot prices, the ICO teams still appear to own around US$5 billion of their own tokens, money they essentially got from nothing, depending on ones view. At the same time the teams may have realized gains of US$1.5 billion by selling tokens, based on coins leaving team address clusters. Although this figure may also be an overestimate, as coins could have left the team address cluster for a variety of reasons.
Data Caveats & weaknesses in calculation methodology
- The liquidity of many of these tokens is low and therefore the US Dollar values may be gross overestimates, this applies to both the initial allocation, current value and the value of any losses. In some cases, the value of tokens given to the team, for instance with projects such as Veritaseum or Noah, were almost comically large relative to the real trading volume in the coins. Therefore it can be considered unrealistic to value the team holdings based on the exchange price of the tokens.
- The challenge and uncertainty involved in producing this dataset surrounds the allocation of the tokens to the team address cluster. TokenAnalyst conducted this allocation. The methodology used was imperfect and we have not dug into individual projects. The data was obtained by analysing the token smart contracts and transaction patterns on the Ethereum blockchain and applying machine learning type techniques to establish a team controlled address cluster for the team of each project. The data is therefore a probabilistic estimate and is likely to be inaccurate at the individual project level. However, the primary motivation for this report was to produce macro data about the team holdings of ICO tokens on Ethereum. Although this analysis has produced results which are far from perfect, we believe one can draw reasonable macro conclusions from the analysis.
- As mentioned above, our analysis is based on reviewing smart contract data and transaction patterns, not documents and policies of individual projects. Therefore, it’s possible we included tokens as part of a team balance, although in reality they are held as part of another form of reserves, escrow or some other category, where it’s inaccurate to attribute the coins to the team’s own funds.
- The data assumes the issuance date is the same date as when the first price data appeared on Coinmarketcap, this may not be a reliable assumption.
Summary data
Value of coins issued to team controlled address clusters (own tokens) – US$ million – Top 10
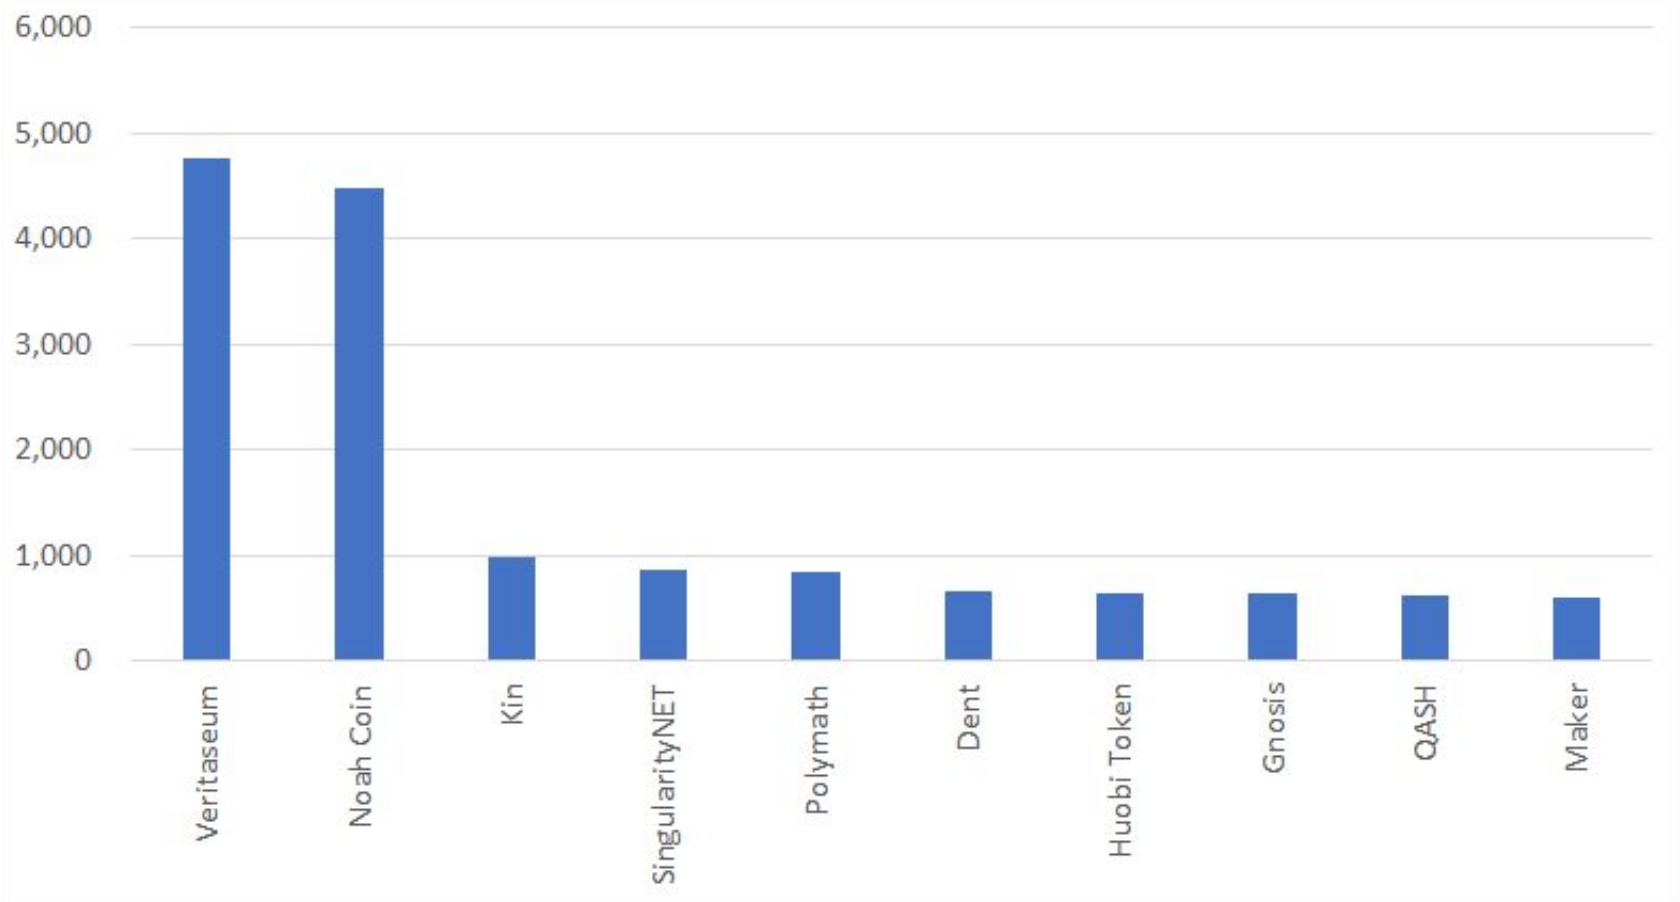
(Source: BitMEX Research, TokenAnalyst, the Ethereum blockchain, Coinmarketcap (for token prices))
(Notes: Token data up to Dec 2018, data based on prices at the time(s) of issuance)
Loss in value of team controlled holding (own tokens) – US$ million – Top 10
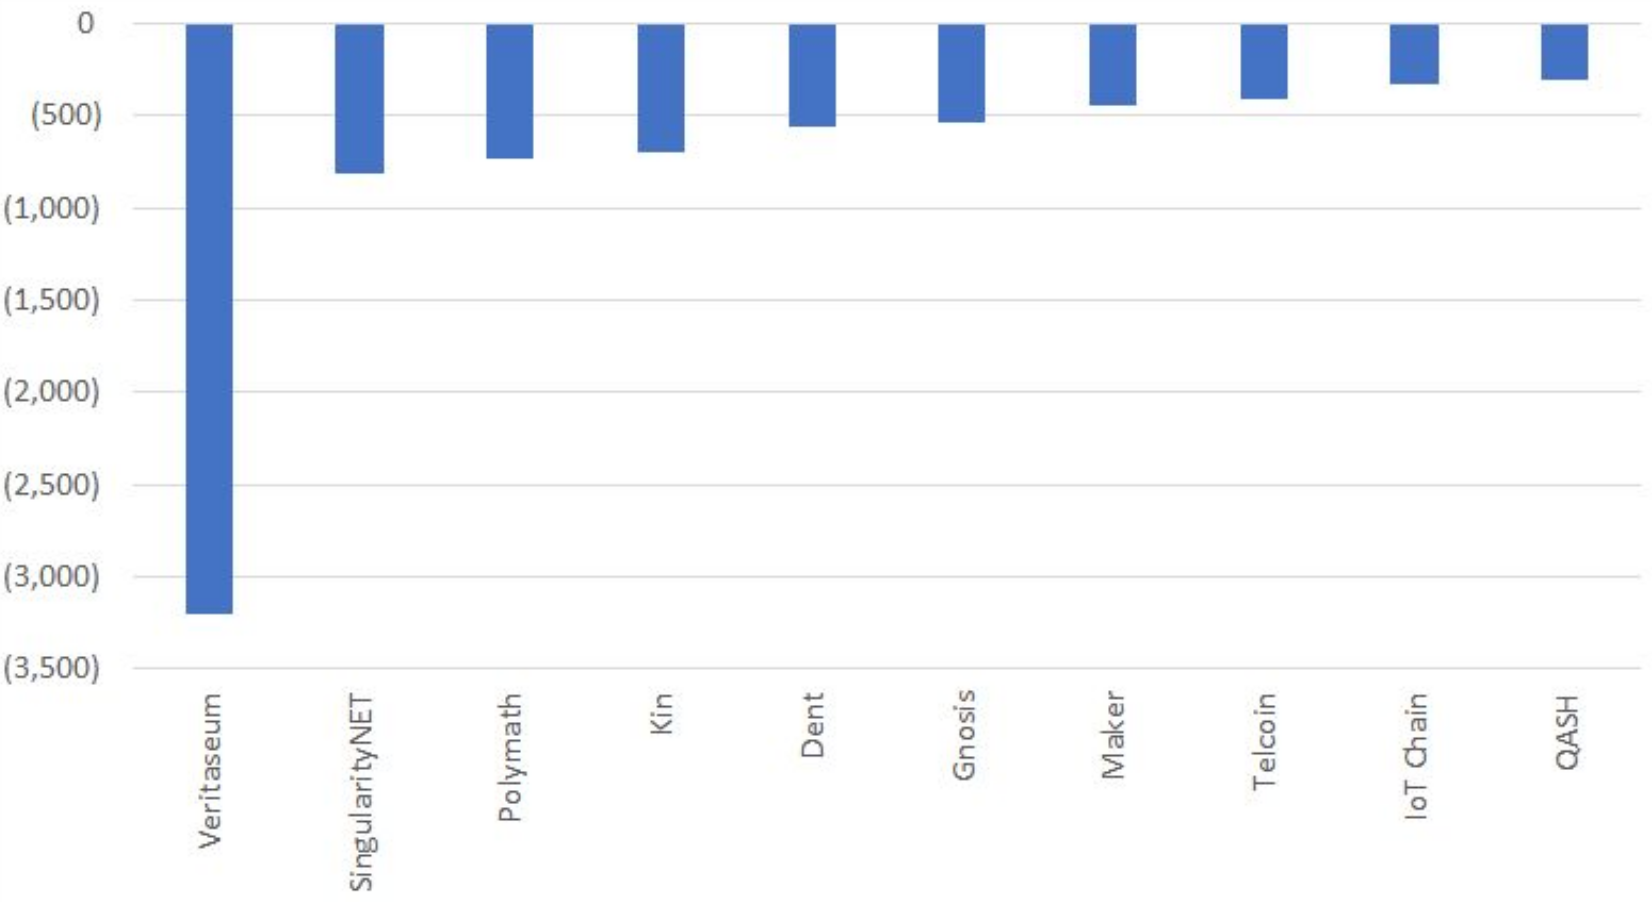
(Source: BitMEX Research, TokenAnalyst, the Ethereum blockchain, Coinmarketcap (for token prices))
(Notes: Price data up to Jan 2019, token data up to Dec 2018)
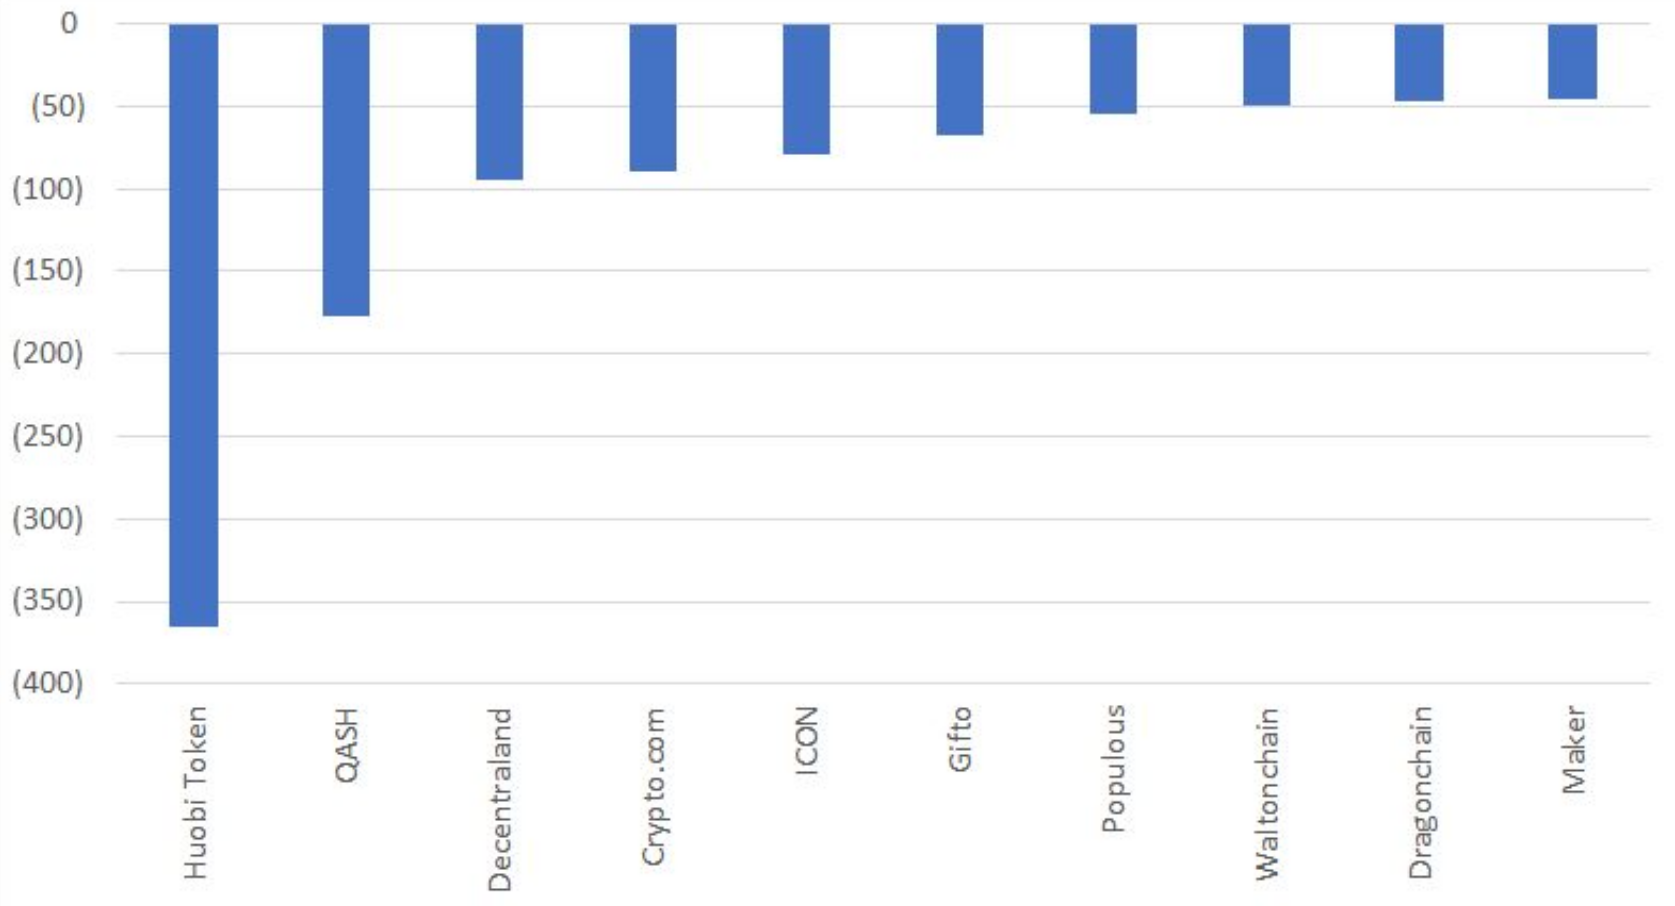
Proportional loss in value of coins in team controlled address clusters (own tokens) – Top 10
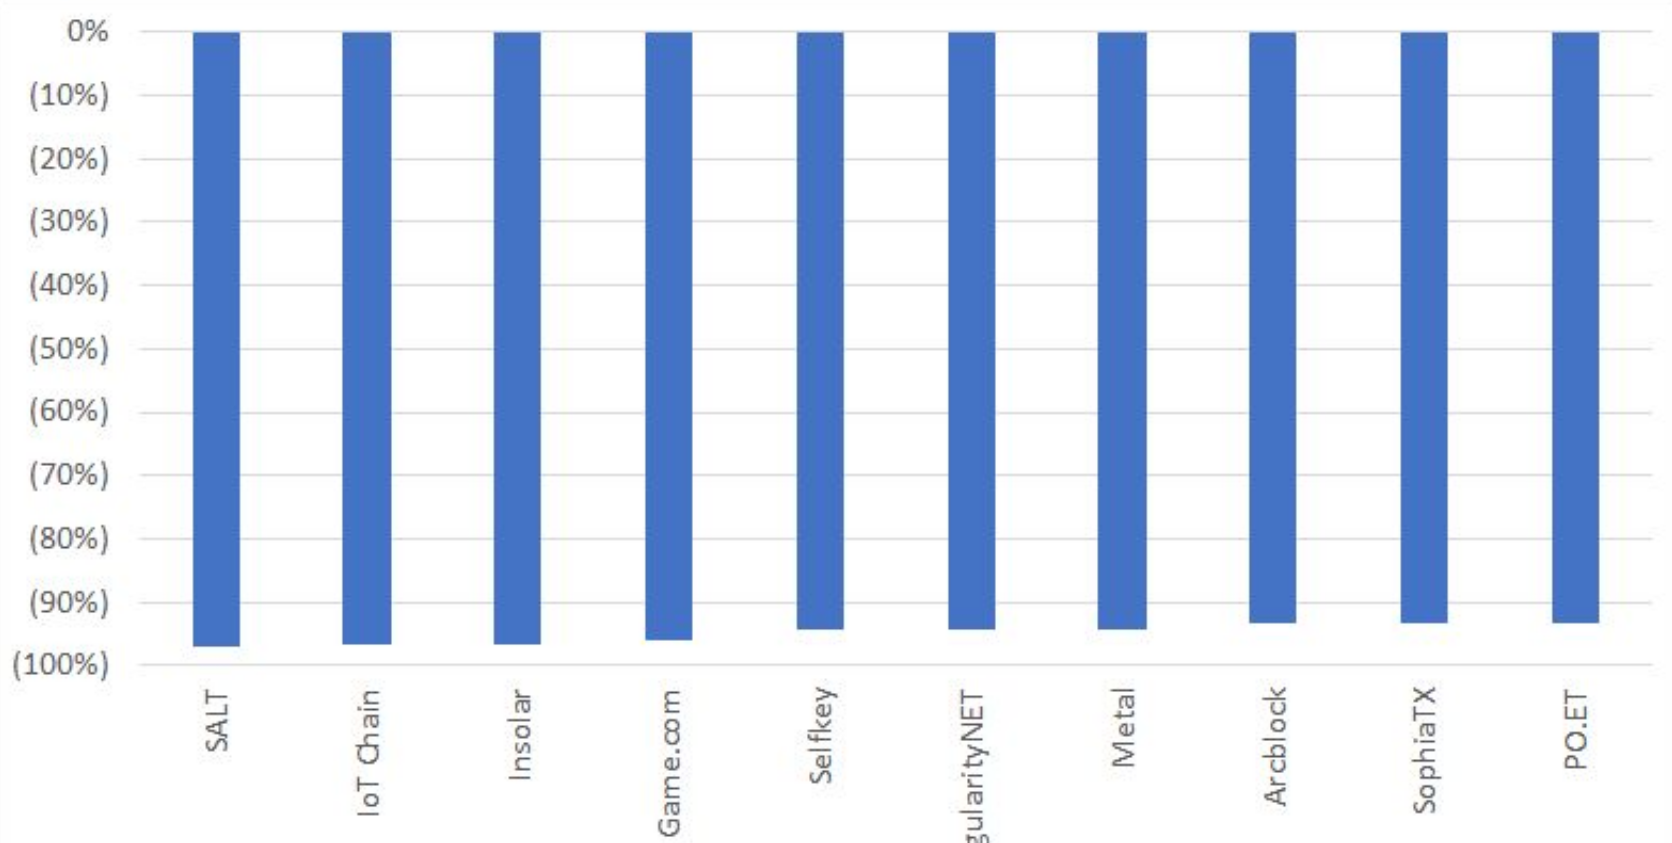
(Source: BitMEX Research, TokenAnalyst, the Ethereum blockchain, Coinmarketcap (for token prices))
(Notes: Price data up to Jan 2019, token data up to Dec 2018)
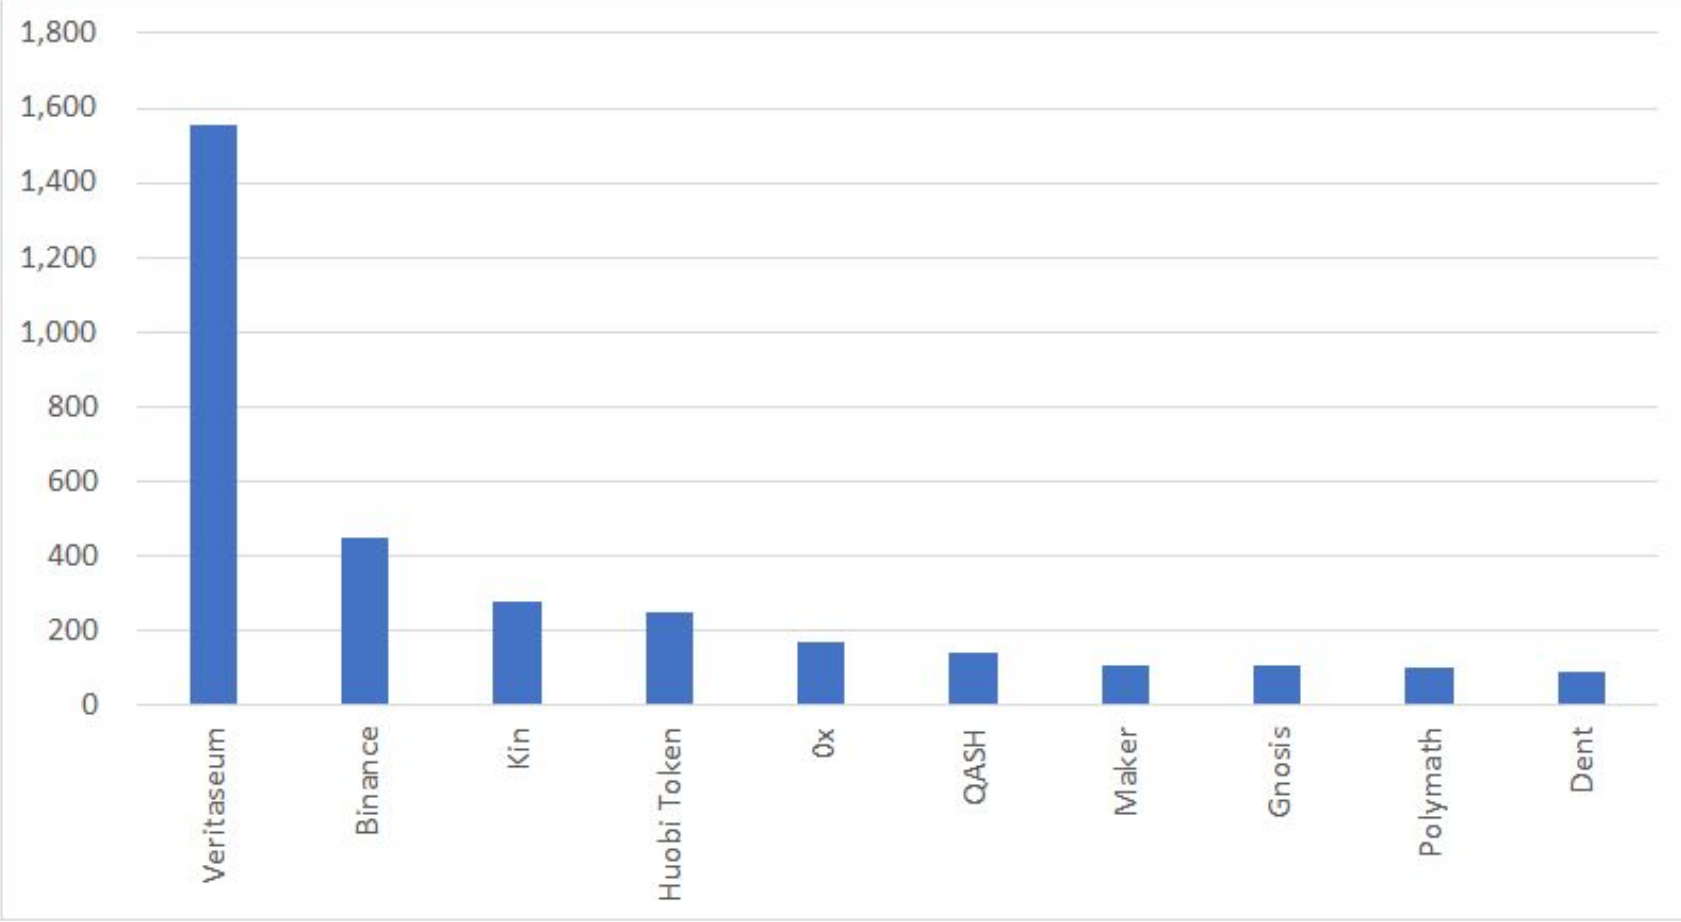
Value of coins transferred out of team controlled address clusters (Own tokens) – US$ million – Top 10
(Source: BitMEX Research, TokenAnalyst, the Ethereum blockchain, Coinmarketcap (for token prices))
(Notes: Price data up to Jan 2019, token data up to Dec 2018. Huobi and Qash are exchanges and the tokens appear to have been sent to their respective platforms. It is possible the above figures represents sales/”cashing out”, although there could be other reasons for the transfers)
Current value of coins in team controlled address clusters (Own tokens) – US$ million – Top 10
(Source: BitMEX Research, TokenAnalyst, the Ethereum blockchain, Coinmarketcap (for token prices))
(Notes: Price data up to Jan 2019, token data up to Dec 2018)
The raw data – Team holdings of own tokens – US$ million
| Token | Value at ICO | Post ICO issuance | Transfers away from team cluster | Loss in value | Current value |
| VERI | 4,762 | 0 | (15) | (3,196) | 1,552 |
| NOAH | 4,478 | 0 | (4,423) | 55 | |
| KIN | 980 | 0 | (0) | (703) | 277 |
| AGI | 863 | 0 | (27) | (814) | 22 |
| POLY | 842 | 0 | (17) | (727) | 99 |
| HT | 643 | 0 | (366) | (29) | 248 |
| GNO | 636 | 0 | 0 | (533) | 103 |
| QASH | 617 | 0 | (177) | (300) | 140 |
| MKR | 596 | 0 | (46) | (445) | 105 |
| TEL | 452 | 0 | (8) | (408) | 36 |
| ITC | 334 | 0 | (7) | (323) | 4 |
| ZRX | 333 | 0 | (9) | (155) | 169 |
| ZIP | 266 | 0 | 0 | (226) | 41 |
| BLZ | 256 | 0 | (32) | (207) | 17 |
| GTO | 241 | 0 | (67) | (157) | 17 |
| BNB | 219 | 110 | 0 | 118 | 447 |
| BTO | 198 | 0 | (28) | (165) | 5 |
| ICX | 160 | 0 | (79) | (67) | 14 |
| ETHOS | 153 | 0 | (15) | (123) | 16 |
| TNT | 152 | 0 | (10) | (133) | 9 |
| CENNZ | 143 | 0 | (6) | (121) | 15 |
| AST | 141 | 0 | (24) | (104) | 13 |
| KEY | 132 | 0 | (2) | (124) | 6 |
| BIX | 118 | 2 | 0 | (85) | 35 |
| CVC | 117 | 0 | (1) | (75) | 41 |
| FSN | 100 | 0 | (6) | (75) | 19 |
| OCN | 100 | 0 | (31) | (64) | 5 |
| DEW | 95 | 0 | (1) | (87) | 7 |
| SRN | 89 | 0 | (15) | (69) | 4 |
| MDS | 88 | 0 | (8) | (75) | 5 |
| EDO | 83 | 0 | (11) | (58) | 15 |
| ABT | 76 | 0 | 0 | (71) | 5 |
| WTC | 69 | 0 | (50) | 17 | 37 |
| INS | 68 | 0 | 0 | (66) | 2 |
| PPT | 65 | 0 | (55) | (5) | 5 |
| IHT | 65 | 0 | (2) | (58) | 5 |
| CPT | 65 | 0 | (0) | (43) | 21 |
| SPHTX | 64 | 0 | 0 | (60) | 4 |
| DRGN | 58 | 0 | (47) | (2) | 8 |
| MCO | 54 | 0 | (89) | 72 | 37 |
| XYO | 54 | 0 | (6) | (23) | 25 |
| RCN | 54 | 0 | 0 | (48) | 6 |
| DPY | 47 | 0 | (23) | (22) | 2 |
| THETA | 45 | 0 | 0 | (30) | 16 |
| MANA | 41 | 0 | (95) | 127 | 73 |
| R | 40 | 0 | 0 | 35 | 75 |
| APPC | 35 | 0 | (24) | (9) | 2 |
| CMT | 33 | 0 | (1) | (25) | 8 |
| FUEL | 32 | 2 | 0 | (29) | 5 |
| CREDO | 31 | 0 | (0) | (6) | 25 |
| DMT | 31 | 0 | (17) | (12) | 2 |
| POWR | 30 | 166 | 0 | (154) | 42 |
| LRC | 30 | 8 | 0 | (21) | 17 |
| WPR | 26 | 0 | 0 | (24) | 2 |
| AMB | 24 | 0 | 0 | (17) | 7 |
| RNT | 22 | 0 | (1) | (15) | 7 |
| ENG | 22 | 0 | 0 | (12) | 10 |
| COB | 22 | 0 | (10) | (5) | 7 |
| GTC | 20 | 126 | 0 | (141) | 6 |
| REN | 19 | 0 | (3) | (13) | 3 |
| DENT | 19 | 635 | 0 | (564) | 90 |
| UTT | 19 | 0 | (0) | (11) | 8 |
| AE | 13 | 0 | (19) | 6 | 0 |
| DATA | 11 | 0 | (3) | (6) | 3 |
| BRD | 10 | 17 | 0 | (21) | 7 |
| SNGLS | 8 | 0 | 0 | (3) | 6 |
| LEND | 6 | 0 | (7) | 3 | 2 |
| RLC | 6 | 0 | (5) | 2 | 3 |
| PLR | 6 | 3 | 0 | (4) | 5 |
| HVN | 5 | 0 | (5) | 0 | 1 |
| CVT | 5 | 11 | 0 | (8) | 9 |
| LYM | 5 | 0 | (4) | 0 | 2 |
| SAN | 5 | 0 | (7) | 5 | 4 |
| GNT | 4 | 0 | (12) | 31 | 23 |
| KICK | 3 | 2 | 0 | (4) | 1 |
| DGD | 2 | 0 | (5) | 5 | 3 |
| EDG | 2 | 0 | (29) | 28 | 1 |
| ENJ | 2 | 0 | (0) | 1 | 2 |
| RHOC | 1 | 14 | 0 | (13) | 1 |
| ARN | 0 | 6 | 0 | (6) | 1 |
| ELF | 0 | 45 | 0 | (40) | 6 |
| PAY | 0 | 142 | 0 | (132) | 11 |
| DAI | 0 | 1 | 0 | 0 | 1 |
| HPB | 0 | 134 | 0 | (119) | 15 |
| CRPT | 0 | 3 | 0 | (2) | 1 |
| HOT | 0 | 7 | 0 | 0 | 7 |
| SALT | 0 | 95 | 0 | (92) | 3 |
| NAS | 0 | 71 | 0 | (50) | 21 |
| NGC | 0 | 12 | 0 | (11) | 1 |
| CPC | 0 | 12 | 0 | (9) | 3 |
| GVT | 0 | 3 | 0 | (2) | 2 |
| SNM | 0 | 14 | 0 | (11) | 2 |
| BTM | 0 | 9 | 0 | (1) | 8 |
| QRL | 0 | 7 | 0 | (6) | 2 |
| NULS | 0 | 71 | 0 | (52) | 19 |
| POE | 0 | 58 | 0 | (54) | 4 |
| TEN | 0 | 29 | 0 | (15) | 13 |
| MTL | 0 | 188 | 0 | (177) | 11 |
| WINGS | 0 | 18 | 0 | (15) | 3 |
| SPANK | 0 | 106 | 0 | (93) | 13 |
| OMG | 0 | 195 | 0 | (154) | 41 |
| STORJ | 0 | 133 | 0 | (85) | 48 |
| BAT | 0 | 38 | 0 | 14 | 52 |
| VIBE | 0 | 10 | 0 | (8) | 2 |
| IOST | 0 | 218 | 0 | (185) | 34 |
| Total | 21,513 | 2,723 | (14,805) | (4,396) | 5,035 |
(Source: BitMEX Research, TokenAnalyst, the Ethereum blockchain, Coinmarketcap (for token prices))
(Notes: Price data up to Jan 2019, token data up to Dec 2018)
Conclusion & summary data
This analysis highlights the lack of standards and transparency in the ICO market, especially when it comes to the allocation of tokens to the founding team’s wallet. Teams were often able to mint, burn, buy, and sell (their own) tokens at will, without analysts being able to easily track what is occurring. We would often see tokens in exchange clusters, and it was hard to tell whether the token project “paid” the exchange to list tokens or the token project just transferred their treasury to the exchange to cash out.
To be fair, perhaps we could improve the analysis by spending more time reading the specific documentation of the individual projects and by speaking to the teams involved. This would have resulted in a more robust dataset.
But one thing about ICOs that many people often overlook, is that ICO teams often make profits in two ways from the issuance:
- Selling the newly issued tokens (often for Ethereum), and,
- Issuing themselves their own tokens.
Our October 2018 report focused on the former, while this report focuses on the latter. The summary table below combines the figures from both of our reports.
| ICO team profits | US$ billion |
| ICO process | |
| Ethereum Raised | 5.4 |
| Own tokens issued to founding teams | 24.2 |
| Total raised | 29.6 |
| Changes in coin price | |
| Ethereum profits/(losses) – Mostly realised | 0.8 |
| Own token profits/(losses) – Mostly unrealised | (17.6) |
| Total profits/(losses) post issuance | (16.8) |
| Total ICO team profits | 12.8 |
(Source: BitMEX Research, TokenAnalyst, the Ethereum blockchain, Coinmarketcap (for token prices))
(Notes: Ethereum price data to October 2018, Own token price data to January 2019)
Although, as we have repeatedly explained, there are many inaccuracies and assumptions involved in producing the data. Based on our methodology, it appears as if ICO teams have profited by almost US$13 billion from this ICO process. In our view, this money was made incredibly easily, with very little work, accountability or transparency. Therefore, ICOs have proven to be an extremely attractive way for project founders to raise funds. The results for investors of course, have not been as attractive.
The ICO cycle now appears to be dying down to some extent and it’s much harder to raise funds than it was in late 2017. But with so much money made and lost, the events of 2017 and early 2018 are not likely to be quickly forgotten. Entrepreneurs will remember the success (and keep trying to raise money) while investors will remember the pain. A repeat of this cycle within a few years is therefore less likely than many may think.