Abstract: Following on from our first piece on ICOs in September 2017, which focused on the team members and advisors, in this report we work with TokenAnalyst to track the Ethereum balances of the ICO projects over time. We look at the amount of Ethereum raised and the US$ value of the gains and losses caused by changes in the Ethereum price, for each project. We conclude that rather than suffering because of the recent fall in the value of Ethereum, at the macro level, the projects appear to have already sold almost as much Ethereum as they raised (in US$ terms). Of the Ethereum still held by the projects, even at the current c$230 price, projects are still sitting on unrealised gains, rather than losses.
Please click here to download the pdf version of this report
Ethereum raised by 222 ICOs – Macro analysis
| ETH | US$m | |
| ETH raised by EOS | 7,211,776 | 3,824 |
| ETH raised by other projects | 7,972,003 | 1,639 |
| Total ETH raised | 15,183,779 | 5,463 |
| ETH sold by EOS | (7,211,776) | (3,892) |
| ETH transferred out/sold by other projects | (4,113,345) | (1,560) |
| Total ETH transferred out/sold | (11,325,121) | (5,452) |
| ETH Balance remaining (Sept 2018) | 3,858,659 | 830 |
(Source: Ethereum Blockchain, BitMEX Research, TokenAnalyst, Token Data, Price data from Etherscan)
Overall profits & losses caused by changes in the price of Ethereum – US$ million
| Realised gains | |
| EOS project gains | 68 |
| Gross realised ETH gains by other projects | 692 |
| Gross realised ETH losses by other projects | (34) |
| Net realised gains | 727 |
| Unrealised gains | |
| EOS unrealised gains | n/a |
| Gross unrealised ETH gains | 403 |
| Gross unrealised ETH losses | (311) |
| Net unrealised gains | 93 |
| Total net gains | 819 |
(Source: Ethereum Blockchain, BitMEX Research, TokenAnalyst, Token Data, Price data from Etherscan)
Notes:
- This analysis only considers the Ethereum balances of the ICO projects, which we have tracked on the Ethereum blockchain. Funds raised in currencies other than Ethereum are not considered nor is the balance of the new token created by the project. Our reported totals are therefore lower than some other sources. Therefore while our figures may be an underestimate, one at least has a degree of assurance that the balance is calculated independently of the project. At the same time we are missing several projects such as Tron, as we have not identified a treasury address or an address cluster.
- The estimate of the value of Ethereum raised is calculated by taking the highest value of Ethereum inside the address cluster of each project at any point in time (with the exception of EOS). This will result in some inaccuracies.
- The estimate of the value of US$ raised is calculated by using the average ETH price during the ICO period. This should therefore be considered as a rough and unreliable estimate.
- The estimate for the realised gains was calculated by taking the month end Ethereum balance for the address cluster of each project every month and then looking at the reduction in the Ethereum holdings. The average Ethereum price for each month was then used to estimate the US$ value of Ethereum that was sold. This is likely to be inaccurate and it is possible the project retains ownership of the Ethereum or that the Ethereum was not sold for US$.
- While we believe our estimates at the macro level may be reliable, at the individual project level our figures are likely to be unreliable. We apologise for any errors or inappropriate assumptions.
Commentary on the overall Ethereum holdings and sales
The Ethereum price has fallen almost 85% from the US$1,400 peak price in around December 2017. As we mentioned back then, the value of Ethereum and the associated crypto-currencies was high and there was significant downside risk. The large fall in the value of Ethereum led some to question if there could be a “downward price spiral” due to the concentrated Ethereum holdings of the ICO projects. The theory being that many ICO projects were sitting on a large treasure trove of Ethereum and that as the price of Ethereum fell, these projects were going to “panic sell’, fearful of being the last project holding their Ethereum bags.
Our analysis, along with the team from TokenAnalyst, shows that on a macro level, the above theory may not be applicable. Of the 222 projects which we looked at, they raised US$5.5 billion worth of Ethereum and they may have already sold almost exactly the same amount (just US$11 million less). These ICOs currently hold 3.8 million Ethereum, around 25% of the Ethereum they originally raised. However, in US$ terms, these projects have essentially already sold the same amount of Ethereum which they originally raised, leaving them a nice holding of US$830m of Ethereum.
The figures are somewhat skewed by the EOS project, which remarkably raised around 70% of the Ethereum (by US$ value) of all the projects on our list, if our estimates are correct. However, even excluding EOS, the overall picture remains similar to what we described above, with projects selling almost the same in US$ terms as the amount they originally raised.
Despite the 85% reduction in the Ethereum price from its peak, the projects have realised gains of US$727 million due to profits from Ethereum have they already sold, often selling before the recent price crash. The 3.8m Ethereum still on the balance sheets of these projects may not have that much of an impact on the Ethereum price, as it represents a reasonably small proportion of the 102 million supply of Ethereum. At the same time, on a macro level, the projects may be feeling reasonably confident rather than needing to panic sell.
As for the unrealised profit and loss situation, the ICOs are sitting on net gains of US$93 million based on an Ethereum price of US$215. It may surprise some that ICOs are still in a net unrealised profit situation, but many of the Ethereum balances were built up before the price rally at the end of 2017, as the chart below indicates. Although some individual projects may be suffering significant losses. Gross unrealised losses, the sum of all the losses for the projects which have lost money by holding Ethereum, are US$311 million, which is more than offset by US$403 million in gross unrealised gains.
Total tracked Ethereum holdings of the 222 ICO projects (daily data) vs Ethereum price
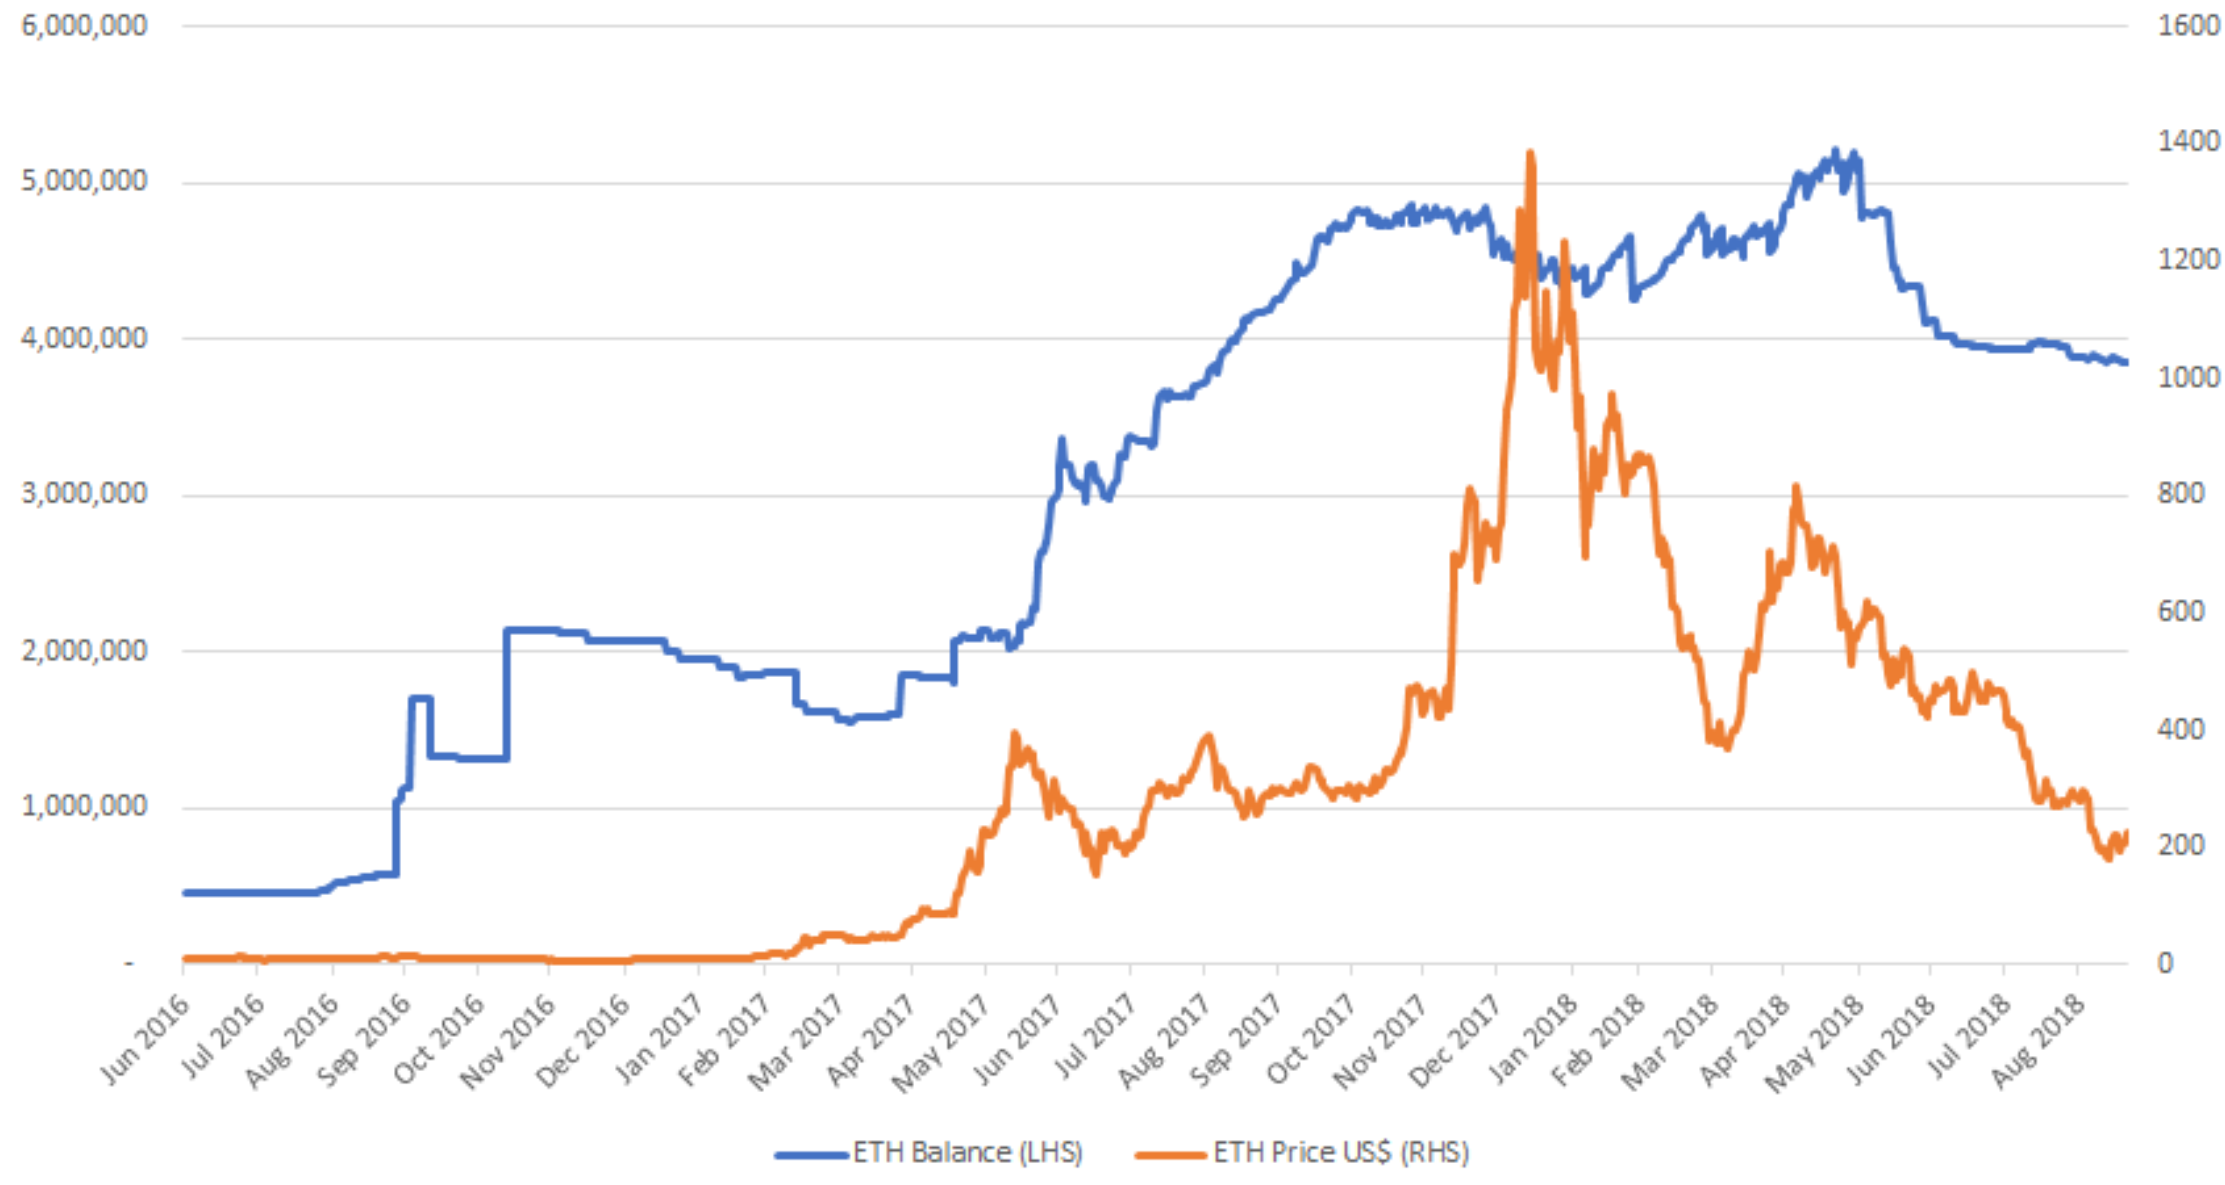
(Source: Ethereum Blockchain, BitMEX Research, TokenAnalyst, Token Data, Price data from Etherscan)
As the above chart indicates, over the 26 month period, the peak Ethereum holdings of the ICO treasury accounts were only 5.1 million, significantly lower than the 15.2 million which was raised (8.0 million raised when excluding EOS). This may indicate that Ethereum proceeds from earlier ICOs were reinvested in new projects, either directly or more likely indirectly, after being sold on the market.
Breakdown of Ethereum holdings data by ICO project
Top 20 ICO projects ranked by total gains from change in value of Ethereum holdings – US$ million
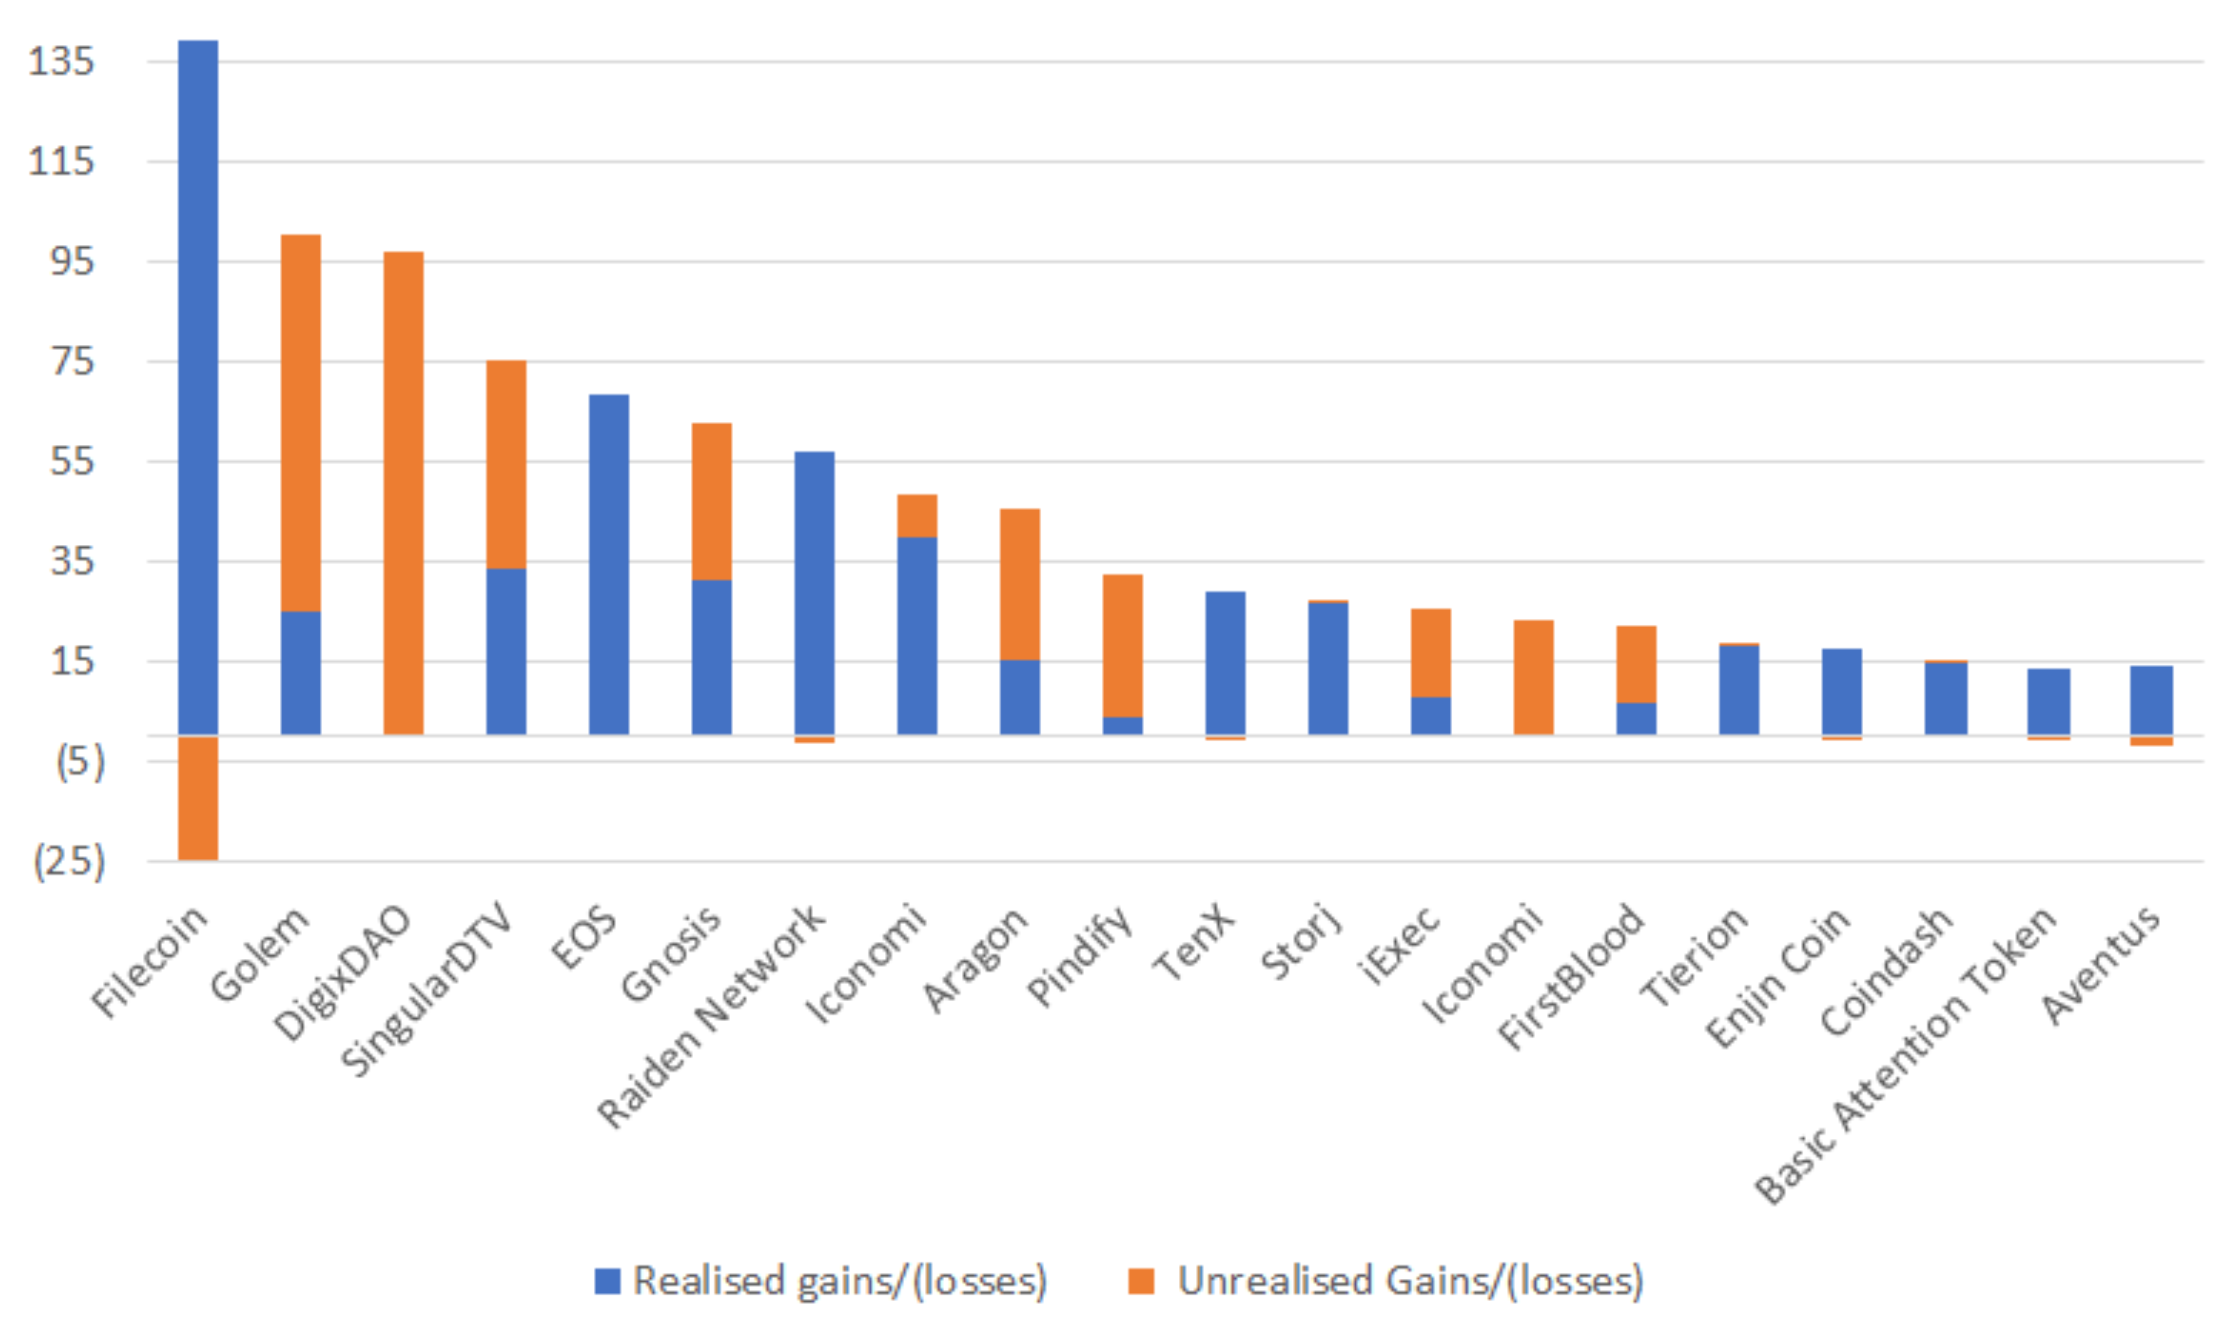
(Source: Ethereum Blockchain, BitMEX Research, TokenAnalyst, Token Data, Price data from Etherscan)
Top 20 ICO projects ranked by total loss from change in value of Ethereum holdings – US$ million
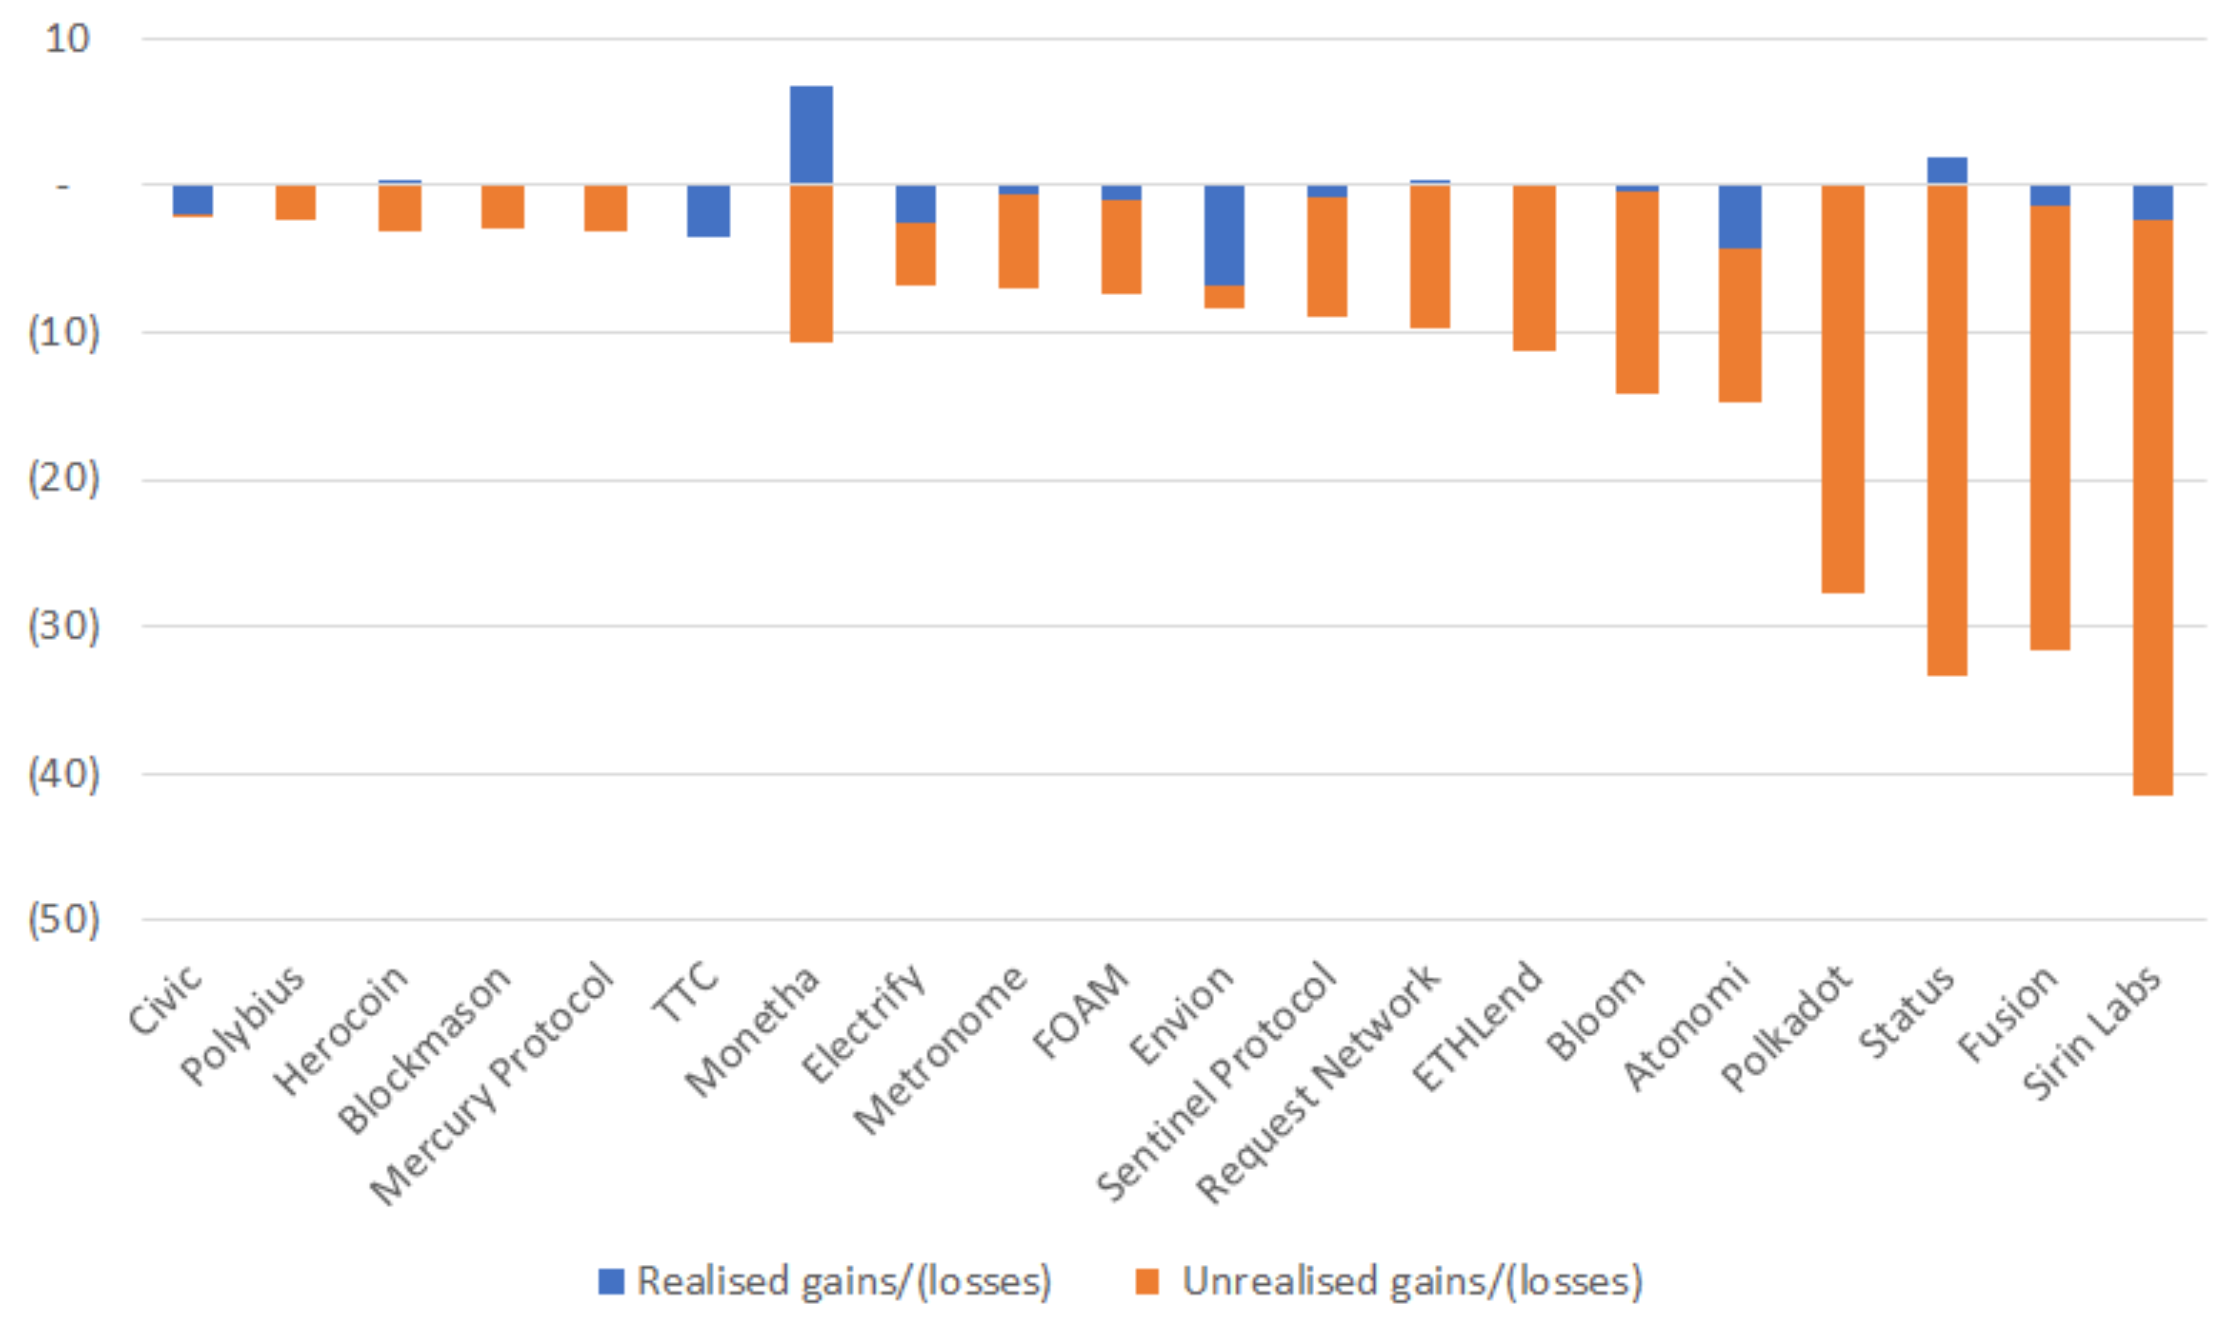
(Source: Ethereum Blockchain, BitMEX Research, TokenAnalyst, Token Data, Price data from Etherscan)
Projects ranked by reported US$ raised
| ICO | ETH Raised based on BitMEX Research analysis | US$ million value of ETH raised based on BitMEX Research analysis | Token Data reported total raise (US$ million) |
| EOS | 7,211,776 | 3,824.0 | 4,234.3 |
| Tezos | 361,122 | 88.1 | 230.6 |
| Filecoin | 461,442 | 150.4 | 200.0 |
| Sirin Labs | 88,906 | 64.1 | 157.9 |
| Bancor Protocol | 193,830 | 76.5 | 153.0 |
| Polkadot | 306,276 | 93.6 | 144.3 |
| Status | 299,902 | 105.1 | 107.7 |
| Envion | 46,735 | 42.0 | 100.0 |
| Kin | 168,732 | 46.1 | 98.5 |
| TenX | 210,500 | 64.1 | 83.1 |
| BankEx | 65,129 | 39.2 | 70.6 |
| Kyber Network | 95,947 | 24.7 | 49.3 |
| Gridplus | 10,410 | 3.1 | 45.7 |
| Fusion | 50,224 | 42.6 | 41.7 |
| Bloom | 43,871 | 27.5 | 41.4 |
| Monetha | 95,000 | 36.9 | 36.4 |
| AirSwap | 76,625 | 23.0 | 36.3 |
| Basic Attention Token | 57,645 | 13.2 | 36.0 |
| Ether Party | 12,105 | 3.7 | 33.5 |
| Request Network | 100,000 | 33.7 | 33.3 |
| Civic | 40,000 | 13.0 | 33.0 |
| Raiden Network | 109,532 | 32.7 | 31.9 |
| Polybius | 27,502 | 8.2 | 31.6 |
| Electrify | 10,639 | 9.1 | 30.0 |
| Storj | 122,000 | 19.2 | 30.0 |
| Sentinel Protocol | 26,548 | 15.1 | 27.5 |
| Paypie | 61,082 | 18.5 | 26.8 |
| Tierion | 95,985 | 18.9 | 25.0 |
| Aragon | 277,199 | 24.1 | 25.0 |
| Atonomi | 42,847 | 26.0 | 25.0 |
| aeternity | 74,271 | 17.8 | 25.0 |
| 0X | 84,647 | 25.3 | 24.0 |
| Enjin Coin | 61,584 | 19.0 | 23.0 |
| Aventus | 59,882 | 20.3 | 20.1 |
| Uptoken | 5,449 | 2.1 | 18.9 |
| Change | 48,129 | 14.3 | 17.5 |
| Covesting | 2,121 | 0.9 | 17.4 |
| Decent Bet | 52,558 | 16.0 | 16.2 |
| ETHLend | 36,486 | 11.9 | 16.1 |
| Maecenas | 50,066 | 14.6 | 15.7 |
| Cofoundit | 61,800 | 15.0 | 14.9 |
| GATCOIN | 8,975 | 5.4 | 14.7 |
| TTC | 20,489 | 14.1 | 14.2 |
| Mysterium Network | 56,322 | 12.9 | 14.1 |
| Pindify | 78,032 | 46.7 | 14.0 |
| POA Network | 41,176 | 13.7 | 13.7 |
| Cobinhood | 32,064 | 9.5 | 13.4 |
| Dragonchain | 24,972 | 7.6 | 13.2 |
| FOAM | 38,028 | 15.0 | 12.7 |
| Gnosis | 250,000 | 12.5 | 12.5 |
| iExec | 120,883 | 5.8 | 12.2 |
| Adshares | 5,492 | 2.2 | 12.1 |
| Santiment | 45,002 | 12.0 | 12.1 |
| Populous | 15,310 | 5.2 | 10.8 |
| Iconomi | 314,939 | 4.0 | 10.7 |
| Playkey | 10,248 | 3.6 | 10.5 |
| Mercury Protocol | 15,732 | 5.1 | 10.5 |
| Metronome | 26,389 | 13.1 | 10.2 |
| District0X | 43,169 | 9.1 | 9.8 |
| Indorse | 22,800 | 7.4 | 9.0 |
| Golem | 820,003 | 8.3 | 8.6 |
| Aion | 26,920 | 8.2 | 7.8 |
| Coindash | 43,488 | 8.3 | 7.5 |
| SingularDTV | 570,002 | 6.8 | 7.5 |
| Atlant | 9,294 | 2.8 | 6.6 |
| DOVU | 8,542 | 2.7 | 6.3 |
| DigixDAO | 466,648 | 3.5 | 5.5 |
| FirstBlood | 465,313 | 6.1 | 5.5 |
| Augur | 610 | 0.0 | 5.3 |
| Humaniq | 41,456 | 2.0 | 5.2 |
| STeX | 3,819 | 1.2 | 4.5 |
| Matryx | 4,209 | 1.3 | 4.5 |
| Auctus | – | – | 4.0 |
| ALIS | 13,183 | 3.9 | 3.8 |
| Crystal Clear Services | 3,542 | 1.1 | 3.4 |
| Melonport | 8,028 | 0.1 | 2.9 |
| Bitjob | 8,034 | 2.3 | 2.8 |
| Swarm Fund | 2,825 | 0.8 | 2.5 |
| Blockbid | – | – | 2.4 |
| Mingo | 3,305 | 2.2 | 2.4 |
| Privatix | 43 | 0.0 | 2.4 |
| Wolk | 17,338 | 5.1 | 2.2 |
| Herocoin | 41,044 | 12.1 | 2.0 |
| Total | 15,034,170 | 5,427 | 6,764 |
(Source: Ethereum Blockchain, BitMEX Research, TokenAnalyst, Token Data, Price data from Etherscan, Diar as a cross reference)
(Note: The totals are slightly smaller than the opening table in this report as some smaller projects have been excluded)
The peculiarities of EOS
As we alluded to above, since EOS sold its Ethereum regularly during the ICO period, we needed to use a different methodology to analyse EOS’s Ethereum holdings. We identified 171 EOS “internal transactions” which transferred Ethereum outside of the EOS address cluster. The total value of these transfers was 7.2 million ETH or US$3.9 billion based on the closing price of Ethereum on the day of each of these transfers. Using these figures and the average Ethereum price during the ICO, we believe EOS raised US$3.8 billion worth of Ethereum, reasonably close to the reported US$4.2 billion figure, which presumably includes money raised in currencies other than Ethereum.
Unlike other projects we therefore do not have the same degree of confidence that the 7.2 million Ethereum balance was not double counted (i.e. The EOS project receiving investments in the form of Ethereum and then recycling those same Ethereum coins back into the ICO to inflate the amount raised). However, we have no particular reason to believe this recycling occurred and the 7.2 million Ethereum which was transferred out of the smart contract can give a degree of assurance the raising was genuine. We are merely pointing out that the level of assurance is lower than for other projects in our analysis, based on our methodology.
Conclusion
We conclude that the ICO treasury accounts have a much lower level of exposure to the price of Ethereum than many may have thought. The ICO projects or project teams essentially made out like bandits, at least with respect to the Ethereum they raised. As a tool to raise funds, the ICOs have clearly been a phenomenal success, to such an extent that even a further significant fall in the value of Ethereum will barely make a dent into the success.
Quite what this means for the Ethereum price going forwards is unclear, however we believe we have shown the “panic sell” thesis is either false or will only occur to a lesser extent than some expect.
Whether these projects invest the money well and develop useful products and services is of course another question. In our view the level of accountability in some of these ICOs is low, for instance even obtaining information about the amount raised, which currencies the raise occurred in, which Ethereum addresses are used and if the funds are spent/sold or not, can be challenging. Therefore fruits of these investments may disappoint in our view. Actually many of these projects are competing over the same scarce resources, developers. One could argue that the volume of capital obtained by these ICOs could inflate the cost of these resources (perhaps the less experienced developers). This may not only plague the crypto-currency ecosystem with higher costs, but also to some extent some startups in the wider technology industry, for many years. Whether our cynical view is right or not, only time will tell.