The PBOC is back at it again. Today they devalued the Yuan by the most in 2 months. Their first shock and awe campaign sliced 4% off the Yuan’s value vs. the USD. Then the PBOC sold US Treasuries to support the CNY in the open market.
Since August, the PBOC has been hard at work stemming the enormous flow of capital fleeing China. The $50,000 per year FX limit is beginning to be enforced by banks. There is now a yearly 100,000 CNY limit on overseas UnionPay withdrawals. And I have heard anecdotal stories about the closure black market CNY / HKD money changers in China and Hong Kong.
Today’s action might be the resumption of the devaluation trend the PBOC embarked upon this summer. With the closure of the easy, cheap, and convenient ways to squirrel cash out of China, Bitcoin becomes more attractive. If Bitcoin emerges as a legal means to export capital out of China, the premium for it onshore in China will rise.
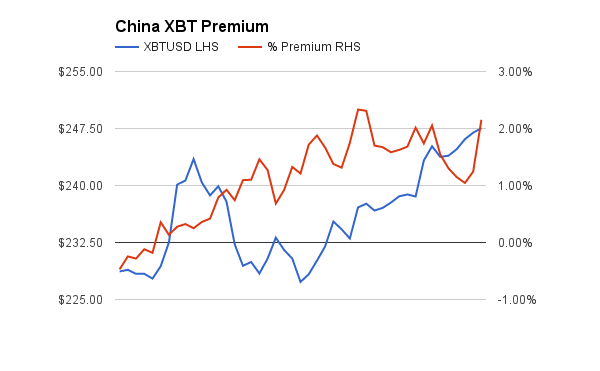
In my post China Bitcoin Premium Points To Moon, I presented a one month chart of the Bitcoin premium (OKCoin XBTCNY vs. Bitstamp XBTUSD) starting August 30th. The above chart is an extension of that time series. The premium dipped to 1%, but during the recent rally has resumed its climb above 2%. If this premium continues to rise above 5%, then we know China truly appreciates Bitcoin’s potential as a means of wealth preservation.
If the PBOC renews its devaluation of the Yuan, watch this chart closely. A lot of money through a small door will spell riches for those positioned correctly.