Abstract: Cryptocurrency prices have fallen significantly in the past few weeks. In this note, we analyse the impact this price decline may have on the mining industry. The Bitcoin hashrate has fallen around 31% since the start of November 2018, equivalent to around 1.3 million Bitmain S9 machines. We conclude that many miners are struggling; however, we point out that not all miners have the same costs and that it’s the higher cost miners who switch off their machines first, as the price declines.

Overview
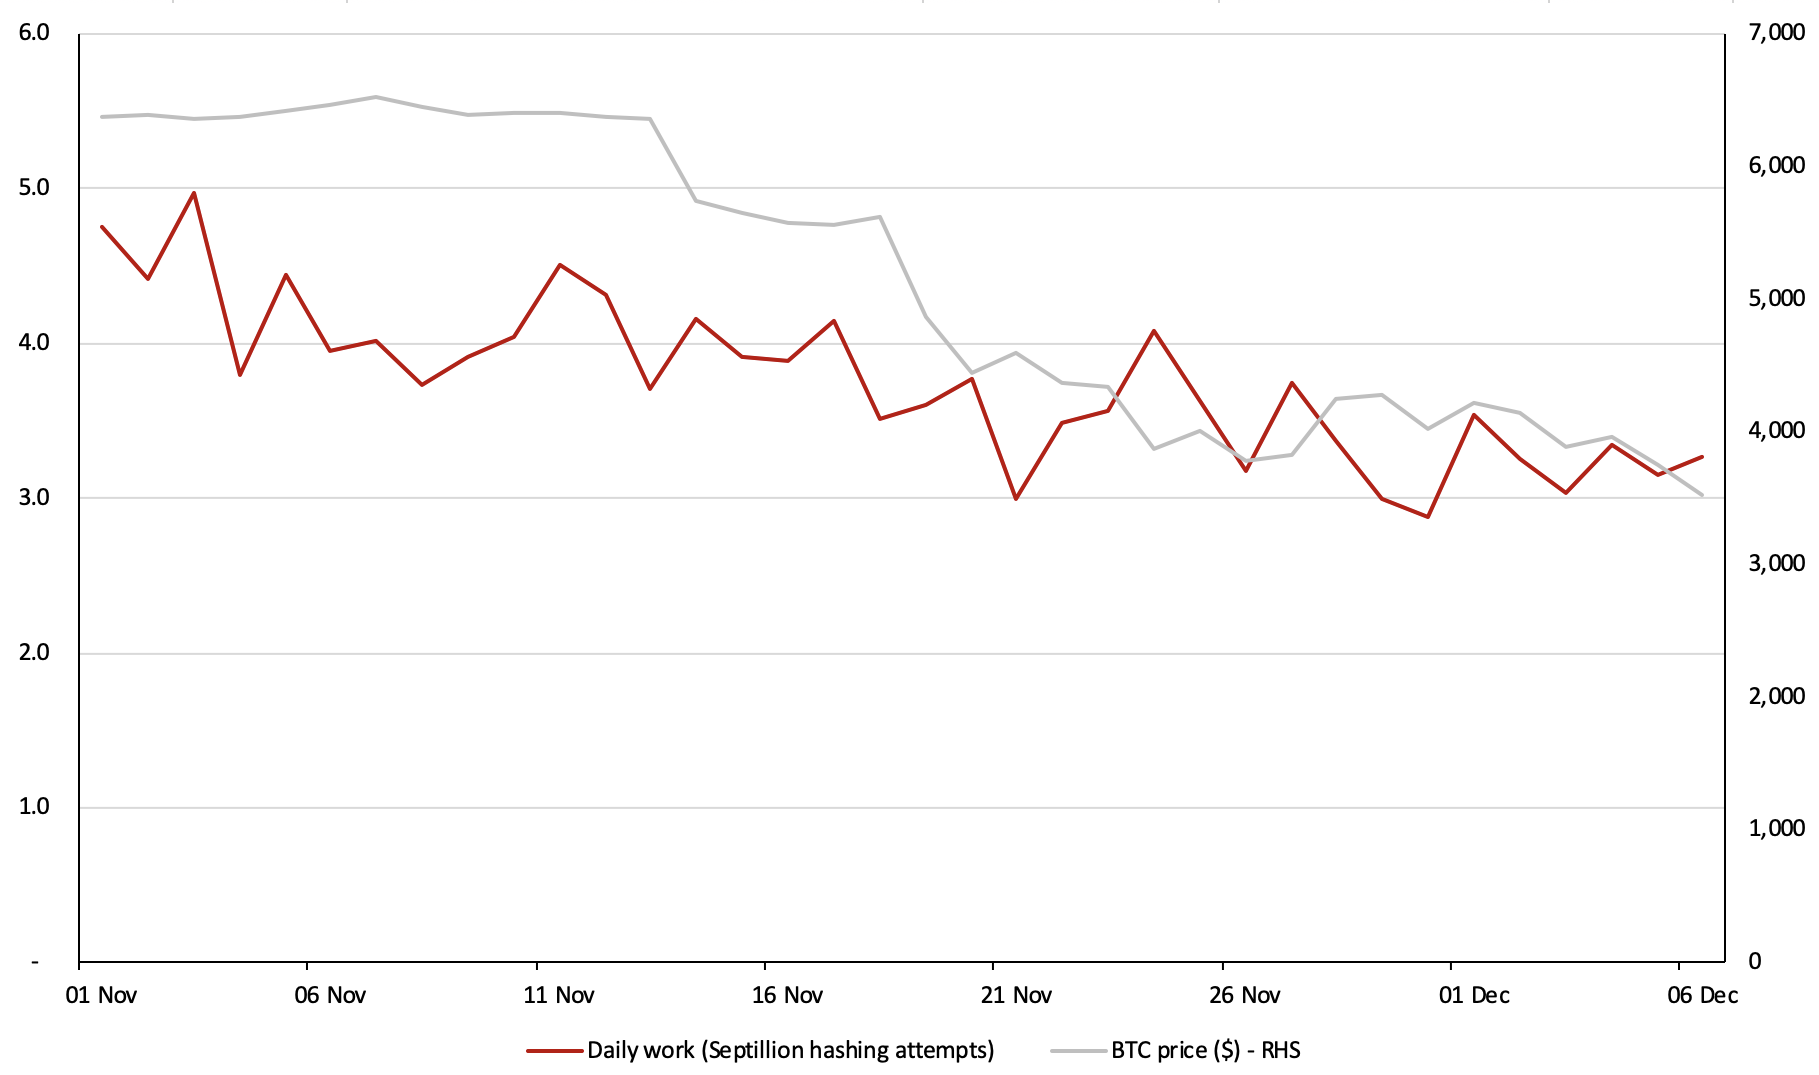
Since the start of November 2018, the Bitcoin price is down around 45%, while in the same period the amount of mining power on the Bitcoin network has fallen by around 31%. According to our estimates, this represents around 1.3 million Bitmain S9 miners being switched off. The mining industry may therefore be under considerable stress right now, due to the falling prices of cryptocurrency.
The prices have so far caused two large downward difficulty adjustments to Bitcoin, 7.4% and 15.1%, on 16th November and 3rd December, respectively. The 7.4% adjustment was the largest since January 2013 and the 15.1% adjustment was the largest since October 2011. The charts below are based on the daily chainwork and therefore reflect changes in network difficulty.
Bitcoin Daily Work Compared to the Falling Price

(Source: BitMEX Research, Poloniex)
Daily Mining Revenue and Cost
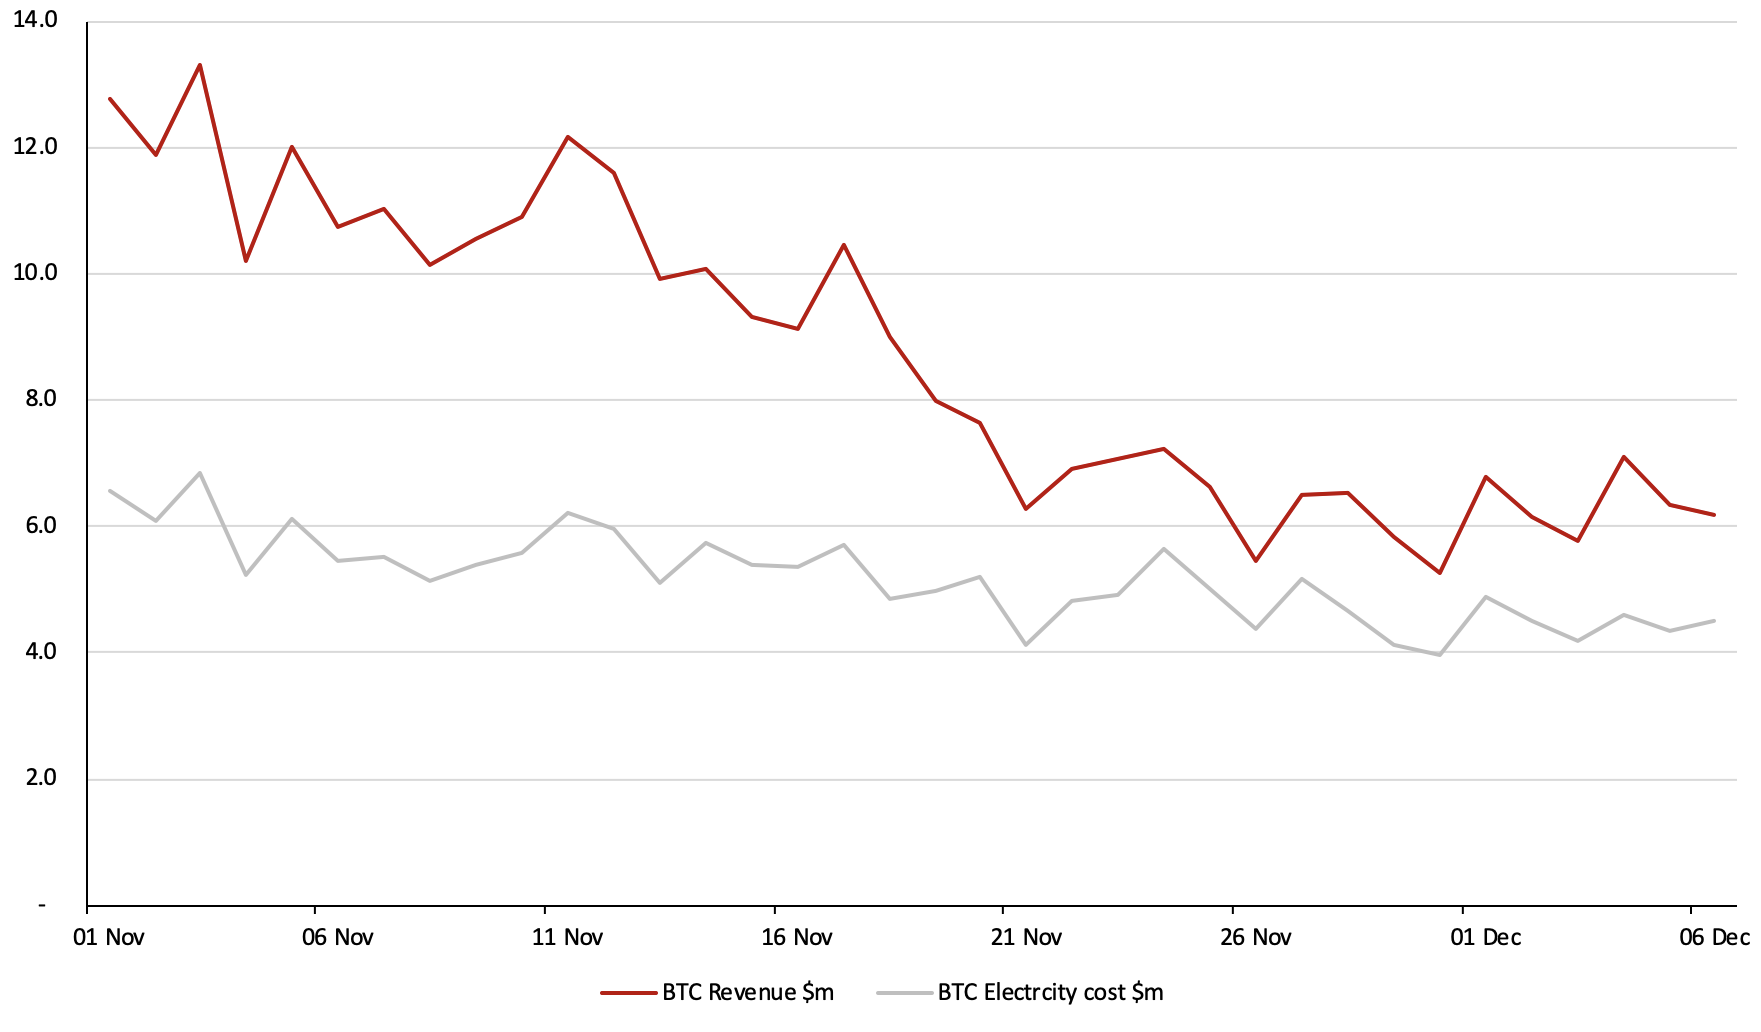
As the chart below illustrates, Bitcoin mining industry revenue has fallen from around $13 million per day at the start of November to around $6 million per day, at the start of December. This drop in incentives was even larger than the fall in the Bitcoin price, due to a delay in the way difficulty adjusts. In the six-day period ending 3rd December, 21.8% fewer blocks than the expected 144 per day were found, as miners left the network before the difficulty adjusted, and as a result, fewer blocks were found. Therefore in the short term, there was a 21.8% fall in mining incentives on top of the impact of the declining price.
Bitcoin Daily Mining Revenue and Expected Electricity Spend – US$m

(Source: BitMEX Research, Poloniex)
(Notes: Assumes an electricity cost of US$0.05 per KWH, assumes advertised Bitmain S9 specification)
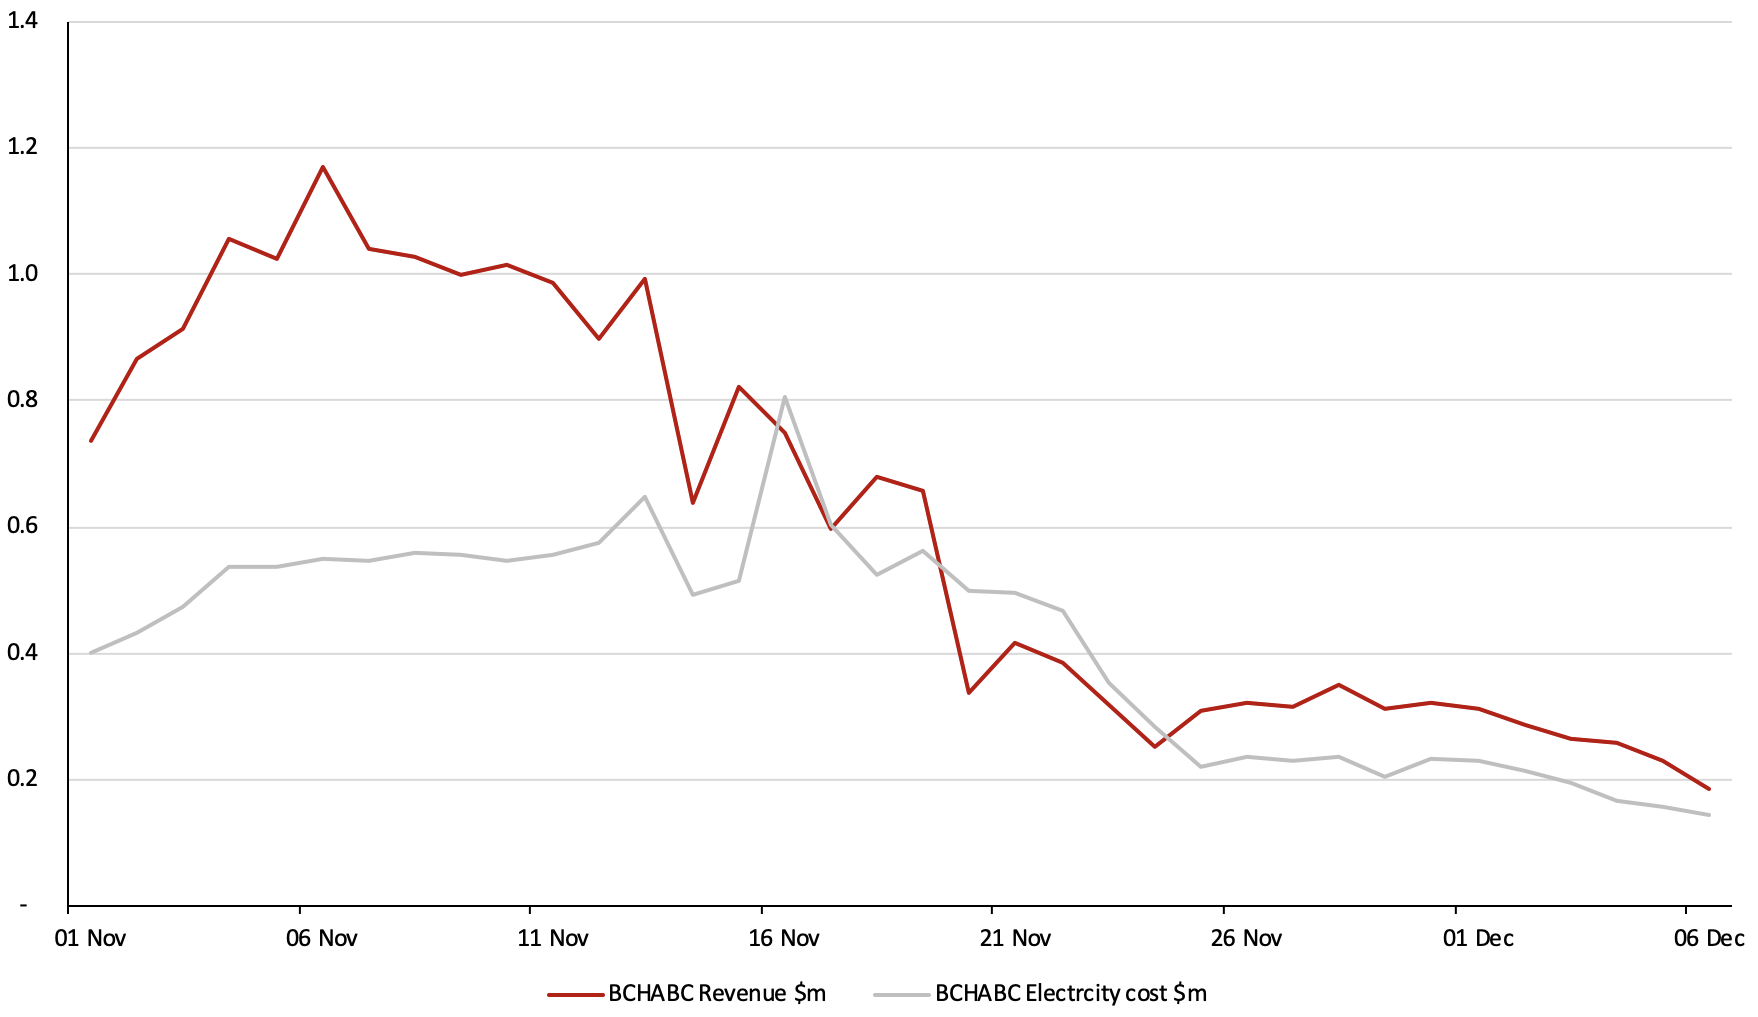
Bitcoin Cash ABC Daily Mining Revenue and Expected Electricity Spend – US$m

(Source: BitMEX Research, Polonies)
(Notes: Assumes an electricity cost of US$0.05 per KWH, assumes advertised Bitmain S9 specification)
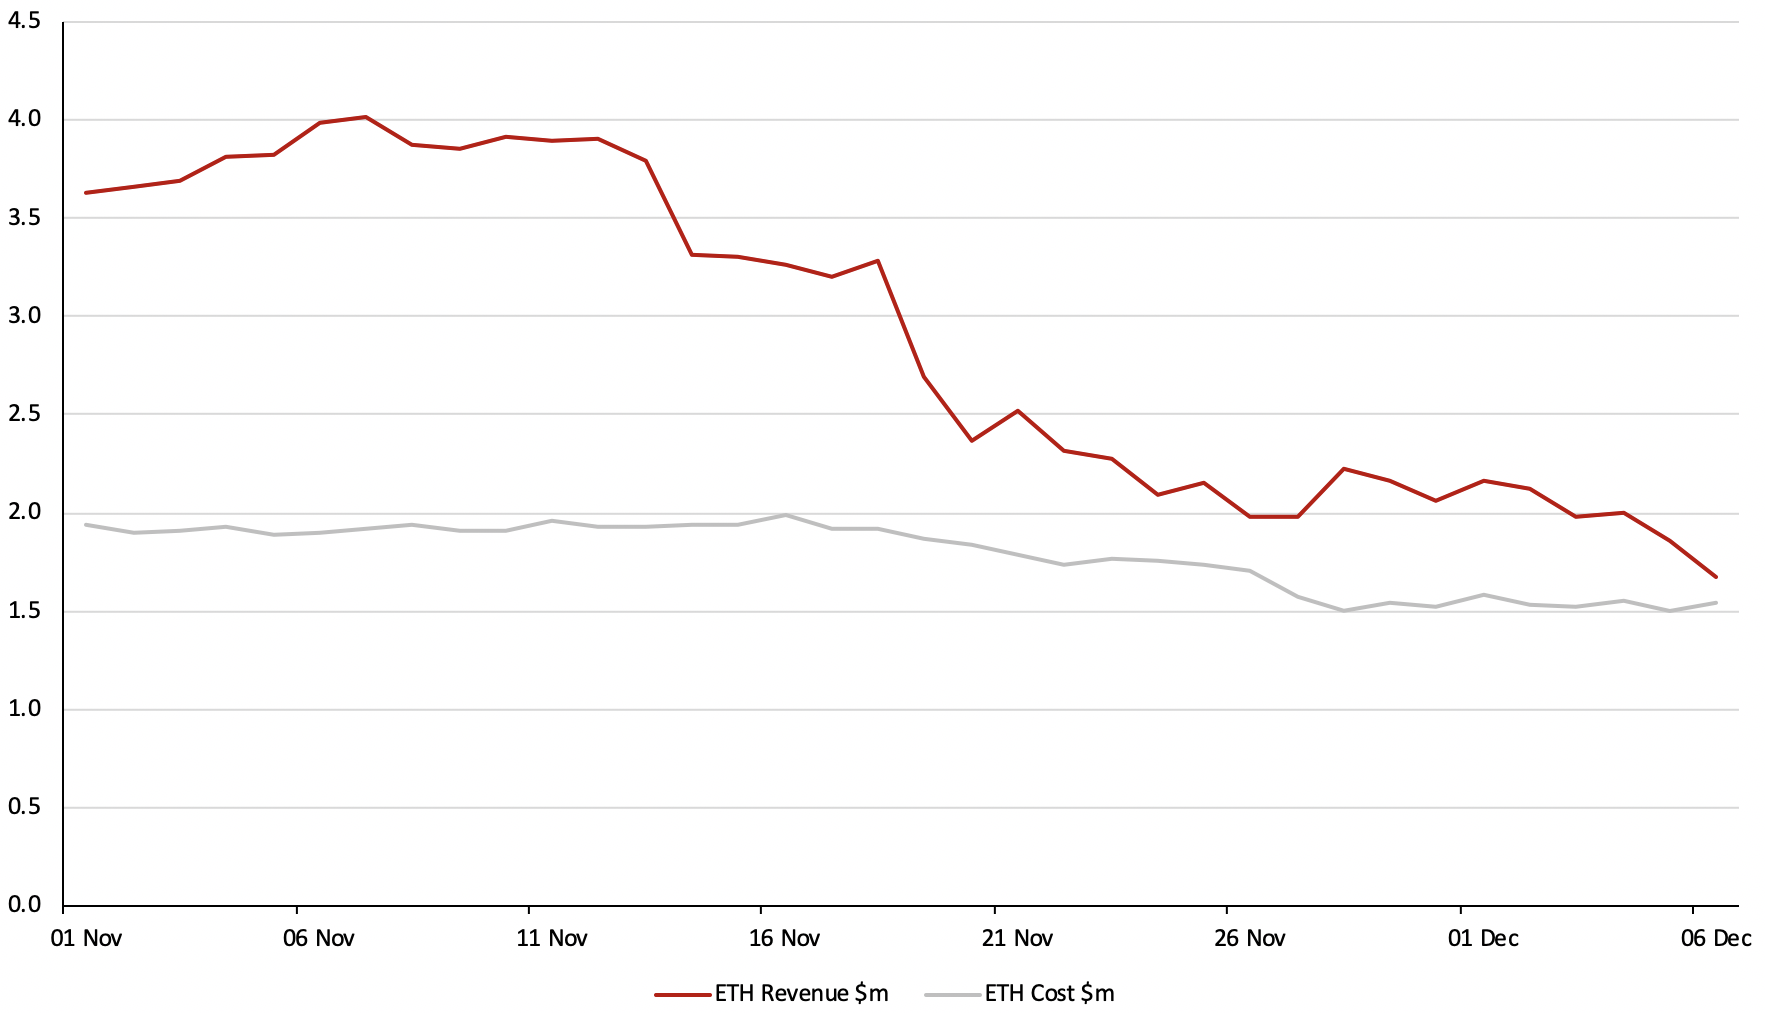
Ethereum Daily Mining Revenue and Expected Electricity Spend – US$m

(Source: BitMEX Research, Polonies)
(Notes: Assumes an electricity cost of US$0.05 per KWH, assumes 32Mh/s at 200W)
Miner Profit Margins
The chart below shows that prior to the recent crash, the industry was making gross profit margins of around 50% (these figures assume electricity is the only cost included in gross profits), while after the price crash, this fell to around 30% for Bitcoin and 15% for Ethereum.
Miner Profit Margin

(Source: BitMEX Research, Poloniex for prices)
Ethereum Mining Profitability
In the period, the Ethereum hashrate has only fallen by 20%, much lower than Bitcoin, (representing around 1.5 million high-end graphics cards), while the price decline has been more significant than Bitcoin, at 54%. Therefore, gross profit margins have declined even more sharply for Ethereum, but it is not clear exactly why this is the case.
There are a few potential reasons. It could be that Ethereum miners are more hobbyist minded and less profit focused, or Ethereum miners could have started from a higher gross profit margin position than Bitcoin, so they are less inclined to monitor the network and switch the miners off when necessary. As the data shows, Ethereum miner gross profit margins now appear significantly lower than Bitcoin, falling to 15% in the last few days, so this could change (Note: This analysis only included electricity costs, when including other costs, mining may be a loss making operation).
Bitcoin Cash ABC Mining Profit Margins
As the above chart shows, the Bitcoin Cash ABC gross profit margin went negative during the split into two coins, Bitcoin Cash ABC and Bitcoin Cash SV. The two camps mined uneconomically in a race to have the most work chain. Ten days after the split, on 25th November, the profitability of mining Bitcoin Cash ABC rapidly climbed up to around the same levels as Bitcoin. This appeared to indicate the end of the “hashwar,” which proved to be almost completely pointless, as the war ending had no clear noticeable impact on either the coins or their value.
As the latest data in the below table shows, the two sides are getting closer again with respect to total work since the split and its possible uneconomic mining resumes.
| Bitcoin Cash ABC | Bitcoin Cash SV | |
| Log2(PoW) | 87.753365 | 87.747401 |
| Blocks | 560,091 | 560,081 |
| Cumulative total since the split | ||
| Log2(PoW) | 82.189 | 81.875 |
| Blocks | 3,325 | 3,315 |
| Mining electricity spend | $7,939,318 | $6,389,264 |
| Coin price (Poloniex) | $108 | $94 |
| Estimated mining gross profit/(loss) | ($3,450,568) | ($2,494,139) |
| Gross profit margin | (76.9%) | (64.0%) |
| Assume leased hashrate | ||
| Estimated leasing costs | $14,608,345 | $11,756,245 |
| Estimated mining gross profit/(loss) | ($10,119,595) | ($7,861,120) |
(Source: BitMEX Research, Poloniex for prices)
Flaws in the Above Analysis
The above gross profit margin charts do not show a complete picture. While the revenue figures are likely to be accurate, the only cost included is electricity. Obviously miners have other costs, such as the capital investment in the machinery as well as maintenance costs and building costs. Therefore, although the charts below show that the industry is highly profitable when only considering electricity costs, given other costs, the recent price crash is likely to have sent almost all the miners into the red. This indicates that miners invested too much in equipment and have achieved large negative ROIs.
Electricity Cost is Not Uniform
Another crucial point not reflected in the above analysis is the variance in electricity rates. The charts above assume a flat cost of $0.05 cent per KwH; however, not all miners have the same electricity costs and there will be a distribution.
As we mentioned above, 31% of the hashrate was shutdown in the period, logically those with the highest electricity costs should turn off their machines first. Therefore the average electricity cost on the network should have fallen considerably in the past month.
The below chart is an illustration of the above, it assumes that electricity costs are normally distributed with a standard deviation of $0.01 per KwH and that higher-cost miners switch their machines off first. Although this assumption is likely to be highly inaccurate and energy prices will not be normally distributed across the mining industry, from a macro level it illustrates a point and it may be more accurate than the above chart.
According to this analysis, average Bitcoin mining gross margins have only declined from around 50% to 40%, implying a far more healthy situation for the remaining miners.
Bitcoin Mining Gross Profit Margin (Illustrative)

(Source: BitMEX Research, Poloniex for prices)
When evaluating the potential negative impact of price declines on Bitcoin, analysts sometimes forget that not all miners have the same costs. It is these cost variances that should ensure the network continues to function smoothly despite large sudden price declines and allows the difficulty to adjust.
What Caused the Price Crash?
There has been considerable speculation around the causes of the price crash, with some saying miners sold Bitcoin in order to finance a costly hashwar in Bitcoin Cash. The cryptocurrency intelligence monitoring platform Boltzmann flagged to us that their platform had detected unusually large miner selling of Bitcoin on 12th November, a few days before the Bitcoin Cash split.
Boltzmann detected that net Bitcoin sales from miners were “17.5 standard deviations below [the] 3-month trailing average.” On further analysis, it appears these miners may have been a member of Slushpool.
Bitcoin miner net flow & price

(Source: Boltzmann, 12 hour aggregation of miner net flow)
Conclusion and Price Commentary
While it may be true that mining pools selling Bitcoin to fund losses in the Bitcoin Cash hashwar may have been a catalyst for the reduction in the price, we think it’s easy to overestimate the impact of this. We are in a bear market and prices are falling regardless of the news or investment flows.
Furthermore, in a bear market prices seem to fall on non-news or bad news and ignore good news, while in a bull market the reverse appears true. We think it’s likely that prices would have been weak regardless of any miner selling prior to the Bitcoin Cash split. For cryptocurrency, trader sentiment is king.
This is likely to be a very tough time for the mining industry. However, for miners with lower costs, our basic analysis indicates that the situation may be better than people expect. If the miners acquired their equipment from Bitmain at below-cost prices, they could still be in the green, even when including depreciation and other administrative expenses.
