Abstract: In our sixth piece on the lightning network, we provide new data about its growth and size. We reveal statistics about private channels, often produced by mobile wallets, which are not normally included in traditional network metrics. We primarily focus on non-cooperative channel closures and a database we have constructed, which we believe contains all such transactions. Our database illustrates that non-cooperative channel closures are relatively common and that lightning network usage is higher than expected.
Main Findings:
- The number of lightning network non-cooperative channel closures in Bitcoin’s history is over 60,000.
- Over 1,000 Bitcoin has been spent in non-cooperative channel closure transactions.

(Lightning strikes the city of New York. Source: Pexels)
Overview
The lightning network has development challenges ahead and even if these are overcome, there is significant uncertainty about the network’s potential. However, in our view, the lightning network is one of the most exciting areas in the cryptocurrency space at the moment, at least from a technical perspective. Much has been written about the lightning network and this is our sixth report on the topic:
- Lightning Network (Part 1) – Motivation
- Lightning Network (Part 2) – Routing Fee Economics
- Lightning Network (Part 3) – Where Is The Justice?
- Lightning Network (Part 4) – All Adopt The Watchtower
- Lightning Network (Part 5) – BitMEX Research Launches Penalty Transaction Alert System
This report focuses on lightning network data and usage statistics.There is already some data and analysis on lightning network usage, often used to assess its growth. However, most of this data is based on figures reported by lightning network nodes which participate in the lightning P2P gossip network. For example, the TXStats.com website, a collaboration between BitMEX Research and Coinmetrics, contains historic estimates of the number of public lightning channels and the value of bitcoin inside these channels. At the end of December 2019, TXStats.com figures indicate there are 36,335 public channels containing 871 bitcoins.
Figure 1 – Screenshot from TXStats.com illustrating the growth of the lightning network over the last 2 years
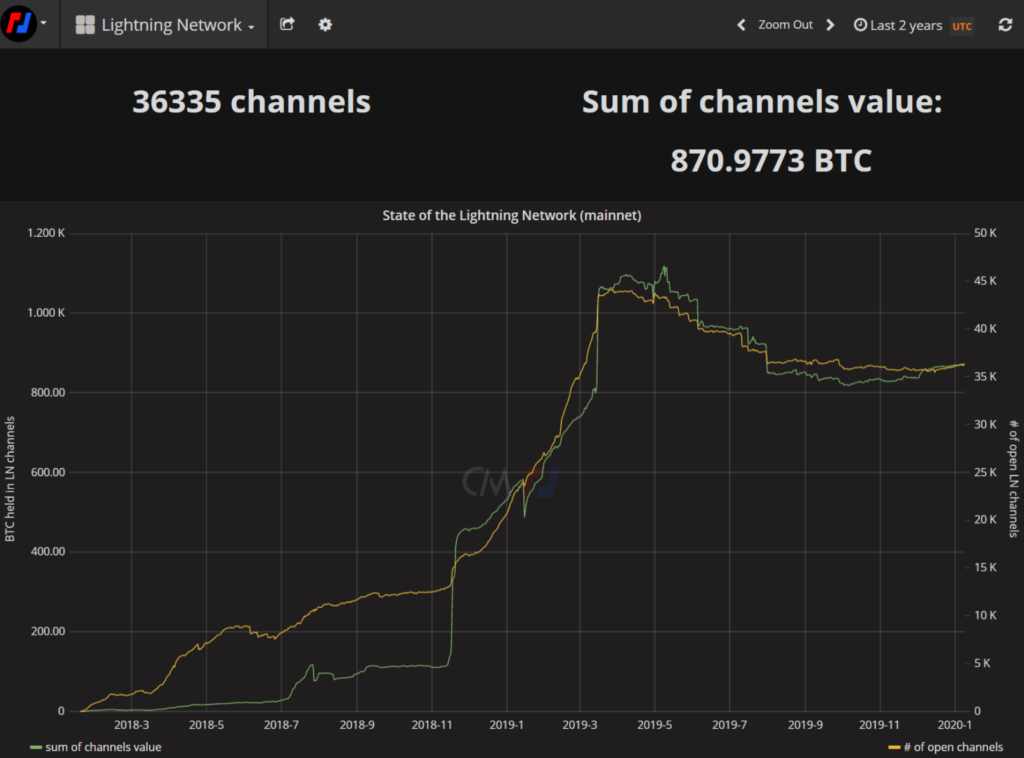
(Source: TXstats.com)
While the above analysis is useful, it only contains information about public channels. This may provide an incomplete picture of the network, as many lightning channels are non advertised, for example mobile wallets may keep their channels private. In this report we reveal new data about the lightning network, based on an evaluation of Bitcoin blockchain data and an analysis of a dataset of all lightning network non-cooperative channel closures, including private ones.
Lightning Network Transaction Database Construction Methodology
Before we reveal the findings, we want to talk a bit about how we obtained our data. As we explained in our earlier piece, there are various types of lightning network transactions which appear on-chain and can potentially be identified as such.
| Transaction type | Ability to identify based on blockchain data |
| Opening a channel | It may not be possible to reliably and directly identify this type of transaction from blockchain data alone. However, in the case of public channels, these transactions can be identified from data obtained from a lightning network node. In addition to this, the transaction may be characterised as lightning later on, when the output of the transaction is redeemed during the closure of the channel, if the closure was non-cooperative. (See below) |
| Cooperative closure | It may be too challenging to distinguish this type of transaction from non-lightning transactions. One can scan the blockchain for all spends redeemed using a 2 of 2 multi-signature script, however one cannot be certain these relate to the lightning network. |
Non-cooperative closure | Analysis is challenging and it is difficult to tell with absolute certainty if these are lightning transactions. However, it is possible to directly identify these transactions as lightning, with a reasonable degree of certainty.The transaction may be characterised as a non-cooperative closure more accurately, when the output of the transaction is redeemed during the sweeping of funds, following the channel closure. This third scenario is the subject of this report. |
In the event of a non-cooperative channel closure, the transaction can potentially be followed by three types of scenarios, two of which result in a sweep transaction, using Bitcoin’s OP_IF script. Identifying these OP_IF sweep transactions with a relatively high degree of certainty, is possible by analysing blockchain data.
Transaction type | Ability to identify based on blockchain data |
| Non-penalty sweep | These transactions can be identified reasonably reliably. |
| Penalty sweep | These transactions can also be identified reasonably reliably, but are quite rare. Penalty transactions are the subject of a previous BitMEX Research report and ForkMonitor has an alert system for this transaction type. |
| No sweep transaction | In some cases, following on from a non-cooperative closure, there is no sweep transaction. This scenario may occur for the following (non comprehensive) list of reasons:
If no sweep transaction occurs, then obviously there is nothing on-chain to analyse. |
Figure 2 below illustrates part of the methodology we used to construct our database of non-cooperative channel closure transactions. We worked backwards up the diagram, in the opposite direction to the flow of funds, to determine which transactions were non-cooperative closures and even channel opening transactions.
Figure 2 – Diagram illustrating how to reliably identify channel opening and non-cooperative closure transactions from blockchain data
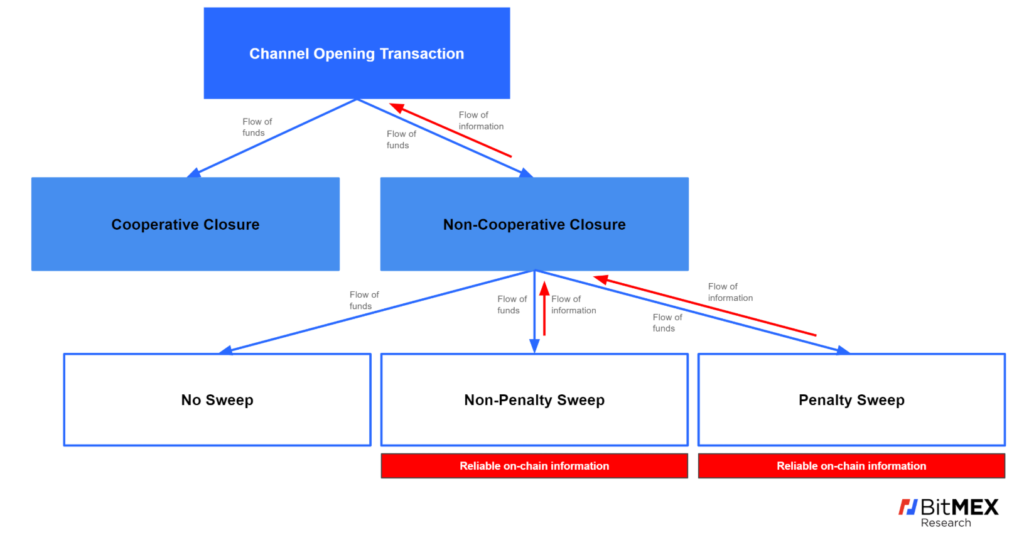
(Source: BitMEX Research)
Of course, the above methodology is not sufficient to identify all non-cooperative channel closures, since some of them may not result in a sweep transaction, as we mentioned above. Therefore we also used the less reliable method of scanning directly for the remainder of these transactions to complement our analysis.
Results & Analysis
In the below tables and charts we provide statistics about non-cooperative lightning network channel closures. The more robust methodology, using the sweep transactions, we identified 59,508 channel closure transactions spending a total of 1,074 bitcoin. This can be considered as a lower bound estimate for non-cooperative closures. In addition to this, directly searching for non-cooperative closures returned a total 90,667 results, spending 1,405 bitcoin. The more robust sweep methodology produced a set of results which are a subset of the less reliable direct search.
Non-cooperative channel closure data by identification methodology
| Identification method | Number of transactions |
Value of Bitcoin |
| Non penalty sweeps | 59,239 | 1,070 |
| Penalty sweeps |
269
|
3
|
| Lower estimate | 59,508 |
1,074 |
| Non-cooperative closures not followed by a sweep transaction (Direct search) | 31,159 |
332 |
| Upper bound estimate | 90,667 |
1,405 |
(Source: Blockchain data based on BitMEX Research blockchain analysis)
(Note: On-chain data based on figures from block 1 to 611,000)
The volume of transactions here is quite large and may indicate more experimentation with lightning than many expected. The data also indicates non-cooperative closures are more of a common closure type than people think.
Figure 3 below, shows the total number of non-cooperative channel closures in each calendar month since the start of the lightning network, based on data which includes all search methodologies. It appears to indicate that activity peaked in the first half of 2019, not too different from other network metrics, such as the number of public channels. Of particular interest is the fact that in December 2019 the non-cooperative closure rate fell back to levels not seen since the start of 2019, while the public channel count in this period has grown substantially. This could indicate the non-cooperative closure rate is declining as users become more familiar with how to use lightning and wallet technologies improve.
Figure 3 – Total number of non-cooperative lightning channel closures per month (Upper bound)
(Source: Blockchain data based on BitMEX Research blockchain analysis, Public channel data based on a lightning network node – txstats.com)
(Note: On-chain data based on figures from block 1 to block 611,000)
Figure 4 below illustrates the the value of bitcoin spent in non-cooperative channel closure transactions over time. Again, it shows a gradual pick up in the number of transactions, with the steepest slope in around April 2019.
Figure 4 – Total value of bitcoin spent in non-cooperative lightning channel closures per month (Upper bound)
(Source: Blockchain data based on BitMEX Research blockchain analysis, Public channel data based on a lightning network node – txstats.com)
(Note: On-chain data based on figures from block 1 to block 611,000)
Figures 5 only shows data for non-cooperative channel closures identified by the more robust sweep transaction methodology.
Figure 5 – Non-cooperative lightning channel closures per month (Lower bound)
(Source: Blockchain data based on BitMEX Research blockchain analysis)
(Note: On-chain data based on figures from block 1 to 611,000)
Figure 6 below shows only non-cooperative closures identified only by the less reliable direct search, where funds have not been swept using the OP_IF script. The numbers here appear more volatile over time. There is no recent pickup in these transactions as we approach the current date, this may indicate that waiting for the lock-time to expire may not be a significant driver of transactions in this category. A possible cause of these transactions could be when a user initiates a non-cooperative closure on a channel with inbound capacity only, perhaps an unwanted or unused channel.
Figure 6 – Total value of bitcoin spent in non-cooperative lightning channel closures per month (Funds not swept)
(Source: Blockchain data based on BitMEX Research blockchain analysis)
(Note: On-chain data based on figures from block 1 to 611,000)
Bitcoin Fee Market Conditions
In Figure 7, the chart illustrates the number of non-cooperative channel closures per day and compares it to the Bitcoin feerate. The chart does not appear to indicate that channel closures have been caused by spikes in the on-chain feerate, something some have expressed concerns about. This may be a risk for the lightning network going forwards.
Figure 7 – Daily number of non-cooperative lightning network channel closures vs Bitcoin feerate
(Source: Blockchain data based on BitMEX Research blockchain analysis, Feerate data from txstats.com)
(Note: On-chain data based on figures from block 1 to block 611,000)
Prevalence Of Penalty Transactions
As a reminder, there are two economic scenarios which follow on from a non-cooperative closure, one with a breach (when the closing party broadcasts an old state in attempt to steal funds) and a non-breach closure. The data on non-cooperative closures in this report includes both scenarios. In the event of a breach, the channel closure can be followed by a penalty transaction, if the attempted theft is detected and the honest party claims all the funds. Our analysis shows that these penalty transactions are very rare. Only 0.30% of non-cooperative closures result in a penalty transaction or 0.22% by value.
|
Value of transaction inputs | |
| Non-cooperative closures (Upper bound) |
|
1,405.2 BTC |
| Penalty transactions |
|
|
| Percentage |
|
|
(Source: BitMEX Research blockchain analysis)
(Note: On-chain data based on figures from block 1 to block 611,000)
The Direct Search For Non-Cooperative Closures
As we mentioned above, in addition to the sweep methodology we also attempted a less reliable method of directly searching for non-cooperative closures, to find the closures where the funds were not swept using the OP_IF script. Our imperfect and somewhat amateurish assessment methodology; was based on the following:
- The transaction input redemption is a pay to witness script hash (P2WSH) 2 of 2 multi-signature script
- The transaction has one input
- The locktime field
- The nsequence field
- An empty script_sig
We searched every single transaction in Bitcoin’s history and applied the above filter. To repeat again, our methodology is not perfect, it may include transactions which are not genuine lightning channel closures. On the other hand, we think it is unlikely that many non-lightning transactions match the above criteria, as 2 of 2 P2WSH multi-signature transactions are reasonably rare. Therefore our estimates may be reasonably accurate.
The following factors can be said to support the accuracy of our database:
- The methodology correctly identified almost 60,000 transactions already identified as non-cooperative closures by the more accurate sweep system.
- Our analysis correctly identified every single one of the 350 non-cooperative closures, where our own lightning nodes were a counterparty in the transaction.
- There were no false positives from our own sample of 750 cooperative channel closures conducted by our own nodes. Therefore the methodology does not incorrectly identify cooperative closures as non-cooperative.
- Our transaction assessment methodology did not identify any non-cooperative closure transactions prior to the launch of the lightning network in December 2017, however, this may be because these transactions segregate the witness, something which did not occur prior to August 2017.
Data Integrity
In a further attempt to gain confidence over the data, we counted the number of transactions in buckets allocated by the input value. Figure 8 displays this data, for non-cooperative channel closures identified by the more robust and less robust system. For both sets of data, the chart shows a small spike in the 0.16 to 0.17 bitcoin range. This range includes the value of a cap on the size of most types of lightning channels, of 0.167 (Or one sixth of a Bitcoin). This spike in the 0.16 to 0.17 range and the shape in the below chart could potentially indicate our dataset is accurately finding lightning transactions, both using the reliable and less reliable methodology.
Figure 8 – Proportion of non-cooperative lightning network channel closure transactions grouped by input value (Bitcoin)
(Source: Blockchain data based on BitMEX Research blockchain analysis)
(Note: On-chain data based on figures from block 1 to block 611,000. Buckets are less than the top of the range and greater than or equal to the bottom of the range. The final bucket is greater or equal to 0.5 bitcoin)
The relative size of the spike in the 0.16 to 0.17 range is much higher for the more robust methodology, as one may expect. There is a significant risk that we may have erroneously included transactions in our database; which have nothing to do with the lightning network. Statistically speaking, the lower spike (in relative terms) in the 0.16 to 0.17 bitcoin range for the direct search route, is potential evidence of false positives. On the other hand, it is possible there are other reasons for this.
Conclusion
The number of non-cooperative channel closures is higher than we would have guessed, over 60,000 compared to our expectations of finding around 30,000 such transactions, which is also what several lightning developers suggested to us. The findings may indicate that experimentation with mobile lightning wallets (which often produce private channels) may be more common than many expected. The data may also indicate that non-cooperative closure types are more common relative to the cooperative closure type, than the community thought.
Our analysis does provide some insight into the limitations of the privacy benefits of lightning. Although privacy is greatly enhanced by lightning compared to on-chain transactions, it is likely blockchain monitoring services and block explorers may identify and publish non-cooperative closures and penalty transactions, much like we have done. The fact that non-cooperative closures are more common than many thought, means the privacy and scalability benefits of lightning are lower than many expected too. However, Bitcoin protocol upgrades and lightning protocol upgrades could make this type of analysis more difficult in the future. At the same time, as users learn more about how to use the lightning network and lightning wallets improve, the prevalence of non-cooperative closures could fall. Figures 3 and 4 are evidence this is already occurring, to some extent.
If one assumes that cooperative closures are twice as common as non-cooperative closures, which was the case for our own nodes and seems a conservative assumption, then one can conservatively estimate that almost 4,000 Bitcoin is the gross flow into the lightning network since inception. This excludes funds still inside private lightning channels and is likely to be an underestimate.
| Description |
|
Non-cooperative channel closures (lower bound) |
|
| Cooperative channel closures – Assuming 2x the non-cooperative figure (Our nodes are 2.14x) |
|
| Currently in public channels |
|
| Total estimated gross cumulative flow into lightning |
|
This is a higher figure than we would have guessed. However, despite the significant gross flows into lightning and the higher than expected usage, we do not think it is the case that any significant flow is driven by necessity or real commerce. As of now, lightning is still for hobbyists and technologists.