Gemini: Don’t Bet On An ETF

Volatility like many traders is on holiday. Traders in search of something to get the market moving again have attached great interest to the imminent launch of Gemini. Gemini is the US Bitcoin exchange to be launched by the Winklevoss twins within “weeks”. The thinking goes that once Gemini is launched the ETF can’t be far away. A pre-emptive rally will occur on the expectation that the ETF will finally bring mainstream American investors into Bitcoin. While I agree an US listed ETF will be a major positive, the launch of Gemini will not accelerate the SEC’s yay or nay decision.
One of the issues with the ETF, is how will the fund manager acquire Bitcoin. The SEC wants to be certain that Bitcoin obtained for the fund will not have come from nefarious sources. The only way for that to happen is that Bitcoin is purchased on a fully compliant US exchange. Gemini plans to be a fully compliant exchange only open to Americans. The other major concern is liquidity.
Let’s assume Gemini launches with a full blessing of the relevant band of regulatory mafiosos, the exchange will be at a significant disadvantage in the liquidity department. Coinbase, who is compliant in a patchwork of states, has an average daily volume (ADV) since launch of 7,456 XBT. itBit, who has a trust license and can operate in all 50 states, has an ADV since launch of 3,656 XBT. The total US market ADV approximately is 11,112 XBT per day. Bitfinex, who has a global user base, for the last six months had an ADV of 33,646 XBT or 3x of the combined Coinbase and itBit market. Gemini will be competing head to head with Coinbase and itBit. The market will further fragment, and if they are successful at current volatility and trading patterns, they can hope for 3,000 XBT to 5,000 XBT of ADV.
5,000 XBT ADV is barely over $1 million at the current exchange rate. If the goal is to present a liquid exchange to the SEC, Gemini in the short and medium term will fail at this mark. The better alternative would be for the Winklevoss twins to focus on being an asset manager and partner with Coinbase and itBit. I would much rather earn points on the package passively, than further cannibalise the US regulated Bitcoin exchange market. Another strategy would be to warm the SEC up to allowing OTC trading as the means of trading the fund’s Bitcoin. Dealing with a few reputable dealers accomplishes all the same things as an exchange, without all the hassle.
If your investment thesis was that Gemini will lead to an announcement of imminent ETF approval in the next three to six months, go back to the drawing board. Gemini might be a step forward in the approval process, but don’t expect the SEC to speed up its glacial approval process. And furthermore 2016 elections are right around the corner, the current head might not want to make waves before its time to kiss the ring of America’s next emperor.
Bitcoin Volatility Phases
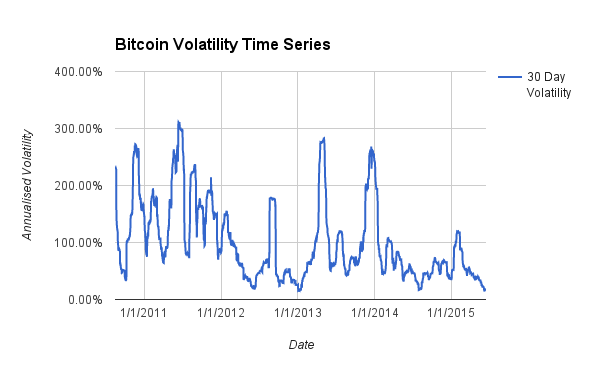
The current volatility drought while painful has happened before in Bitcoin’s six year history. I decided to investigate the periodicity of Bitcoin 30 day realised volatility since Mt. Gox opened its doors in 2010. I assembled a data set that combined Mt. Gox (until 31 December 2013) and Bitfinex XBT/USD daily prices. The above chart is a time series plot of the 30 day realised volatility.
| Quintile | 30 Day Volatility |
| 20th | 44.66% |
| 40th | 62.74% |
| 60th | 93.86% |
| 80th | 161.47% |
| 100th | 311.40% |
I then calculated the volatility quintiles. The table above lists those values. A “low” volatility phase is anything below 45% 30 day realised volatility. Looking at the volatility time series, distinctive volatility phases emerge. Low volatility persists for an uninterrupted period time, and then the price action normalises, and the daily gyrations traders have come to know and love in Bitcoin return.
| State Date | End Date | Start Volatility | End Volatility | Length Days | Start Price | End Price | Period Price Return |
| 4/17/2012 | 6/22/2012 | 35.92% | 44.40% | 66 | $4.98 | $6.55 | 31.59% |
| 9/18/2012 | 2/2/2013 | 44.39% | 45.89% | 137 | $12.25 | $19.63 | 60.24% |
| 5/14/2014 | 9/28/2014 | 42.94% | 45.66% | 137 | $443.81 | $391.18 | -11.86% |
| 4/8/2015 | 6/13/2015 | 43.36% | 15.31% | 66 | $249.38 | $229.70 | -7.89% |
Including the current period, there have been three other instances of prolonged sub-45% volatility periods. The table above lists the relevant statistics. Except for the Fall 2012 to Winter 2013 period, the other two periods began in the middle of spring (remember the data is backwards looking, when volatility reaches 45% the decline in price action started 30 days prior). The end of the low volatility phase occurred in the summer. It is difficult to draw patterns from only 4 period samples, but I predict price action won’t begin to pick up until mid to late August. Traders are beginning to take summer holidays, and trading activity will wane while their tan’s wax.
The price direction is anyone’s guess. There is a 50/50 split between price increases and decreases during the low volatility phase. The trend is your friend until it ain’t. The down trend has yet to be broken; until a volatility upward phase shift, it will remain very difficult to break the bears.
Trade Recommendation:
Sellers of volatility can profit handsomely in this environment. Traders should sell daily and weekly volatility by going short BVOL24H and BVOL7D respectively. The short durations of these contracts limit the upside risk when volatility phase shifts upwards again.
Weekly Review: Bitcoin Investment Products
| Week Ending | GBTC Avg Volume | WoW % Change | Avg % Premium | XBT Avg Volume | WoW % Change | Avg % Premium |
| 6/5/2014 | 113 XBT | 31.20% | 388 XBT | 1.13% | ||
| 6/12/2015 | 131 XBT | 15.82% | 26.70% | 766 XBT | 97.60% | 0.57% |
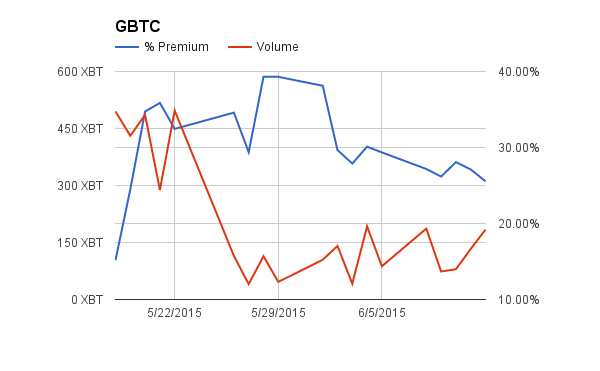
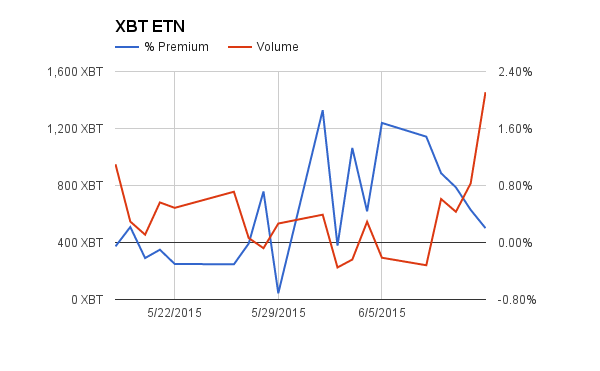
Volume was up across the board last week. XBT ETN continues to build on its volume lead over GBTC. Investors appreciate the low premium and constant presence of a market maker who can keep the premium and discount low. The GBTC premium which was near 100% last month continues to fall. If the downtrend continues, more holders of BIT will convert into GBTC shares and the premium will decline further.
XBT Spot
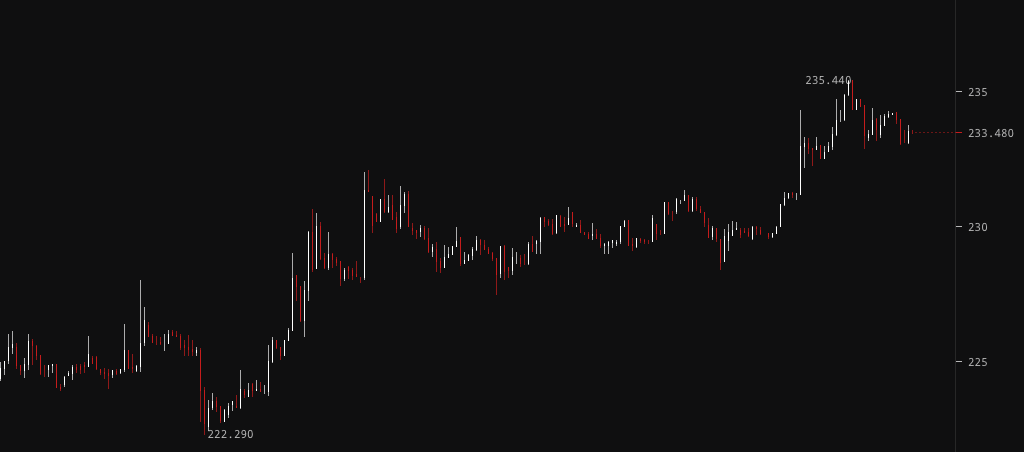
$220 was breached on the downside for a moment, and since then the price rallied $15. A holding pattern has set in above $230. Another push above $235, and the bulls will attempt a break above $240. The range bound chop is frustrating many traders, and the smarter ones have decided to sit on their hands until a definitive trend is established.
The Grexit melodrama is being largely ignored by the market. The raging debate over the block size has not caused an observable impact either. A new unknown catalyst is needed to jolt the market from its slumber. I don’t know in what form it will take, but until then a few merry band of traders will ping pong the price between technical levels up and down.
Trade Recommendation:
If the price holds above $235, buy XBTM15 with an upside target of $240. If the price falls back below $230, sell XBTM15 with a downside target of $220.