BitMEX launched the world’s first Bitcoin historical volatility futures contract called BVOLG15. The contract settles at the BitMEX 30 Day Historical Volatility Index (.BVOL Index) price. This post will serve as a postmortem describing the trading behavior of the first contract, and hopefully further educate traders as to how they can incorporate BitMEX volatility futures contracts into their portfolios.
.BVOL Index measures the annualised standard deviation of the % move between Time Weighted Average Price (TWAP) calculations done on Bitfinex every day from 10:00 GMT to 12:00 GMT. Because .BVOL Index comprises 30 days of price changes, there must be a total of 31 price increments. For BVOLG15, that meant the observation period lasted from 27 January 2015 to 27 February 2015 inclusive.
BVOLG15 was listed on 5 January 2015, meaning for three weeks traders were placing bets purely on their expectations of future realised volatility. Each day after 27 January 2015, a clearer picture was formed as to where 30 day volatility would realise by expiry.
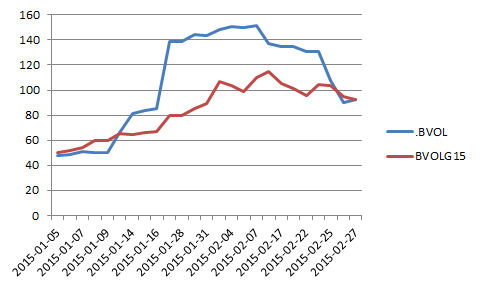
The above graph shows a comparison of .BVOL Index and BVOLG15. BVOLG15 performed as expected. If there are N days until expiry, BVOLG15’s price is composed of N days of realised volatility expectations and (30 – N) days of realised volatility. Even as .BVOL spiked above 150% realised volatility, BVOLG15 did not rise to the same degree because the market did not expect that level of volatility to persist in the future. This is also evident in the volatility of volatility for both .BVOL Index and BVOLG15. The annualised volatility of .BVOL Index and BVOLG15 was 260% and 140% respectively.
Traders who believe they can accurately forecast realised volatility should utilise BVOL futures contracts. Intra-month they discount future realised volatility effectively. Traders need not hold until expiry, but can effectively move in and out of positions as expectations of future realised volatility changes.
This is a link to an Excel spreadsheet showing the .BVOL and BVOLG15 data that was used in the calculations and graph presented in this post.