Abstract: We evaluate the impact the block reward halving, which is due to take place in a few weeks’ time, may have on the Bitcoin mining industry. Assuming a constant Bitcoin price and excluding the impact of transaction fees, mining industry revenue should fall by around 50%. However, this is not necessarily the case for the network hashrate. The decline in the network hashrate is determined not only by the decline in block rewards, but also the interrelationship between the difficulty adjustment mechanism and the mining industry structure. Based on the current industry structure and assuming the Bitcoin price does not change, we predict that the halvening might cause the network hashrate to decline by around 30% to 35%.

Overview
The third Bitcoin block halving, when the block reward will fall from 12.5 bitcoin to 6.25 bitcoin, is just a few weeks away. Many have asked us what the impact of this would be, both on the Bitcoin price and the Bitcoin mining industry. In this report we will focus on the second of these questions, the impact on the mining industry. Excluding the impact of transaction fees, the impact on the miners should be almost exactly the same as a sudden 50% drop in the Bitcoin price.
One may think that a sudden 50% fall in the price of Bitcoin means the mining industry should fall in size by 50%. This is true with respect to industry revenue, after the halving, all else being equal, mining industry revenue should fall by around 50%. This is therefore likley to be a very challenging time for the industry. However, this does not mean that the number of miners or the hashrate will fall by 50%, the situation is complicated by the matter of the difficulty adjustment. In order to assess the impact of the halvening on the hashrate, one needs to consider both the difficulty adjustment and the structure of the mining industry. It is these interrelated dynamics which are the subject of this report.
We have already written extensively about mining incentives in the past and this piece is our fourth report on the subject.
- Mining Incentives (Part1): The Economics of the Difficulty Adjustment
- Mining Incentives (Part 2): Why is China dominant in Bitcoin mining?
- Mining Incentives (Part 3): Short term vs. long term
Mining incentives
In general, in the short term, businesses should continue to operate if their revenue is higher than the total marginal production costs. i.e. revenue is higher than the costs which vary depending on production volumes. Businesses may not be profitable in these scenarios, but as long as the company is making a contribution to its fixed costs, it is rational to keep the business open.
In the case of Bitcoin mining, marginal costs are those which vary depending on the number of Bitcoin mined, such as electricity. Fixed costs are those which remain the same, regardless of production volumes, such as rent or historic capital expenditure on mining equipment. If the price of Bitcoin falls, in theory a mine should remain open if its revenues are greater than marginal costs (electricity). From the point of view of the decision to switch off equipment, it doesn’t matter how much the equipment originally cost or if the operation is loss-making, these are sunk costs, what matters are the marginal costs. It is with this theory in mind that we analyse Bitcoin mining industry cost curves.
The mining cost curve
Due to the significance of the marginal production costs in commodity mining industries, understanding the shape of the cost curve for the entire industry is important in assessing market dynamics and how supply will shift depending on changes in price. For example, in the case of gold, one can evaluate the impact of a decline in the gold price on the industry supply. All one needs to do is draw a new horizontal line across the cost curve chart and the high cost supply on the right hand side of the chart, with costs above the new lower gold price line, will eventually be eliminated from the market. This is illustrated by the red line in Figure 1 below.
Figure 1 – Gold mining industry cost curve
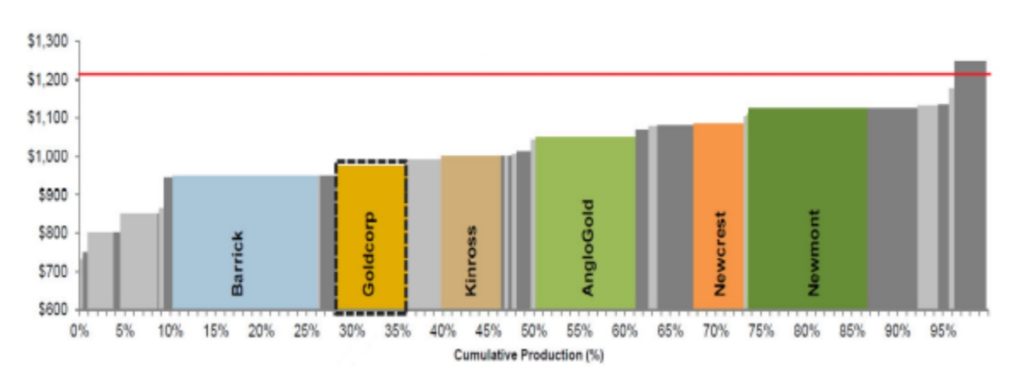
Of course, in the case of Bitcoin supply does not change as the price changes, but the hashrate does change. Due to the difficulty adjustment, with Bitcoin, estimating the impact of price changes on the hashrate it is not as simple as drawing a new horizontal line. As we explained in our first piece on mining incentives, as miners exit the industry the difficulty adjusts downwards, impacting the shape of the cost curve. Therefore when evaluating the impact of a change in the Bitcoin price, one does not need to simply draw a new horizontal line on the chart, one also needs to draw a new cost curve.
In the three charts below we have evaluated the impact on the network hashrate from a sudden 50% decline in the Bitcoin price (the halvening). In each scenario, we draw both a new horizontal line representing the Bitcoin price and a new cost curve.
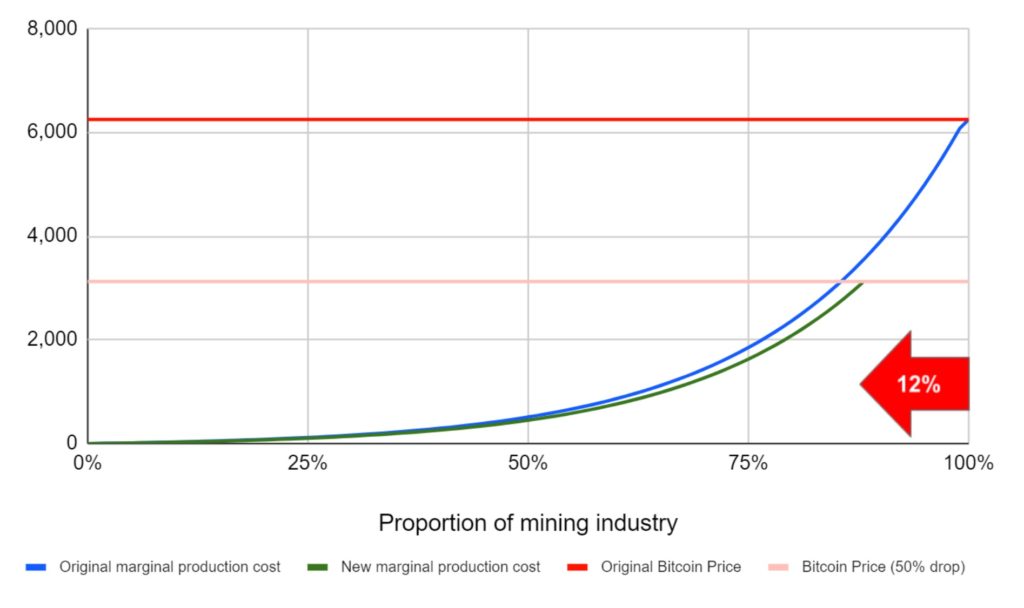
The examples below illustrate why the shape of the cost curve is particularly important in the Bitcoin mining industry and can have dramatic impacts on the hashrate. In our first case, the linear cost curve, the halvening would cause the network hashrate to decline by about 29%. In our second scenario, which is another potentially realistically shaped cost curve, the halvening has a much larger impact on the network hashrate, causing a 47% decline. Our third scenario, the halvening only caused a 12% drop in the network hashrate.
Figure 2 – Bitcoin mining cost curve – Scenario 1: Linear cost curve (US$)
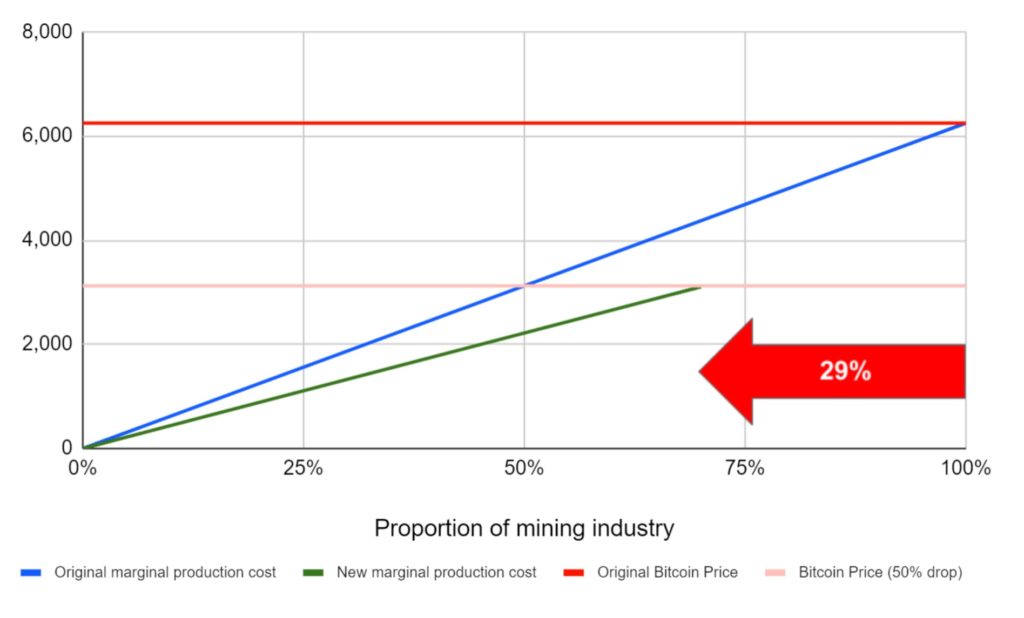
Figure 3 – Bitcoin mining cost curve – Scenario 2: “Normal” cost curve (US$)
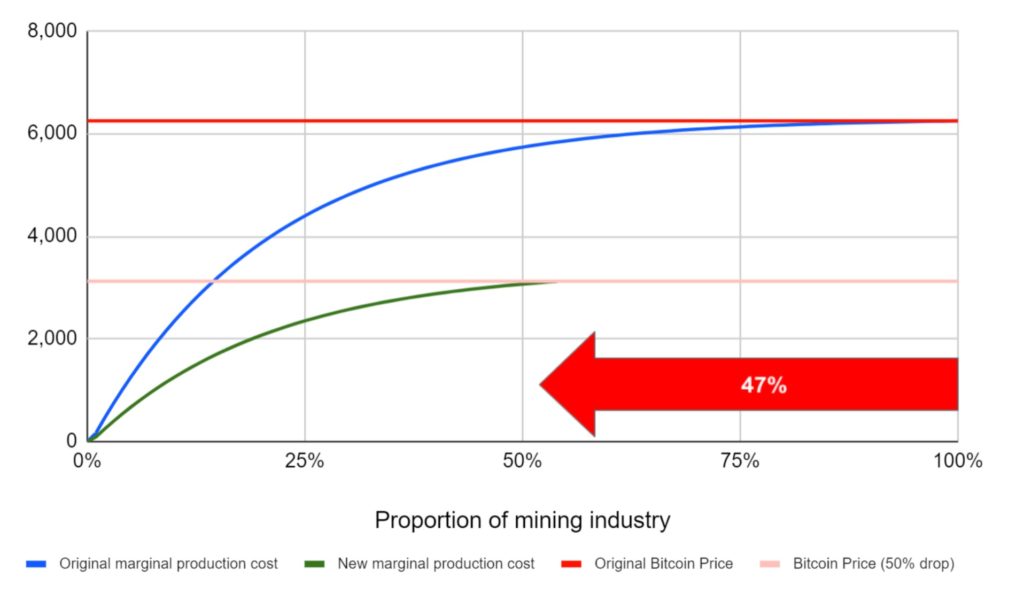
Figure 4 – Bitcoin mining cost curve – Scenario 3: Quadratic cost curve (US$)
There is another scenario to consider not illustrated by the above charts, homogeneous costs across the sector. Of course if one assumes all miners have the same marginal costs, then when the price of Bitcoin falls 50%, all miners could simultaneously switch off and the network would completely halt. Fortunately such an industry structure is unlikely to emerge and even if that does happen, it is possible that ideological miners could push the network forwards to the next difficulty adjustment.
Mathematics of the new equilibrium cost curve
The new cost curve is obtained by multiplying the original cost curve by a constant value i.e. taking the old curve and applying a constant percentage reduction to it. This value is calculated by solving for a common unknown across two equations in an iterative trial and error process. There is the percentage reduction of the original cost curve and the percentage hashrate reduction the new curve implies, when loss making miners, whose costs are above the new lower Bitcoin price are removed. Starting at a 50% reduction, we iteratively ran the numbers until both these percentages matched, thereby revealing the new theoretical equilibrium difficulty reduction.
What does the actual current Bitcoin mining cost curve look like?
Above we explained how the impact of the halvening on the network hashrate depends on the shape of the cost curve. Therefore one may be interested in determining what the current shape of the cost curve is. This is a difficult metric to determine, most of the Bitcoin miners are private companies who do not disclose their cost structures. There are four notable exceptions to this: Hut 8, Hive, Bitfarms and Argo Blockchain, however these companies only represent a small proportion of the network.
One of the mining equipment brokers, Blockware Solutions, recently published a report on the mining industry, which includes data about the electricity cost structure, by breaking the industry down into eight cost layers. It is difficult to assess the accuracy of the data, however we analysed the figures and produced the following cost curve. As the chart below shows the best fit line (in red) is reasonably linear, similar to scenario 1 in our charts above.
Figure 5 – Scatter Chart – Electricity costs US$ per kWh vs Proportion of the miners
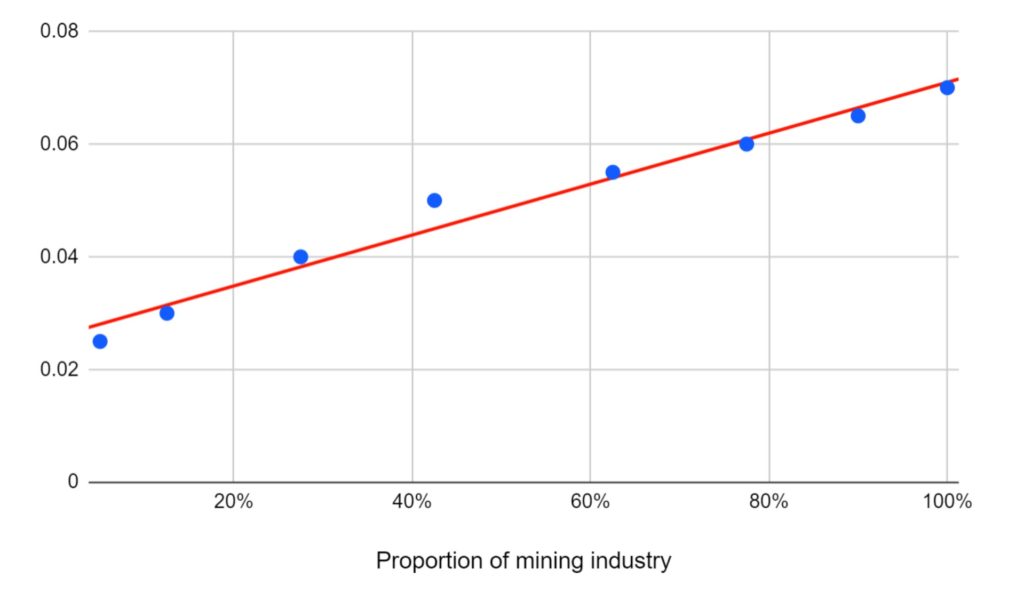
(Source: BitMEX Research, Data from Blockware Solutions)
(Note: The Blockware Solutions data is $0.025 and below for the cheapest layer and $0.07 and above for the most expensive layer)
When we questioned the CEO of Blockware, Mr Matt D’Souza about the integrity of the data, he said the following:
We have clients or are partnered with miners or mining service providers in a majority of mining countries and we have visited major mining facilities in China and the US. We also run a mining pool and communicate with other large pools. Everyone has a different cost structure and that is why our report breaks it down into layers. We have clients in every cost layer, from those paying zero cent per kWh to those paying 7 cent per kWh. Therefore we believe the data in our report is reliable.
Source: Blockware Solutions CEO Mr Matt D’Souza
The above chart does not show the distribution of US$ costs to produce one unit of Bitcoin like a traditional cost curve, instead it shows the electricity cost distribution. This can be used to illustrate the shape of the curve, if one converted the y-axis to represent US$ per Bitcoin produced. However, since the difficulty is changing all the time, perhaps using energy costs is more appropriate.
Figure 5 above only considers electricity costs and ignores the impact of variances in the efficiency levels of the mining hardware used. This data is also provided in the Blockware report, where they breakdown the network between Bitmain’s S9 and the newer more efficient S17 machine. Again this data may not be reliable and is based on several oversimplifications, however we have used it to construct a more detailed cost curve below. Figure 6 below is a scatter chart illustrating the distribution of mining efficiency in terms of the US$ it costs to produce 1 tera hash hour.
Figure 6 – Scatter Chart – Mining Efficiency Curve – US$ per THh vs Proportion of the miners
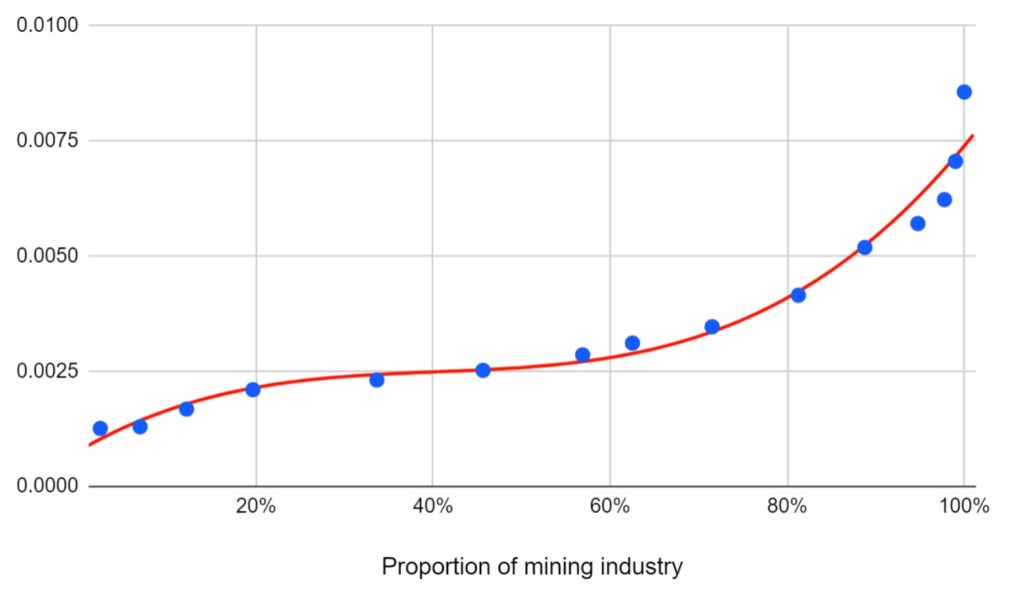
(Source: BitMEX Research, Data from Blockware Solutions)
(Note: For the $0.025 kWH and below layer we have assumed a value of $0.0125kWH and for the $0.07 kWH and above layer we have assumed a value of $0.08125 kWH)
The “S” shaped cost curve
Most more mature mining industries, in the resources space, tend to have “S” shaped cost curves, as the following charts illustrate (Figures 7 & 8 below, as well as Figure 1 above). Typically there are a small number of unique low cost assets on the left hand side benefiting from exceptionally favourable geology and a large bulk of “normal” miners in the middle. There are also typically a small number of higher cost more marginal struggling miners on the right hand side of the cost curve, which are often more speculative projects commissioned during a price bubble.
Figure 7 – Thermal coal cost curve
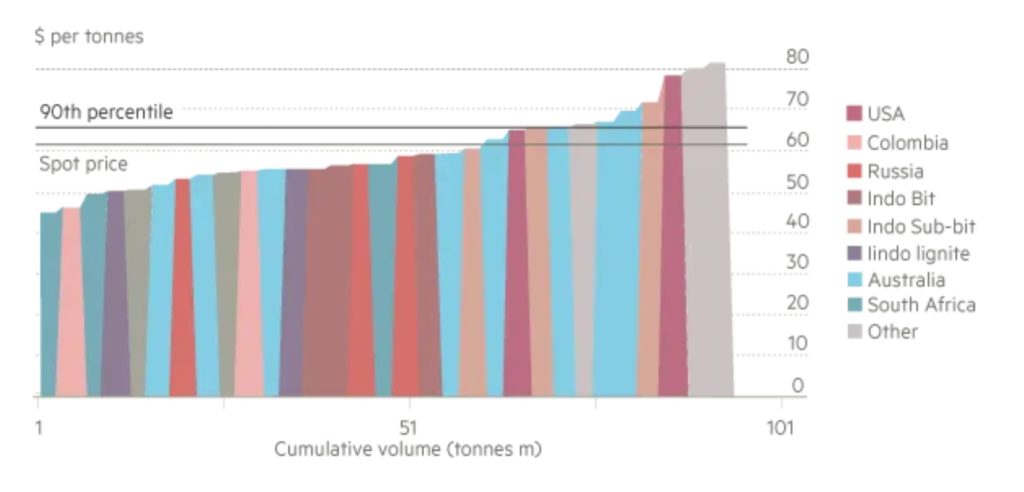
(Source: Financial Times, Macquarie)
Figure 8 – Cobalt cost curve
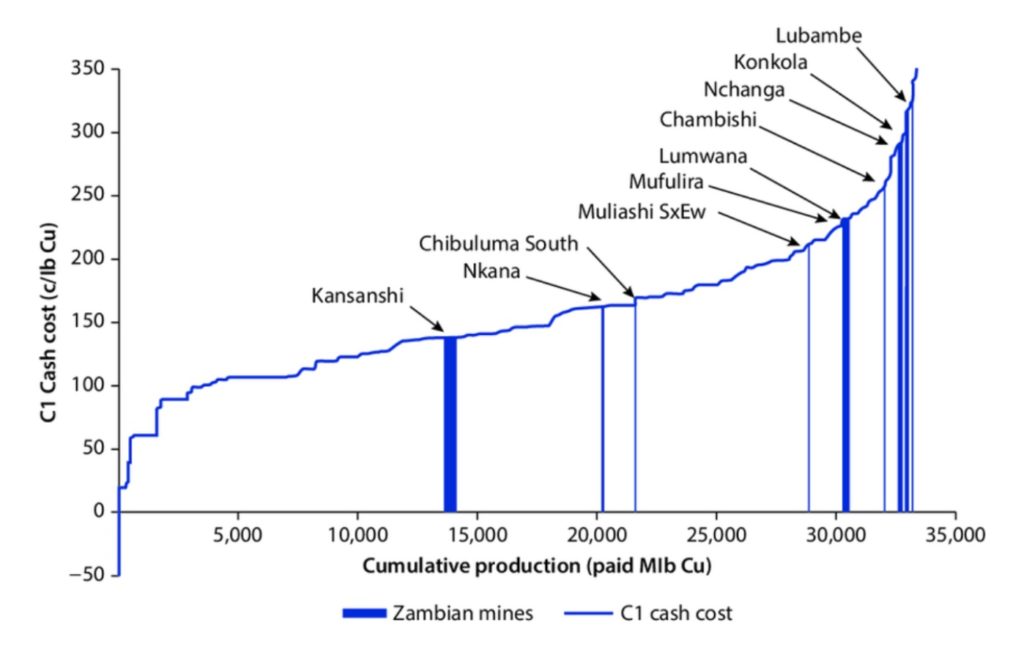
(Source: Research Gate)
Figure 6 above already indicates this “S” shaped pattern. It is possible that the same economic factors that cause this “S” shape in the resources space could apply to Bitcoin mining. However, the number of data points is limited and it’s difficult to draw any strong conclusions.
As for what this “S” shape means for Bitcoin, it could imply that for small changes in the price the hashrate adjusts like our third scenario, but for larger price declines (like a halving) the hashrate behaves more like Scenario 2 projects.
Applying the cost curve data to the halvening
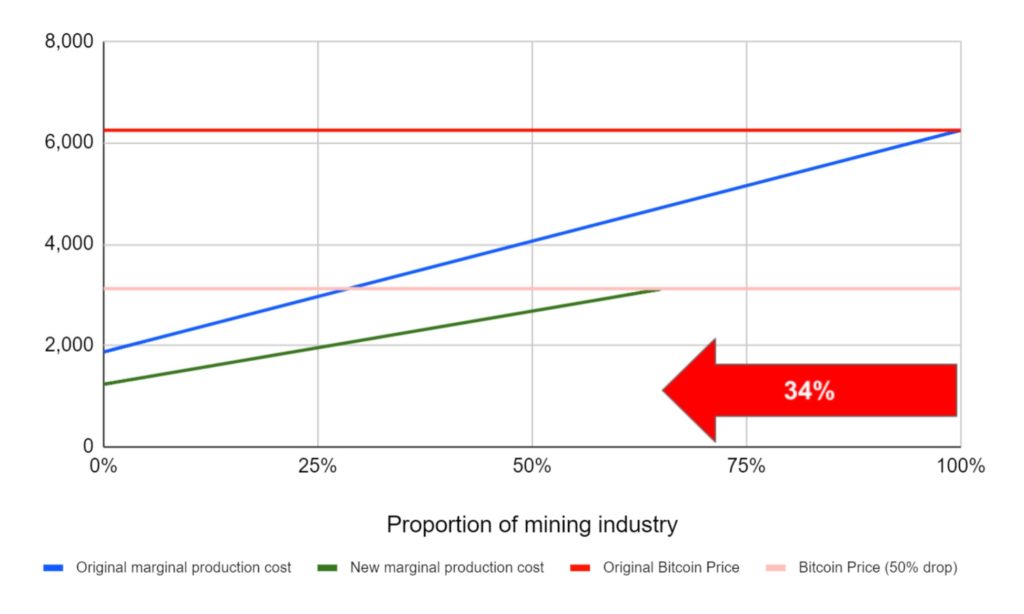
Although the industry has already achieved the “S” curve shape, for simplicity we have decided to use a linear model as an approximation to assess the impact of the halvening. It should be noted that our model linear scenario (Figure 2) assumes that the lowest cost is exactly zero, while the linear best fit line for the Blockware Solutions data does not imply this. We therefore created a new scenario (Scenario 4), where the lowest cost bucket is 30% of the highest cost bucket, reasonably inline with the Blockware Solutions data. This results in an implied equilibrium hashrate reduction of 34%, as Figure 9 below shows.
Figure 9 – Bitcoin mining cost curve – Scenario 4: Based on industry data (US$)
Conclusion
Information about Bitcoin mining industry revenue is obviously extremely transparent, however the cost structure is somewhat opaque. If Bitcoin succeeds, in the long term, it is likely that the mining industry grows and discloses more information to the public. It is therefore likely that analysts could conduct extensive research and analysis on the cost curve and make reasonably accurate predictions about the impact of Bitcoin price changes or halvenings on the network hashrate. Therefore, due to the limited information currently available, this report is somewhat speculative in nature. However, based on the analysis in this report, we are prepared to estimate that, when the halvening occurs, the network hashrate may decline by around 30% to 35%.
Our estimate above has many assumptions. We assume that the Bitcoin price doesn’t change, that all miners are rational and that a significant proportion of miners are not already operating at a loss. With the price volatility that is sure to follow the halvening it may not even be possible to tell if our methodology and calculations were correct. However, we believe that we have introduced a useful framework to evaluate the mining industry and the halving.
In response to the question of how the halving will impact the mining industry, in our view, it will cause significant stress. On the other hand, given the actions governments have taken all around the world in order to mitigate the impact of COVID-19, many other industries will also going though a challenging period at the same time.