One of BitMEX’s claims to fame is the ability for clients to use 100x leverage while trading the Bitcoin / USD price. We often get asked to what extent traders use the maximum leverage offered. I asked our data science team to pull up historical data on leverage usage for the XBTUSD perpetual swap from May 2018 to April 2019.
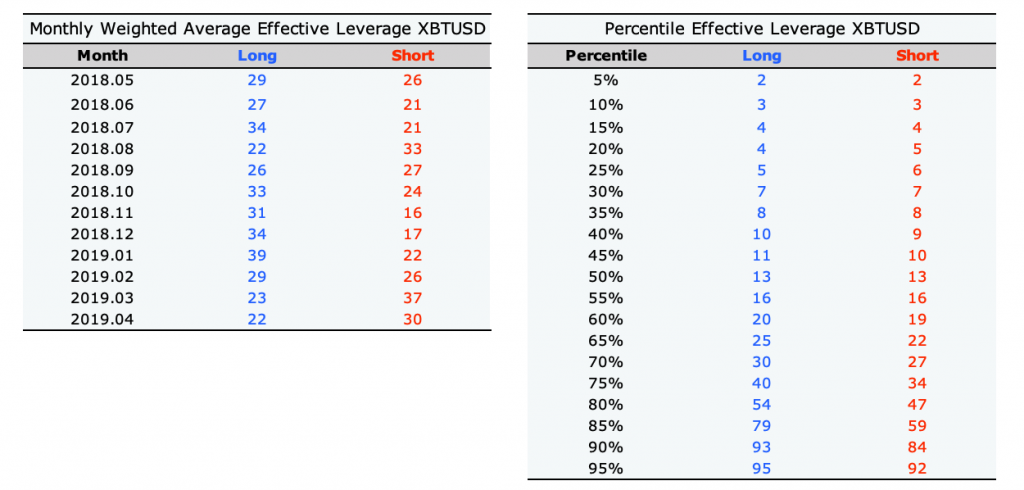
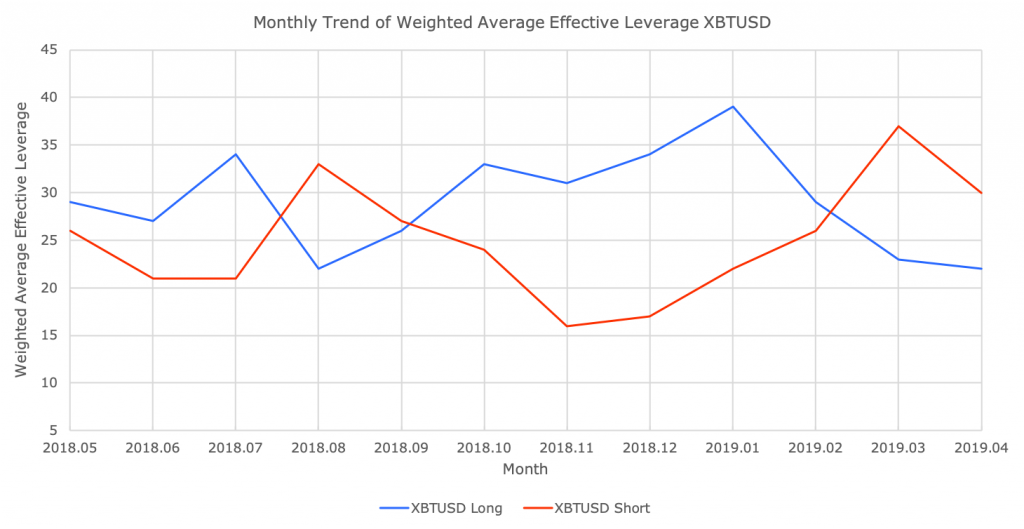
The first chart and table combo shows the weighted effective leverage at month end for XBTUSD longs and shorts.
It appears traders are quite “responsible” in that they do not on average use the maximum amount of leverage.
Definitions
aggregation grouped by month, side, and symbol

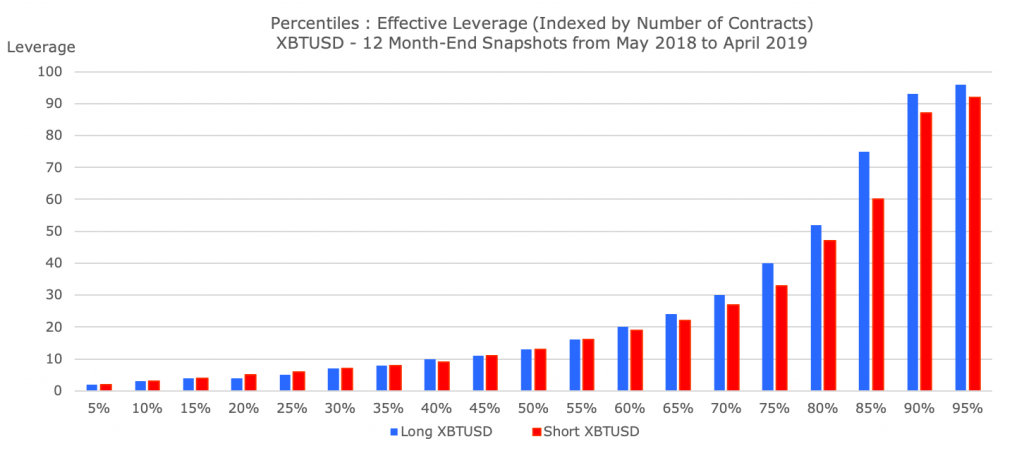
Methodology for Calculating Percentiles
- Pick the last available timestamp for each of the prior 12 months (i.e. ‘month-end snapshot’), and calculate the effective leverage for every position across all accounts rounded to the nearest integer
- Create a sorted list from the resulting values, flattened by expanding each position’s resulting effective leverage by the number of contracts held (e.g. if an effective leverage of 3 was used by an account with a position quantity of 4, it’s a contribution to the list is
'3 3 3 3') - Any given percentile of this list can be found by taking the value at the index given by:
(Count of the list) * (Desired percentile)
Using the mean is crude because traders who hold large positions must use less leverage than smaller traders. This is due to the risk limit feature of BitMEX. Traders may use 100x leverage up to a position size of 200 XBT. After that, the initial and maintenance margin requirements step up 0.5% per 50 XBT.
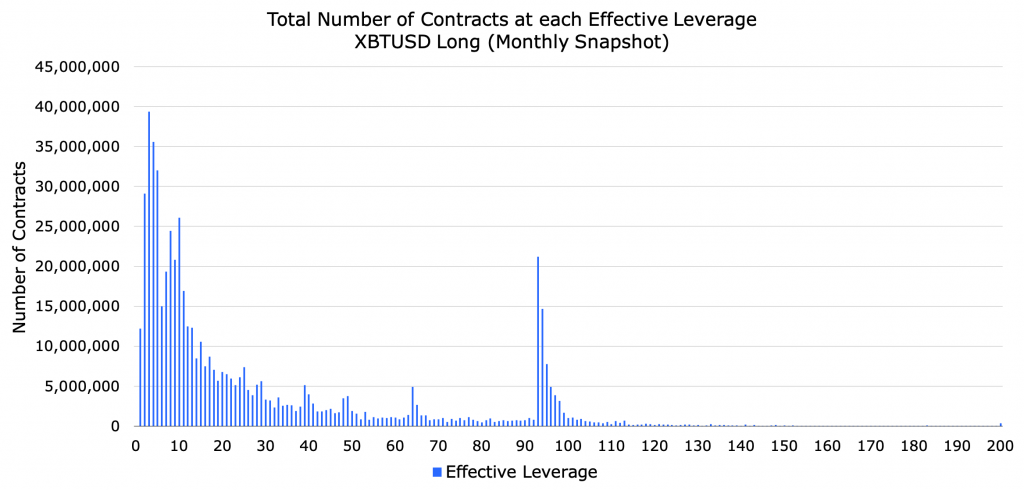
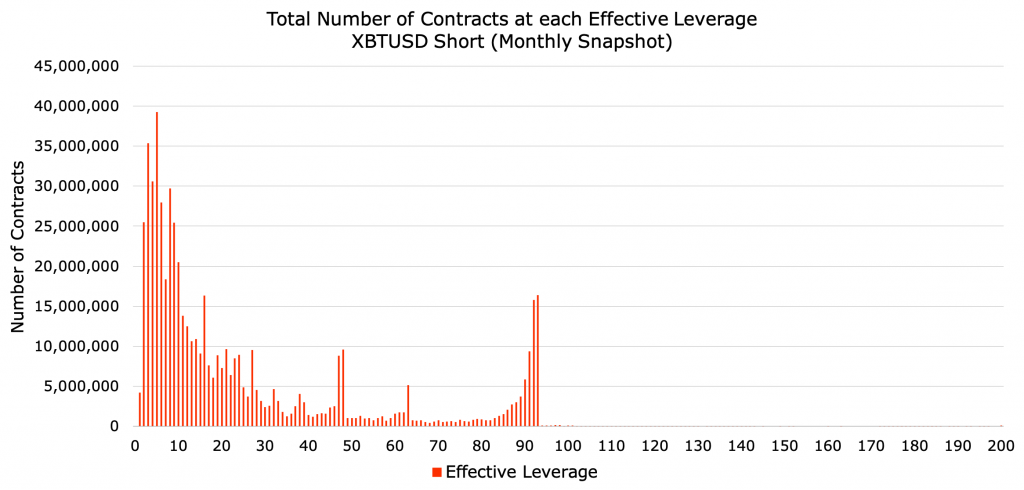
To understand the distribution of leverage respective to the number of contracts, we looked at a histogram of XBTUSD long and shorts averaged over the 12 month-end snapshots from May 2018 to April 2019. The above two charts display this data. As we expected, the largest traders use the least amount of leverage.
While the maximum leverage allowable for opening a position in XBTUSD is 100x, the effective leverage can then increase to 200x (i.e. the reciprocal of the 0.50% maintenance margin requirement), at which point liquidation occurs.
Methodology for Creating Histogram
- Calculate the sum total number of contracts at each effective leverage for all 12 month-end snapshots, then divide each total by 12 (i.e. average month-end snapshot)
I hope this data allows traders to better understand the BitMEX market microstructure. I will continue to periodically post backward looking statistics in the near future.