When trading cryptocurrencies, it’s crucial to understand some key concepts that help analyse market trends. Two important terms you’ll often hear are volume and open interest. These metrics, while primarily used in futures markets, provide valuable insights into trading activities and market sentiment.
Let’s break it down.
What is Volume?
Volume refers to the total number of units (like coins or tokens) traded during a specific time period. When you look at a daily chart, you’ll see volume represented as vertical bars at the bottom of the chart. Each bar shows how many units were traded on that particular day.
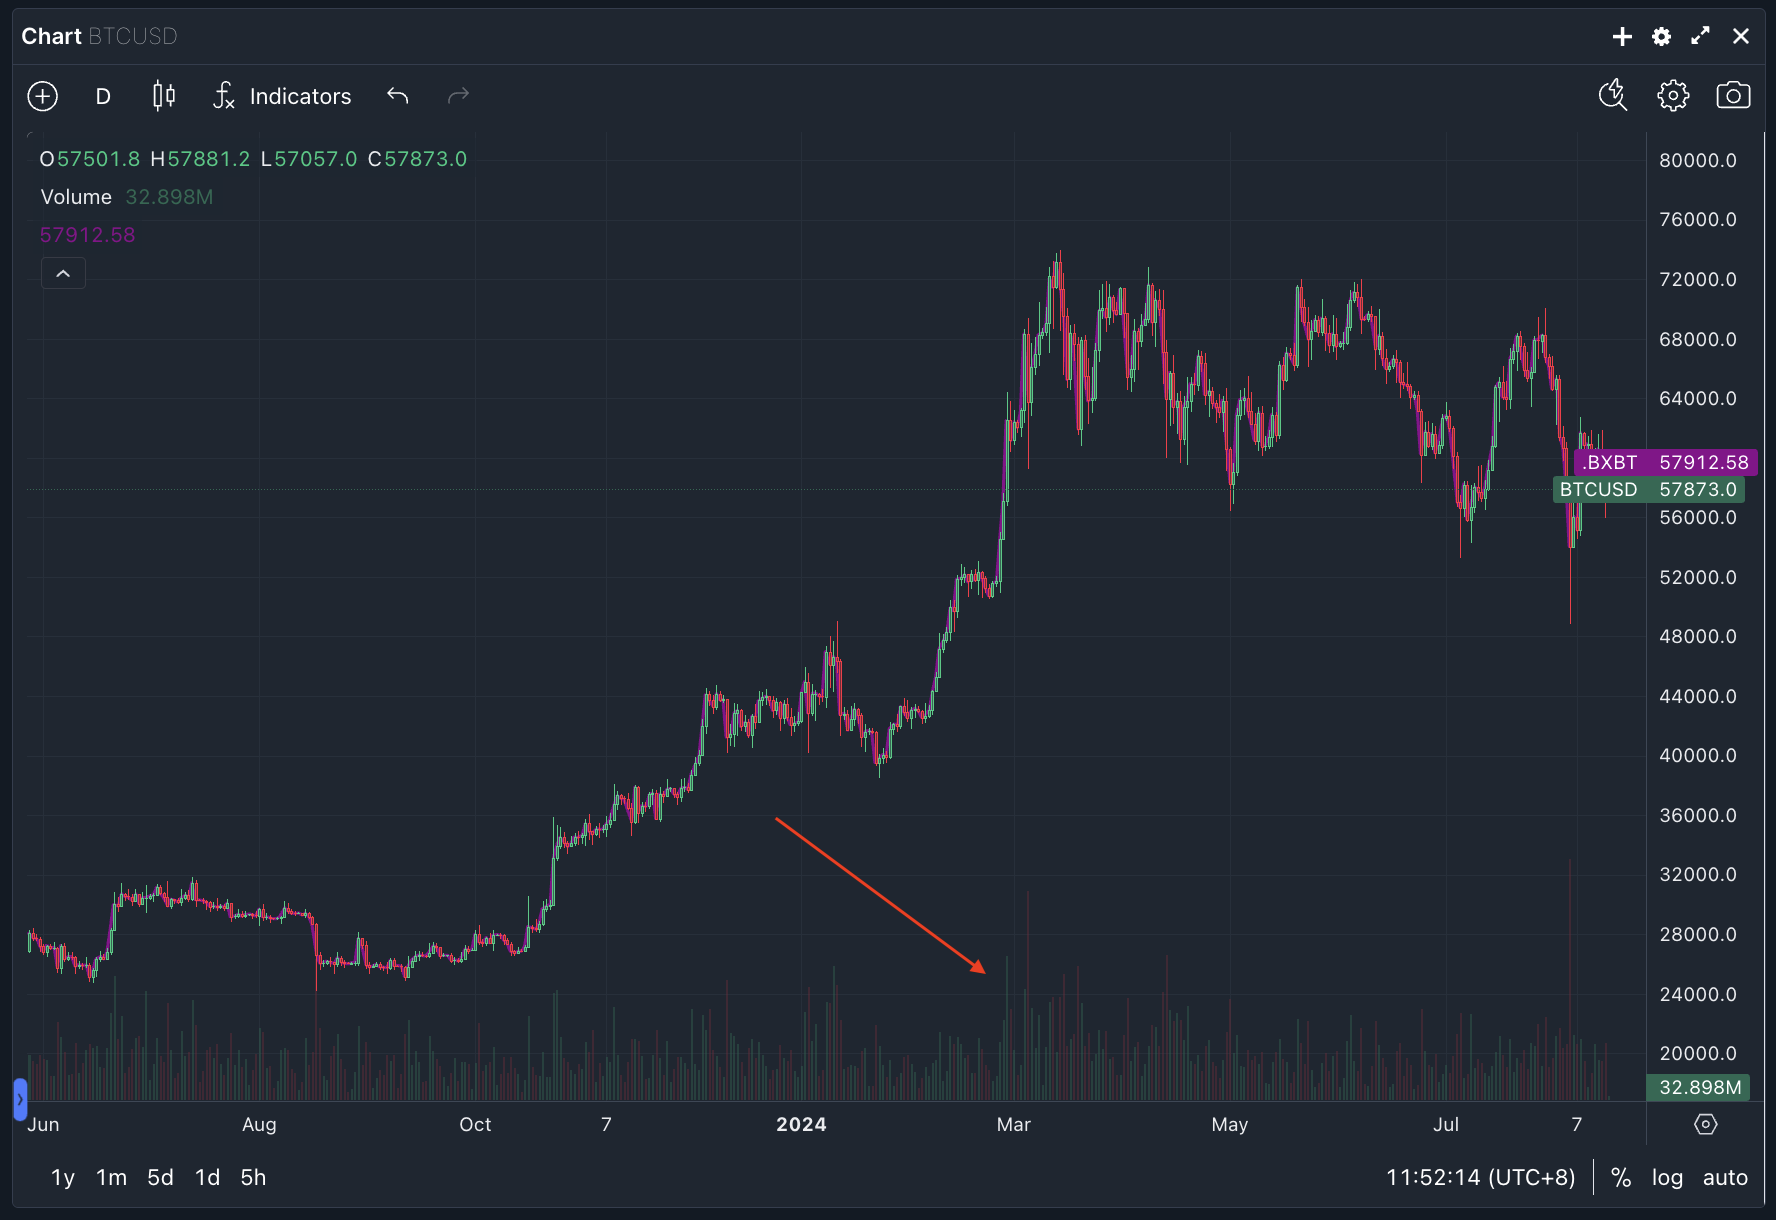
- Daily Volume: The total number of units traded in one day. This is the most common way to look at volume.
- Weekly Volume: If you look at a weekly chart, the volume bar represents the total trades for the entire week.
Volume is essential because it shows the level of activity and interest in a particular cryptocurrency. Higher volume indicates more trading activity, which can signal stronger interest or momentum.
What is Open Interest?
Open interest is a term used in futures markets to describe the total number of outstanding (open) contracts that have not been settled. Each contract involves a buyer and a seller.
- Daily Open Interest: This is plotted as a line above the volume bars on a chart and shows the total number of outstanding contracts at the end of each day.
Open interest helps traders understand the flow of money into or out of the market. Increasing open interest means more new contracts are being created, indicating new money entering the market, while decreasing open interest suggests contracts are being closed, implying money is leaving the market.
How Changes in Open Interest Take Place
Understanding how open interest changes is key to interpreting market trends. Here’s a simple breakdown:
- New Long and New Short: Both the buyer and the seller are opening new positions, increasing open interest.
- New Long and Old Long: The buyer opens a new position, while the seller closes an old one. Open interest remains unchanged.
- Old Short and New Short: The seller opens a new position, while the buyer closes an old one. Open interest remains unchanged.
- Old Short and Old Long: Both the buyer and the seller close their positions, decreasing open interest.
By looking at the net change in open interest at the end of the day, traders can gauge whether new money is entering the market or if existing money is leaving, which helps predict market trends.
General Rules for Interpreting Volume and Open Interest
Some key rules to keep in mind to help interpret volume and open interest:
- Increasing Volume and Open Interest: Indicates a strong continuation of the current price trend (whether up or down).
- Decreasing Volume and Open Interest: Suggests that the current price trend might be weakening or nearing an end.
Interpreting Volume Across All Markets
Volume measures the intensity behind a price move. Here’s how to interpret volume in different scenarios:
- In an Uptrend: Volume should increase as prices rise and decrease on price dips. This pattern confirms the uptrend.
- In a Downtrend: Volume should increase as prices fall and decrease on price bounces. This pattern confirms the downtrend.
If volume diverges from the price trend (e.g., prices rise on declining volume), it may indicate weakening buying or selling pressure, signaling a potential reversal.
Volume as a Confirming Indicator
Volume can confirm price movements and patterns. For example…
- Head and Shoulders Top: If the price forms a head and shoulders pattern with declining volume on rises and increasing volume on declines, it confirms the pattern.
- Double and Triple Tops: Successive peaks with lighter volume followed by heavier downside activity confirm these patterns.
- Triangular Patterns: Gradual drop-off in volume during formation, with a volume spike at the breakout point, confirms the pattern.
Volume Precedes Price
Traders believe that volume changes often precede price changes. This means that a loss of volume in an uptrend or downtrend can signal an upcoming reversal before the price actually changes direction.
By keeping an eye on volume and open interest, traders can get a better understanding of market dynamics and make more informed trading decisions. Remember, these tools are most effective when used together with other indicators and analysis methods.
Theoreticals aside, if you wish to begin trading crypto derivatives or spot on BitMEX, you can find all our existing products here. For more educational resources on trading, visit this page.
To be the first to know about our new listings, product launches, giveaways and more, we invite you to join one of our online communities and connect with other traders. For the absolute latest, you can also follow us on Twitter, or read our blog and site announcements.