Abstract: We note that the distribution of nonce values in the Bitcoin block header does not appear to be random, with unexplained gaps emerging, where nonces occur less often. We then speculate on why this may be the case and provide charts illustrating the phenomenon. Although in our view the explanation for this is likely to be benign, it remains a mystery.

Overview and Recent Tweets
The Bitcoin nonce forms part of the block header, which is used by miners to provide entropy as part of the Proof of Work process, to try and find a hash meeting the difficulty requirement. Although it may depend on how mining software and hardware is configured, in theory the distribution of the nonce values should be random. In 2009, when Satoshi is presumed to have been a significant miner, the nonce value followed a particular pattern, as we discussed in an earlier piece.
On 4th January 2019, @100trillionUSD tweeted a graphic illustrating the nonce value distribution for Bitcoin. It seemed to show that the nonce value was random from mid 2010 to the start of 2016, after which point four mysterious regions appeared, where nonces occurred less often.
The weird #bitcoin nonce pattern is still there at block 556995 …
I would expect nonces to be totally random, like block 100000-400000. But ever since block 400000 there are 4 areas with less nonces. Of course before block 100000 it was Satoshi playing around. pic.twitter.com/XsIRhDXXAq— PlanB (@100trillionUSD) January 4, 2019
A few days later, on 7th January 2019, @khannib noted that Monero also appeared to have an unusual nonce value distribution. The Monero hardfork, which may have prevented the usage of ASICs, appears to have made the distribution random again, perhaps indicating ASICs cause the pattern.
Interesting patterns emerge when looking at $XMR nonces. Red overlay is mining difficulty.
Can you spot the ASICs?
H/T @100trillionUSD who did the same for BTC pic.twitter.com/s23WrdTIY0
— Antoine Le Calvez (@khannib) January 7, 2019
On 23rd January 2019, TokenAnalyst dug further into the Bitcoin nonce value distribution pattern, by colouring the nonce values for the relevant mining pools.
Time of each block vs nonce. Values coloured by top-10 most active mining pools (by number of blocks mined since Jan 2016). Dashed-blue vertical lines are block rewards halving. Red line is log difficulty. As you can see – mining is now dominated by a few large pools. pic.twitter.com/wvgtdJmaHA
— TokenAnalyst (@thetokenanalyst) January 23, 2019
A further tweet from TokenAnalyst implies that Antpool is a major cause of the unexpected nonce value distribution, while Bitfury and Slushpool have nonce values which perhaps do not significantly contribute to the “white spaces”.
New Nonce Value Distribution Scatter Charts
We have replicated the above analysis, producing similar scatter charts (starting in 2018); in an attempt to shed more light onto the issue.
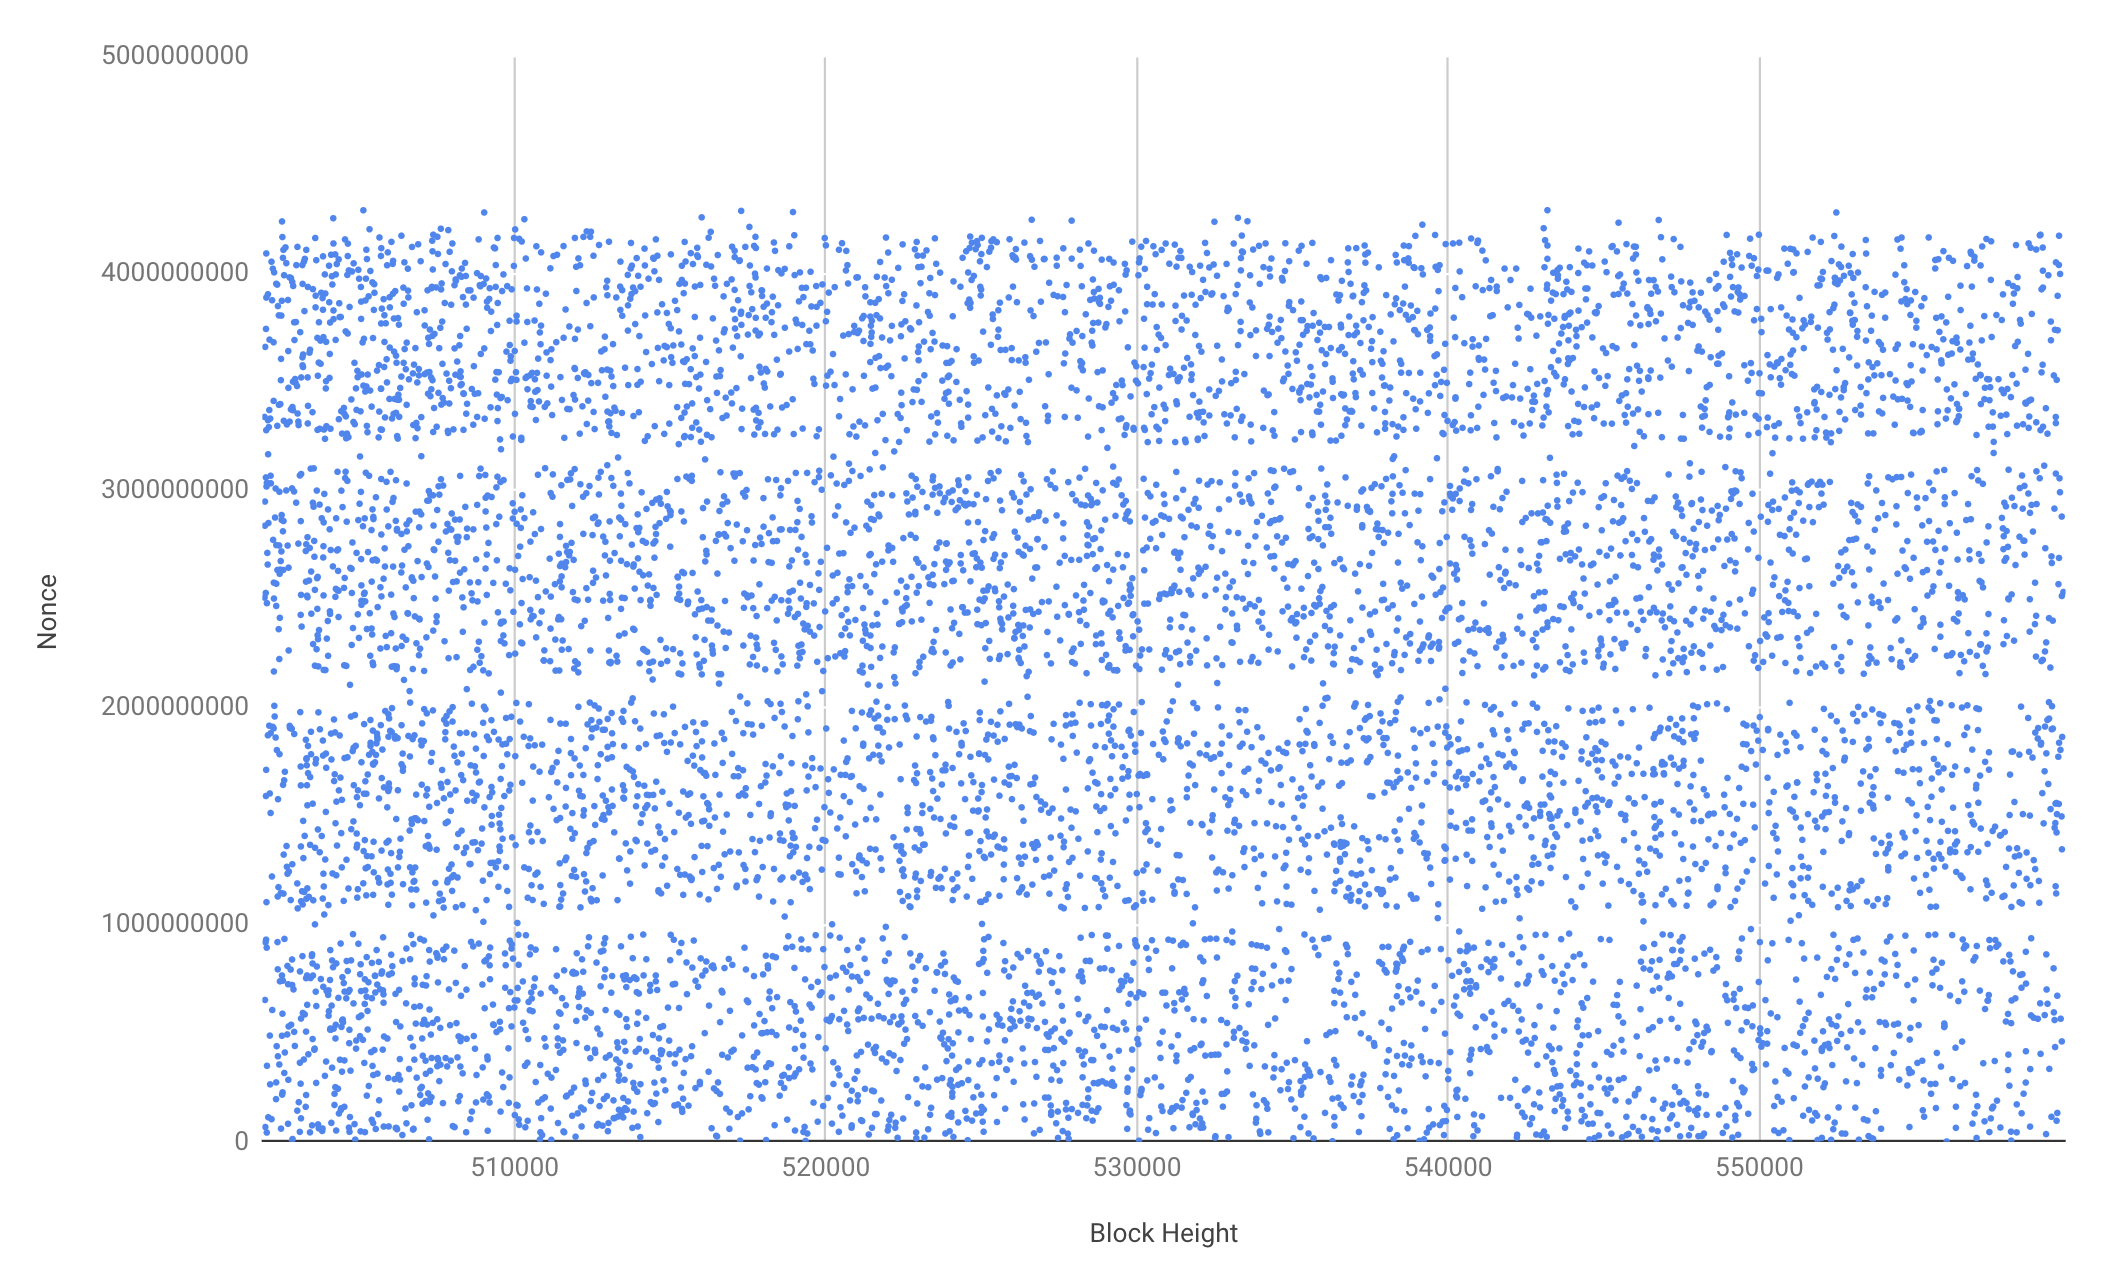
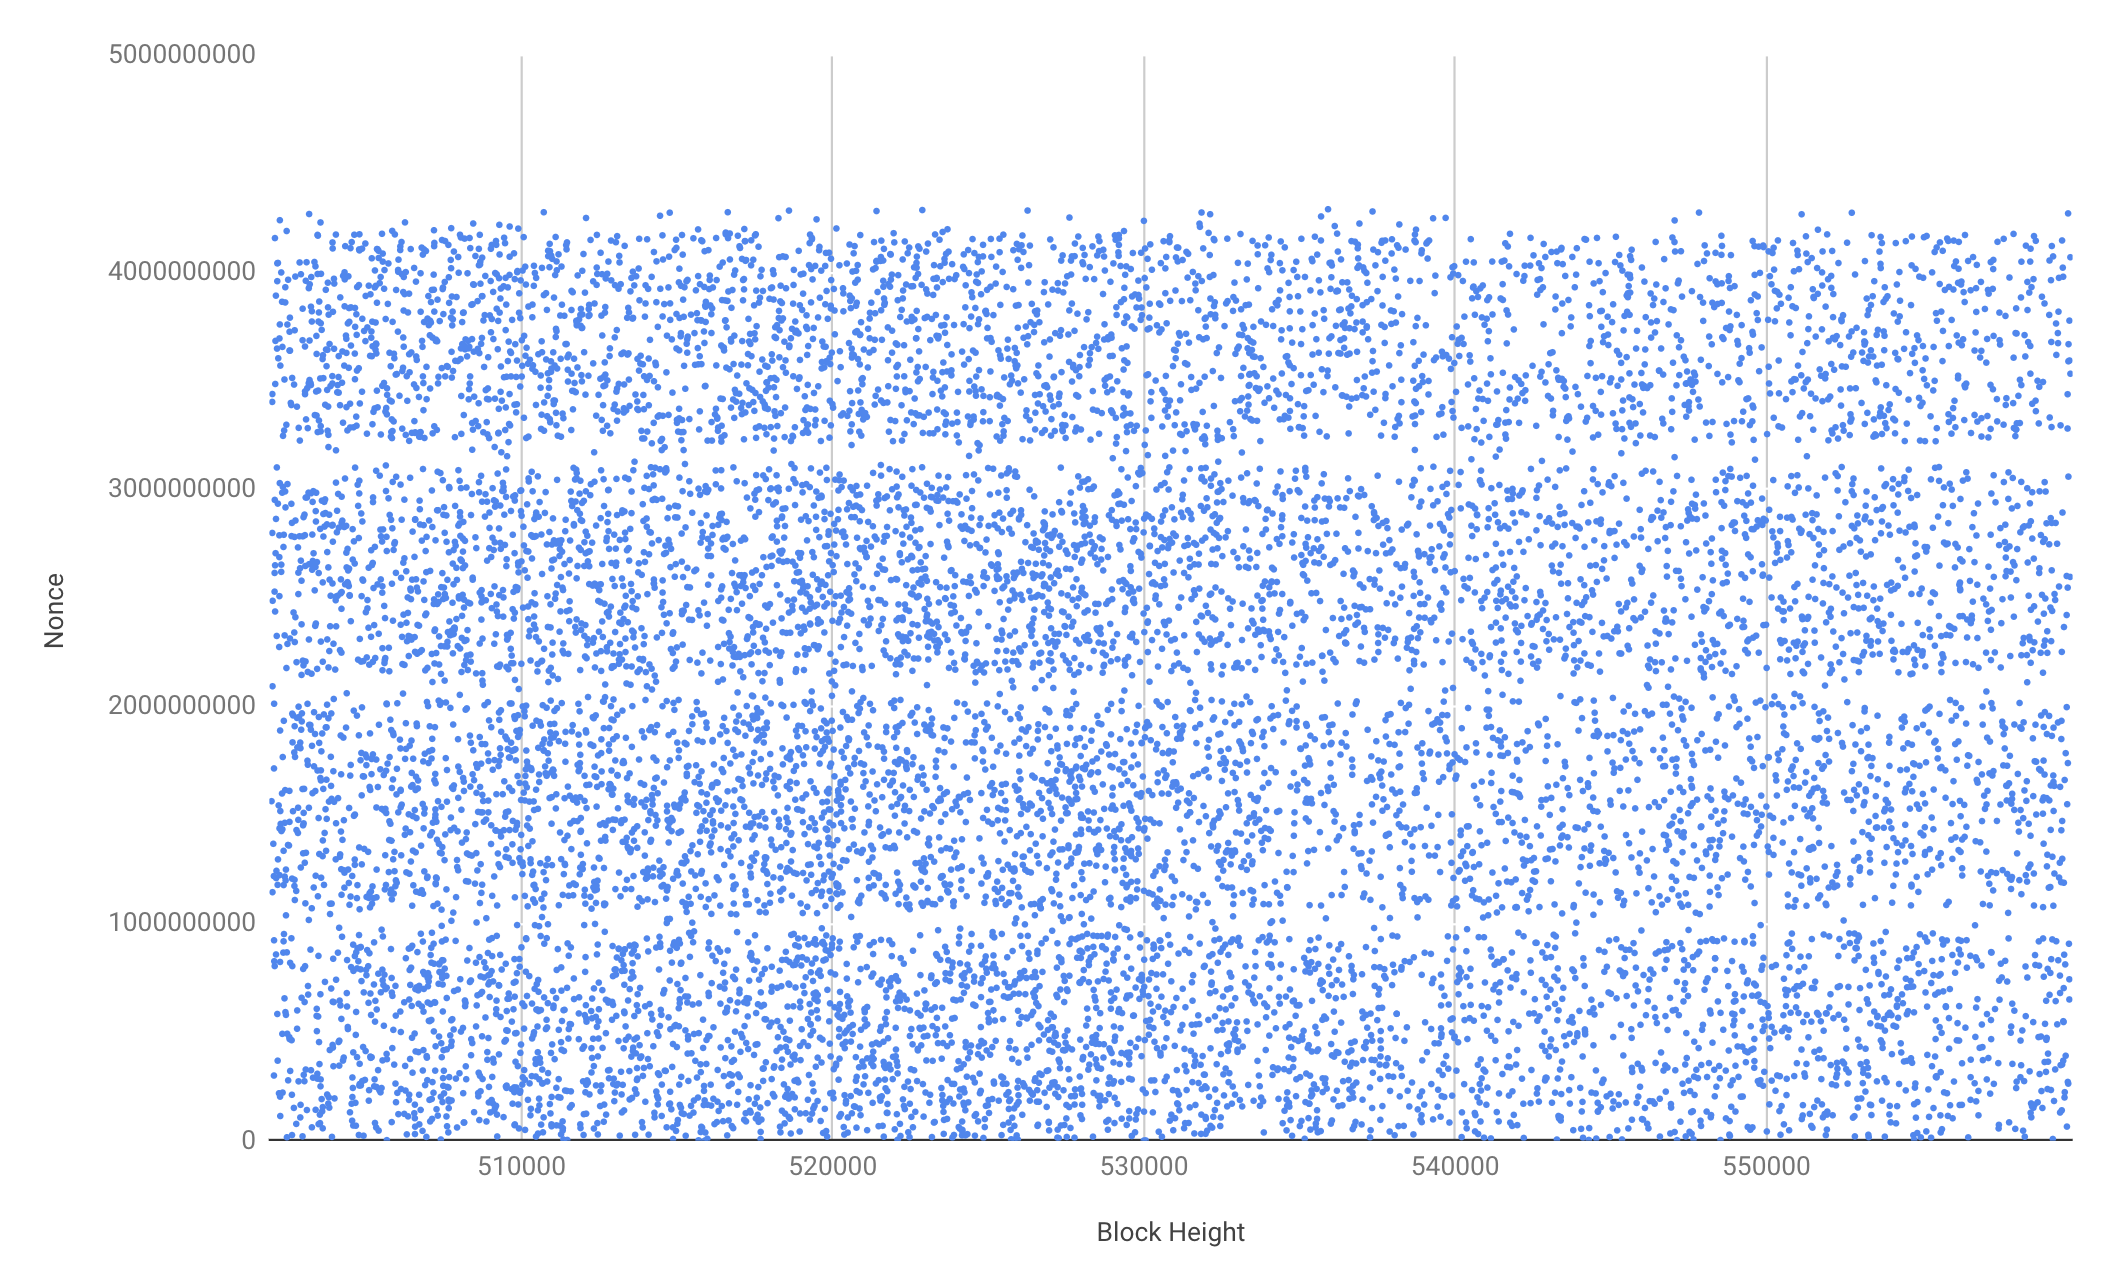
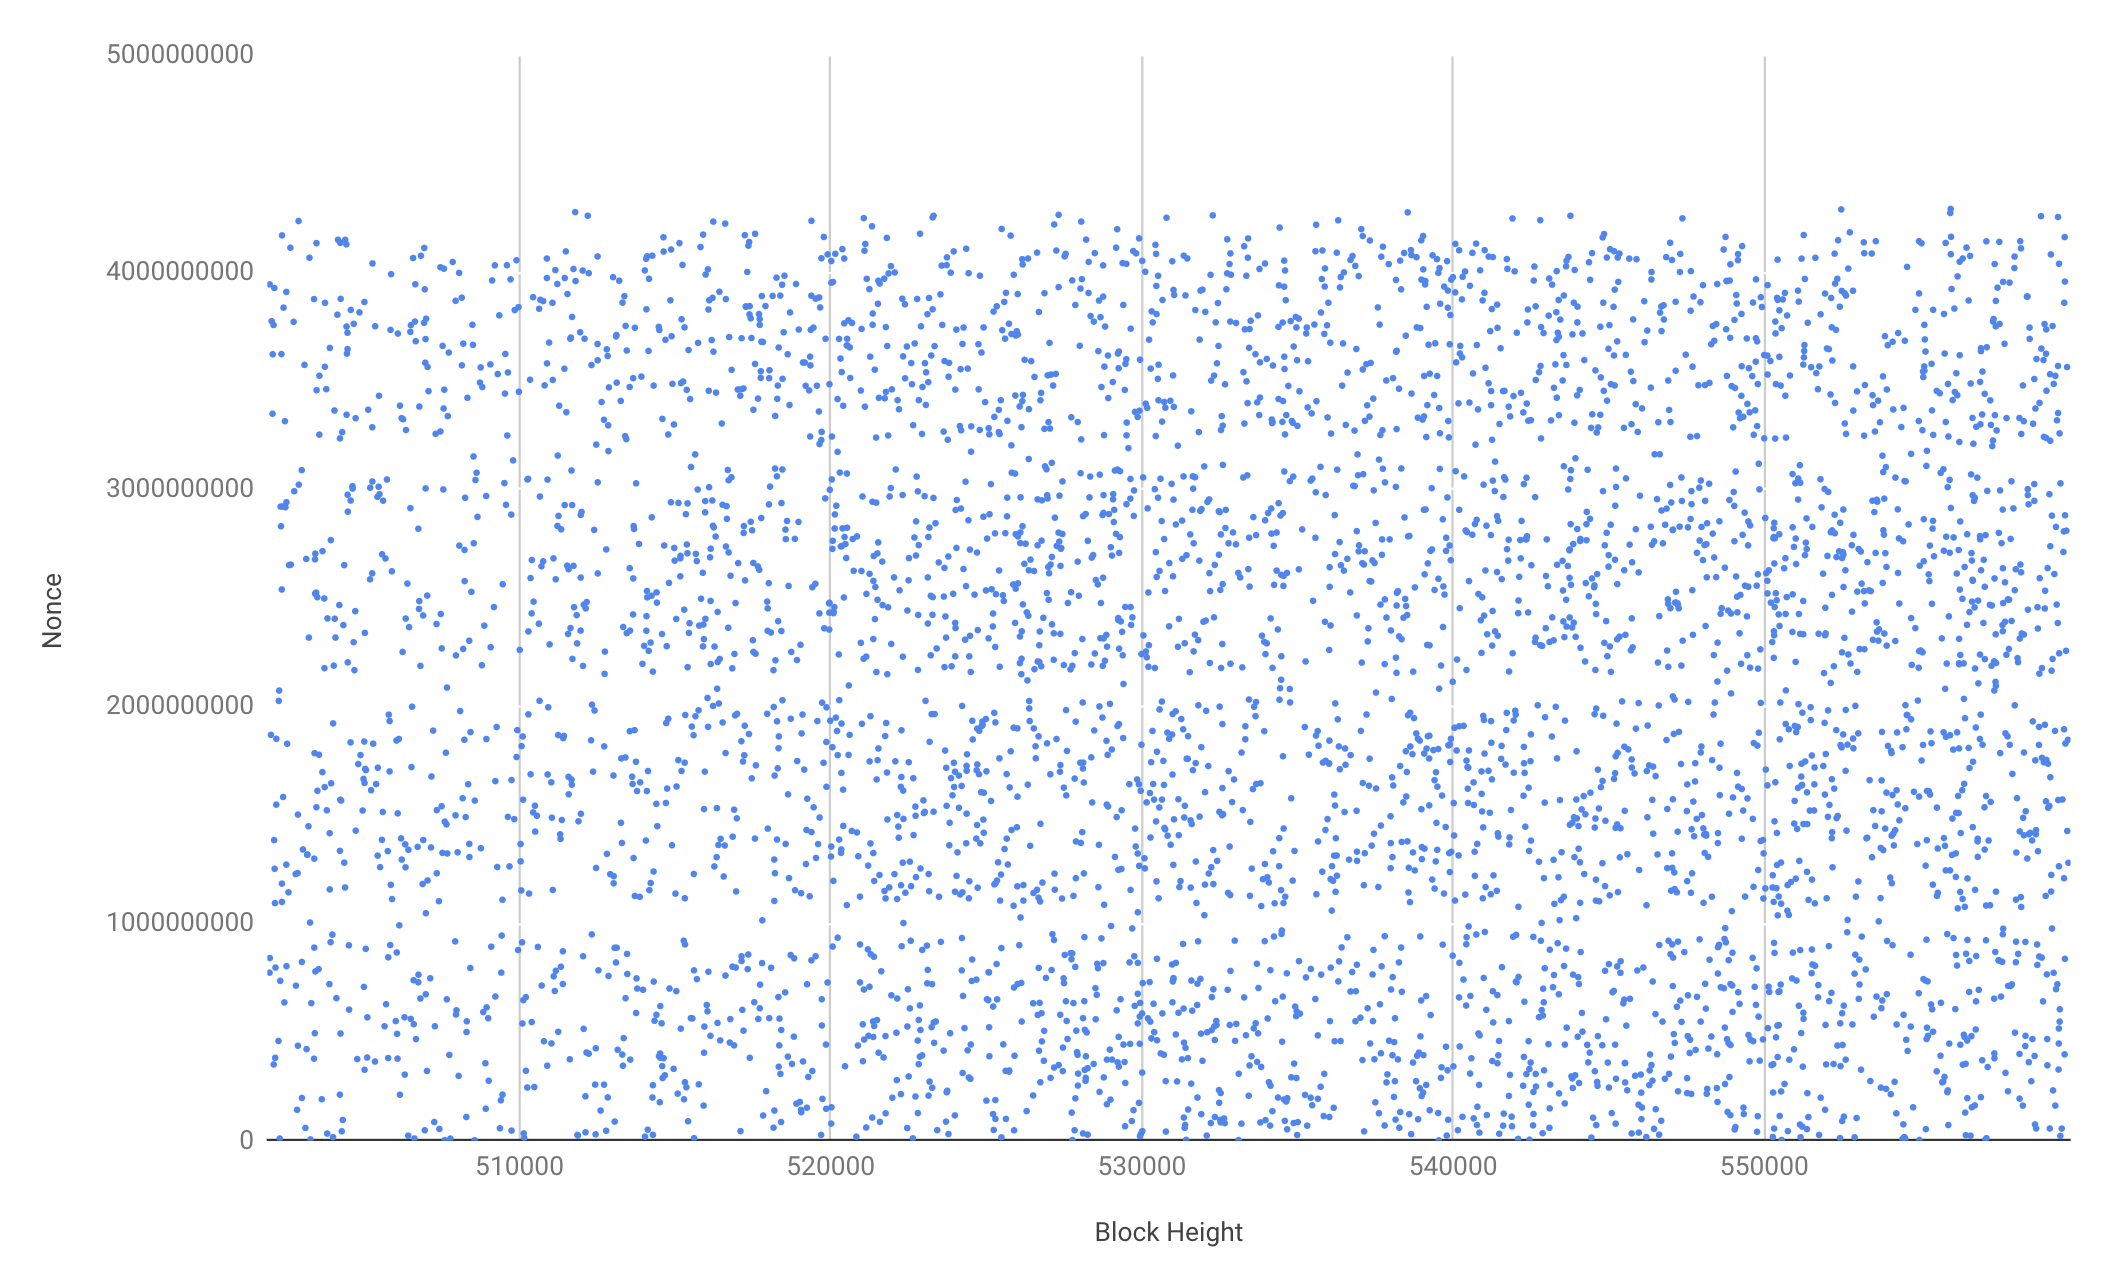
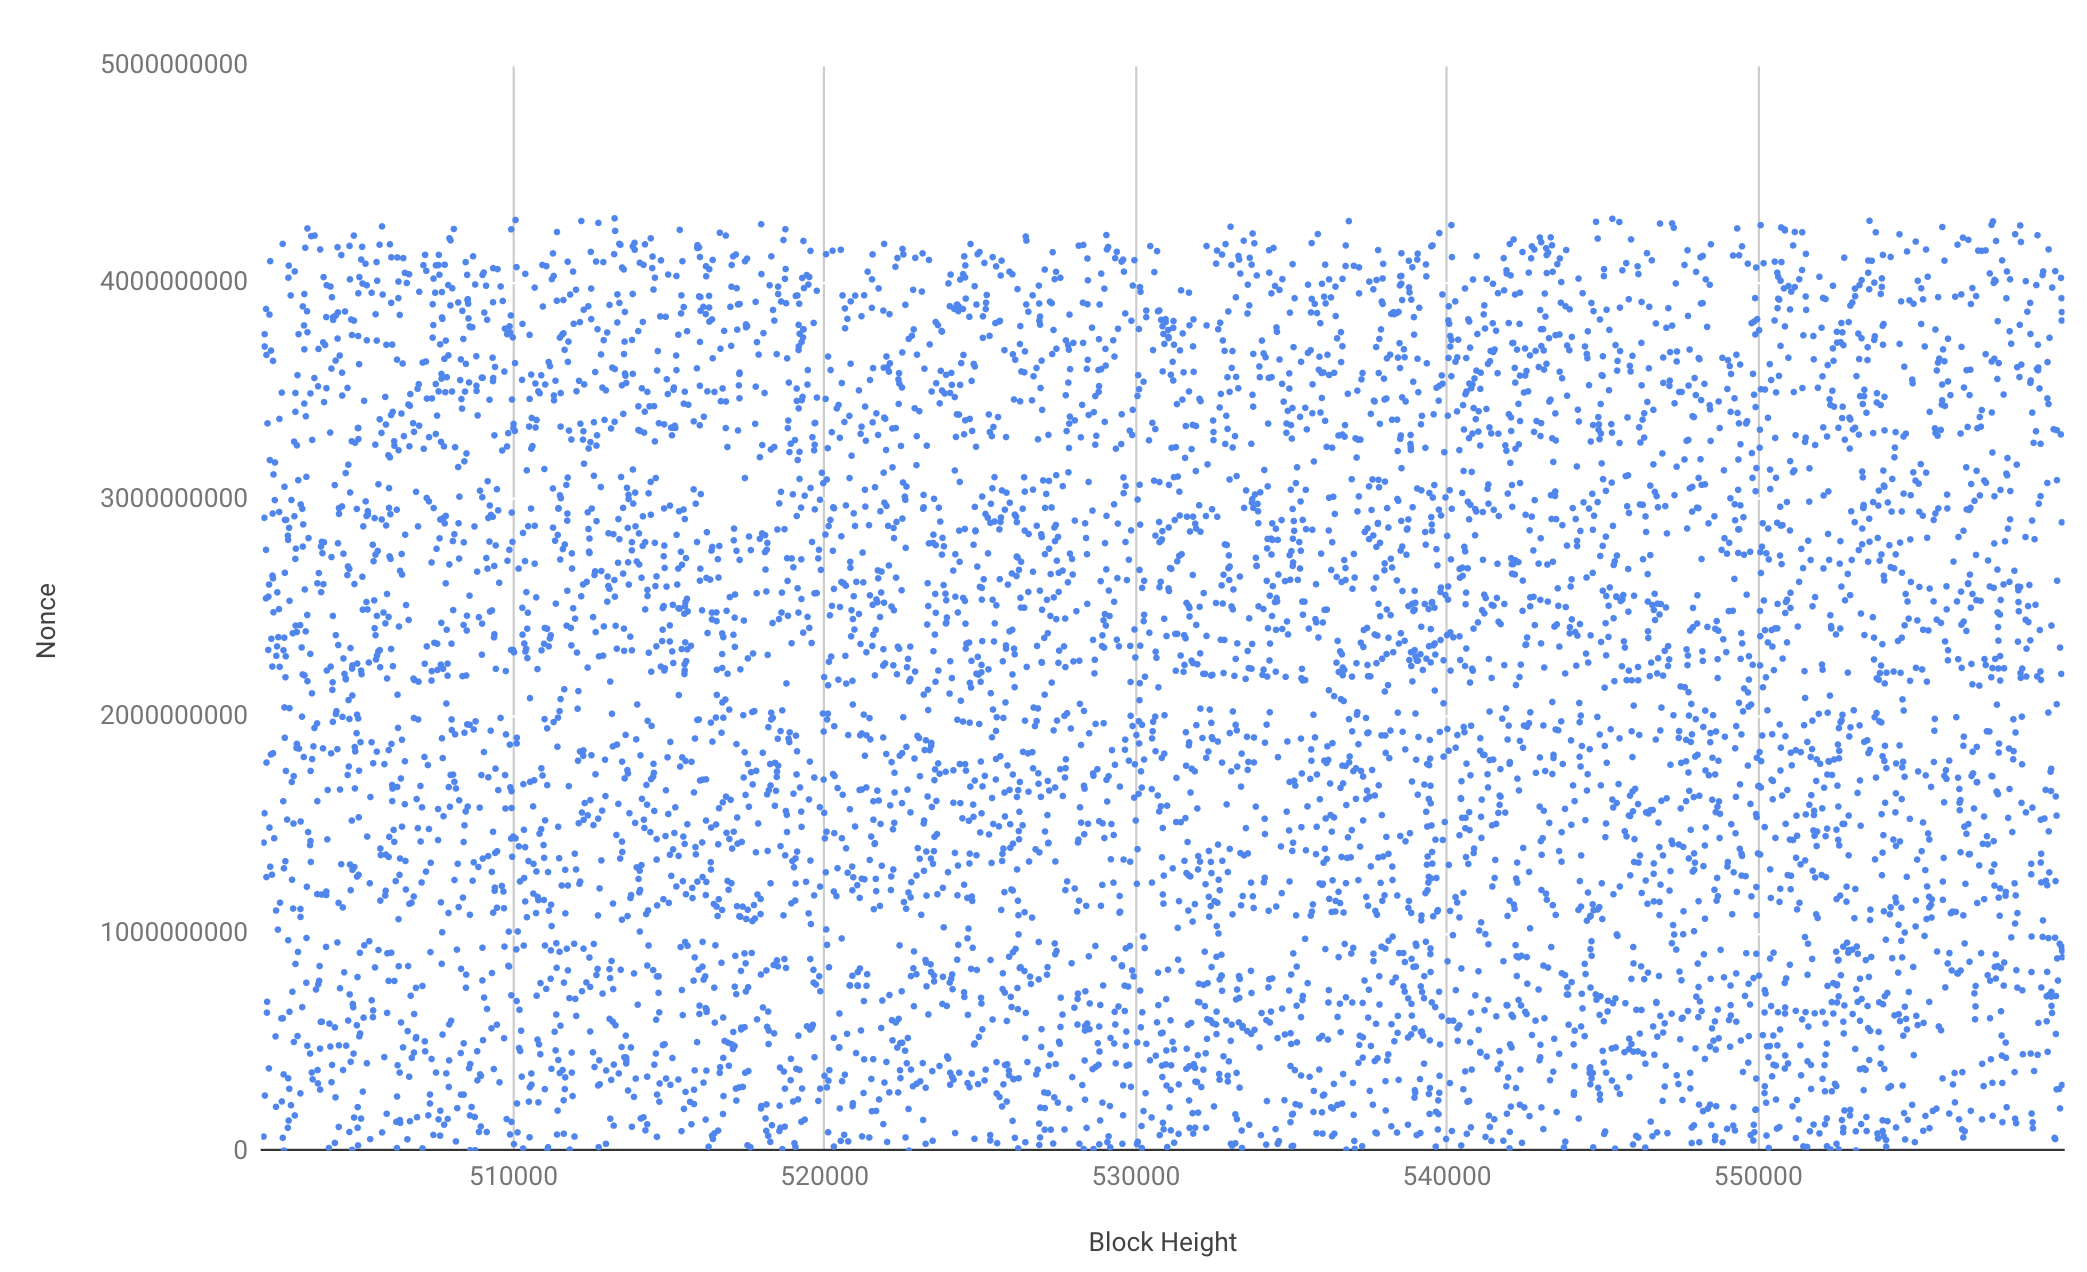
We have also produced an individual scatter chart for Antpool, BTC.com, F2Pool, Slushpool and Bitfury. The charts appear to agree with TokenAnalyst’s data, in that the “white spaces” are more clearly visible for Antpool, than for Slushpool and Bitfury. Although, with respect to Slushpool the white spaces are still visible, but they are more faint. Bitfury may not have found enough blocks for one to see a clear pattern. A statistical analysis may also be possible, although the human brain interpreting these scatter charts may be just as useful compared to some forms of statistical analysis.
Bitcoin nonce value distribution – All nonces (Since 2018)

(Source: BitMEX Research)
Bitcoin nonce value distribution – Antpool (Since 2018)
(Source: BitMEX Research)
Bitcoin nonce value distribution – BTC.com (Since 2018)
(Source: BitMEX Research)
Bitcoin nonce value distribution – F2Pool (Since 2018)
(Source: BitMEX Research)
Bitcoin nonce value distribution – Slush (Since 2018)
(Source: BitMEX Research)
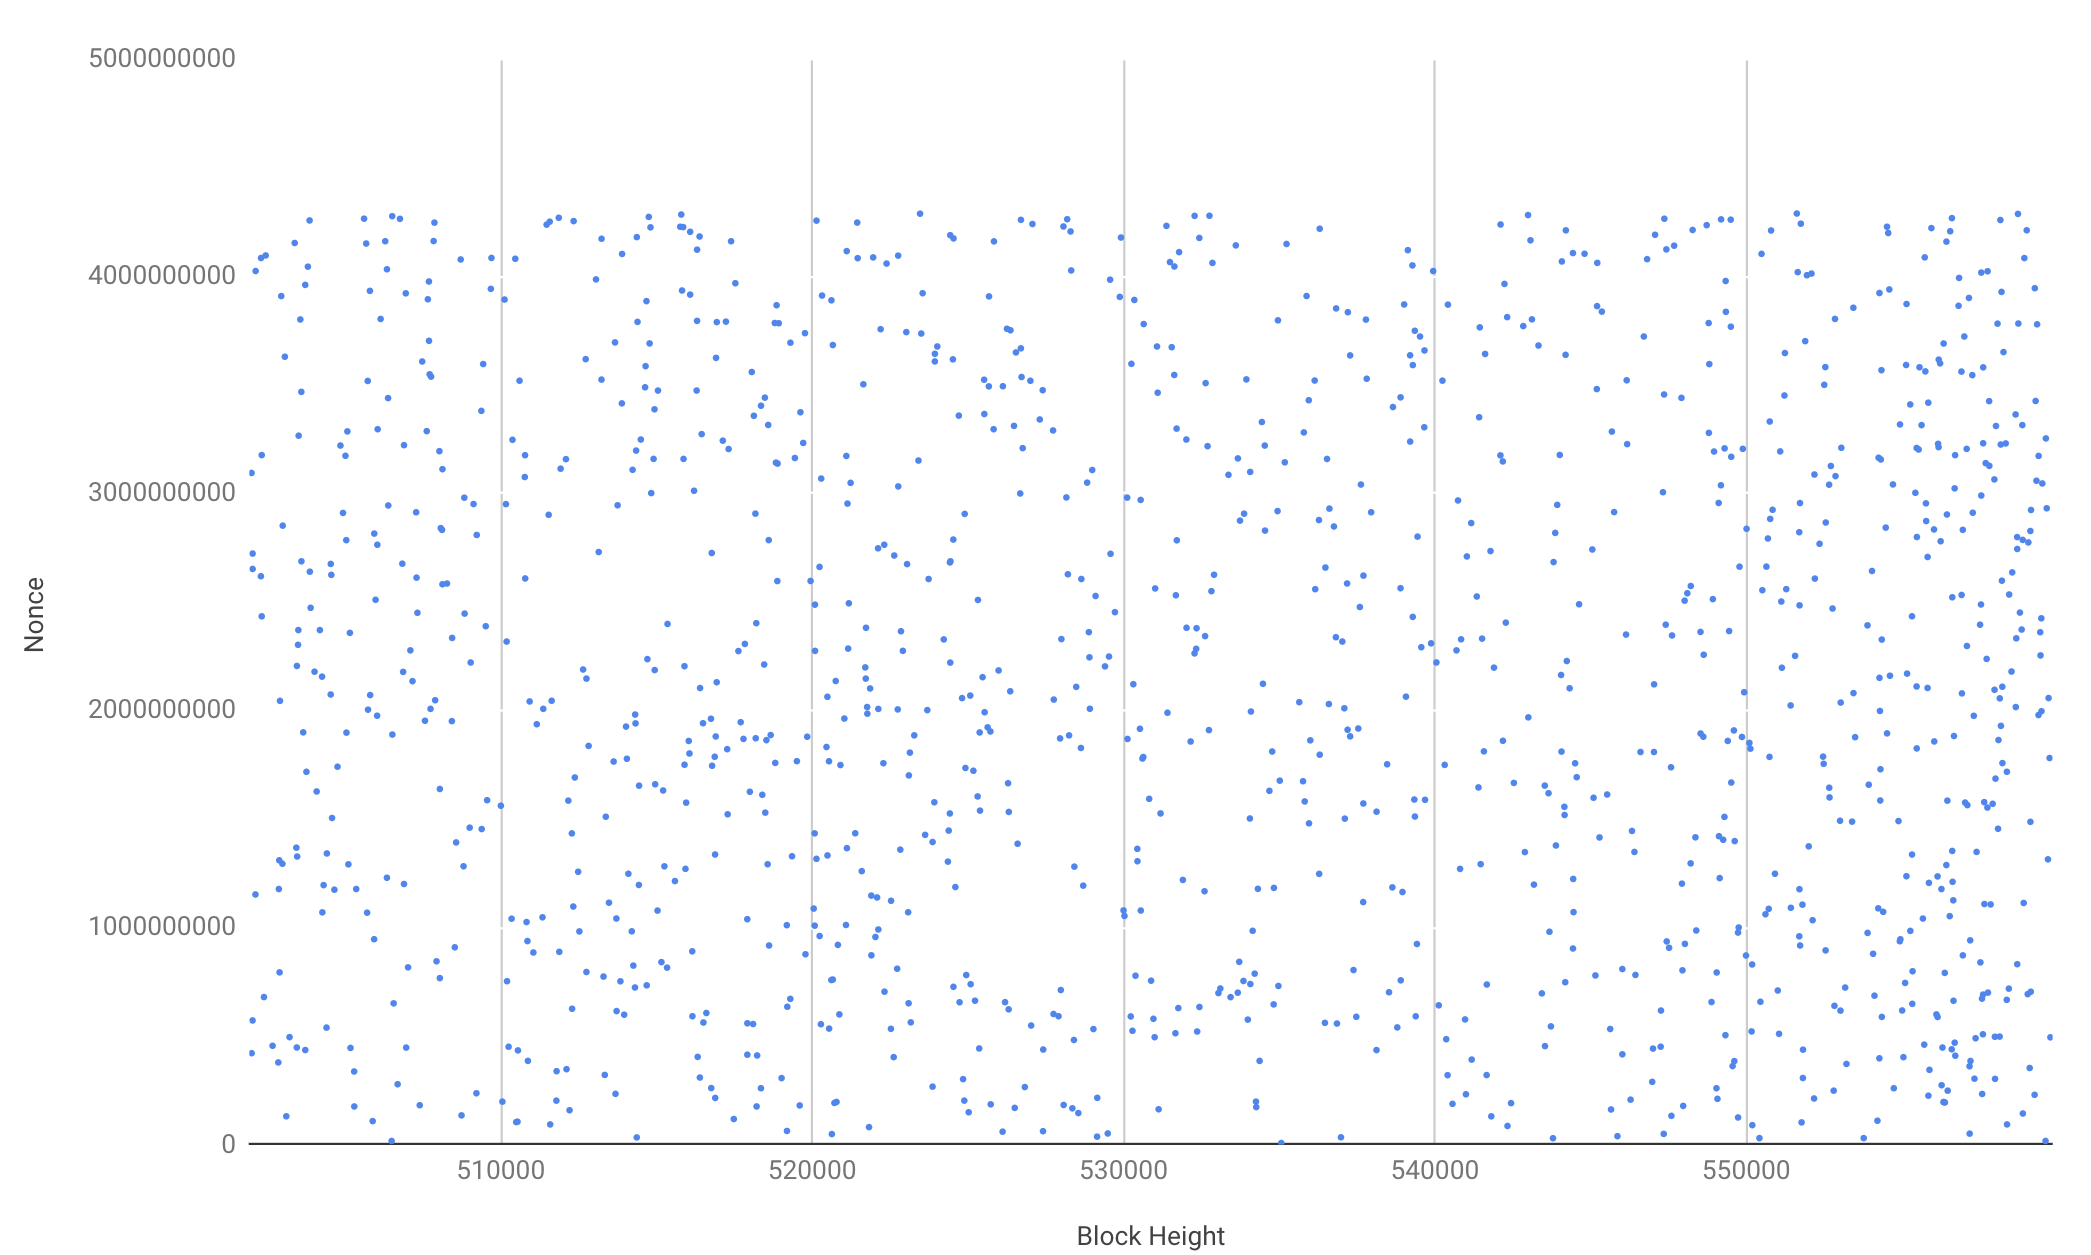
Bitcoin nonce value distribution – Bitfury (Since 2018)
(Source: BitMEX Research)
Bitcoin Cash ABC
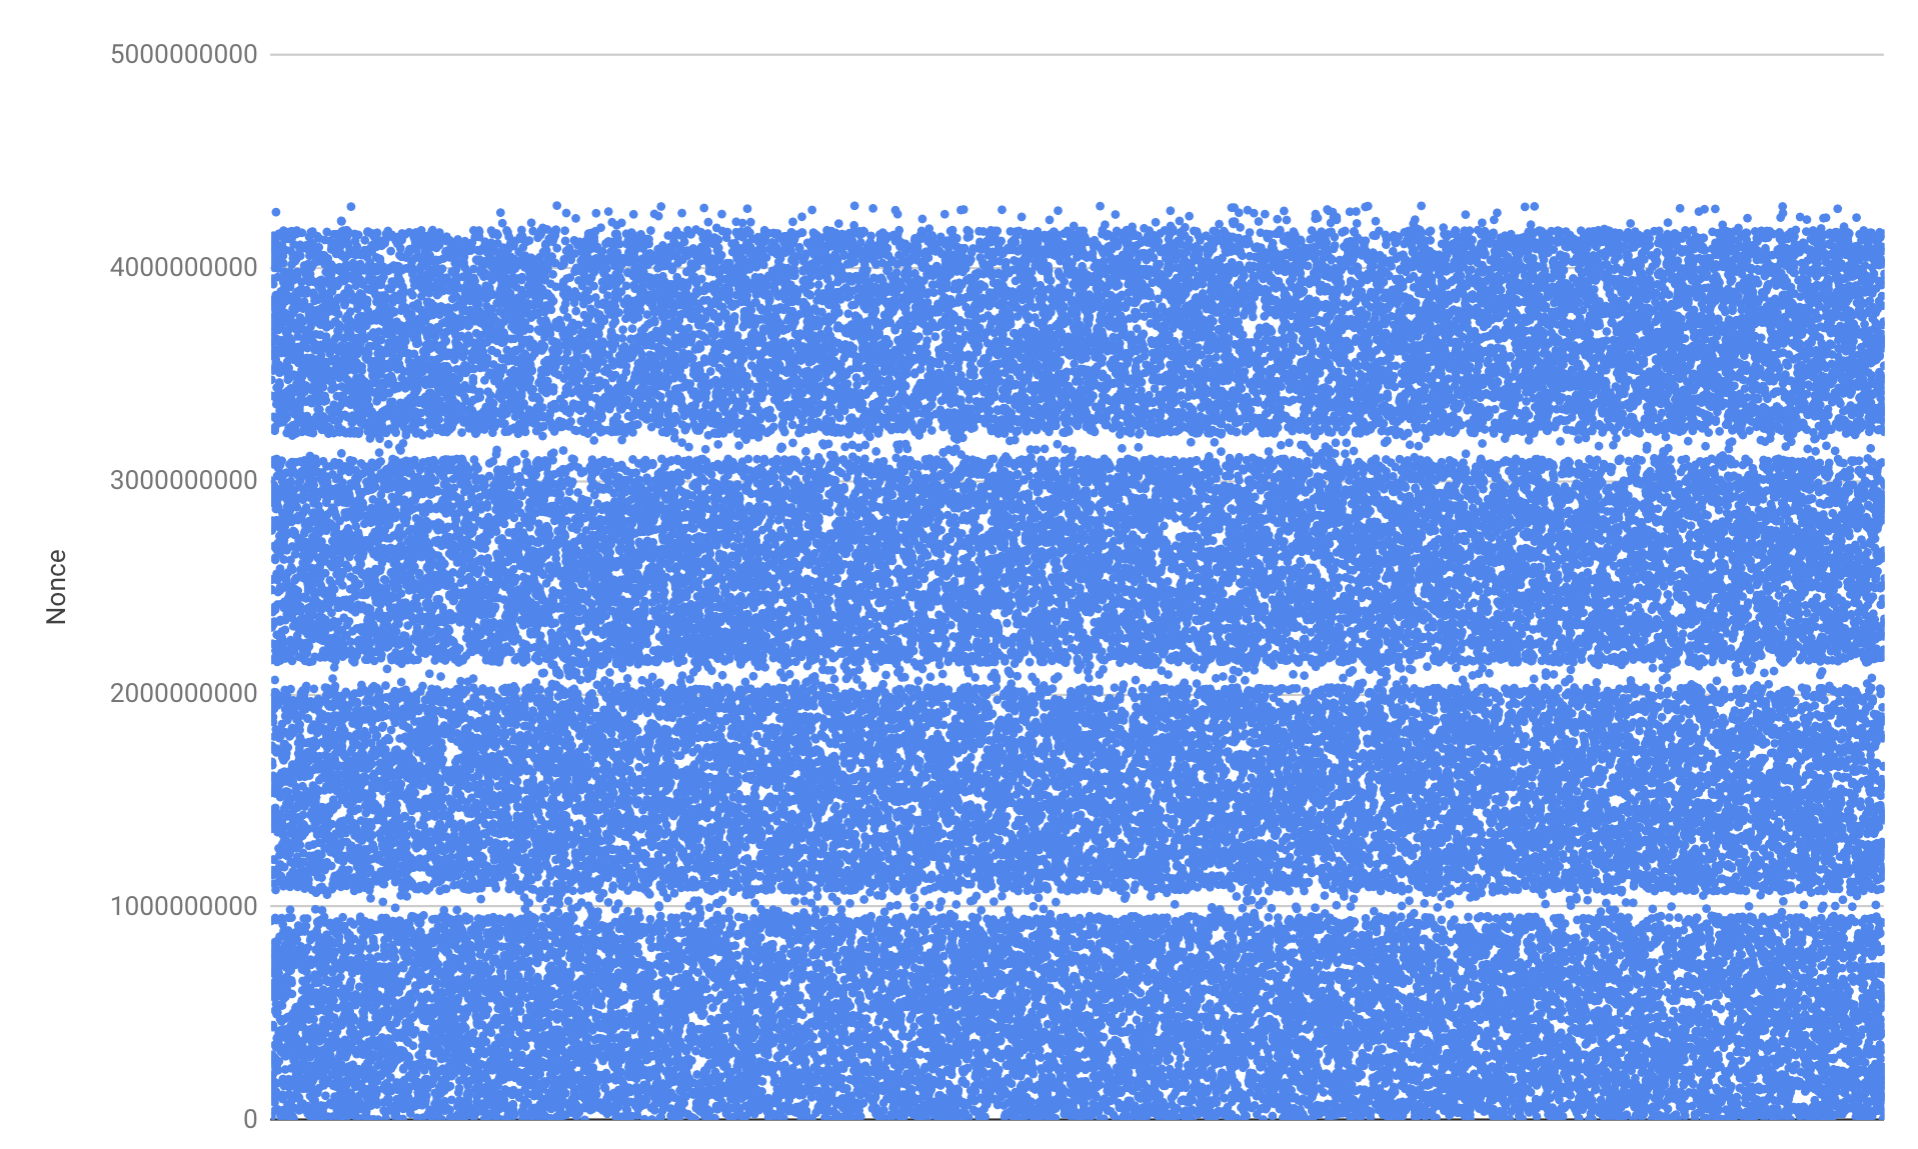
Bitcoin Cash ABC also shares the same nonce value distribution pattern as Bitcoin.
Bitcoin Cash ABC nonce value distribution – (Since 2018)
(Source: BitMEX Research)
AsicBoost
It is possible that covert AsicBoost may be either a contributing factor or cause of the pattern. The pattern began to emerge around the time many speculate covert AsicBoost started; and this pattern could be a quirk in the implementation of covert AsicBoost, which requires the manipulation of the nonce. However, the usage of covert AsicBoost is believed to have stopped in Bitcoin in 2018, when this pattern continued. Although it’s possible that despite covert AsicBoost itself being stopped, the quirk in the firmware remains.
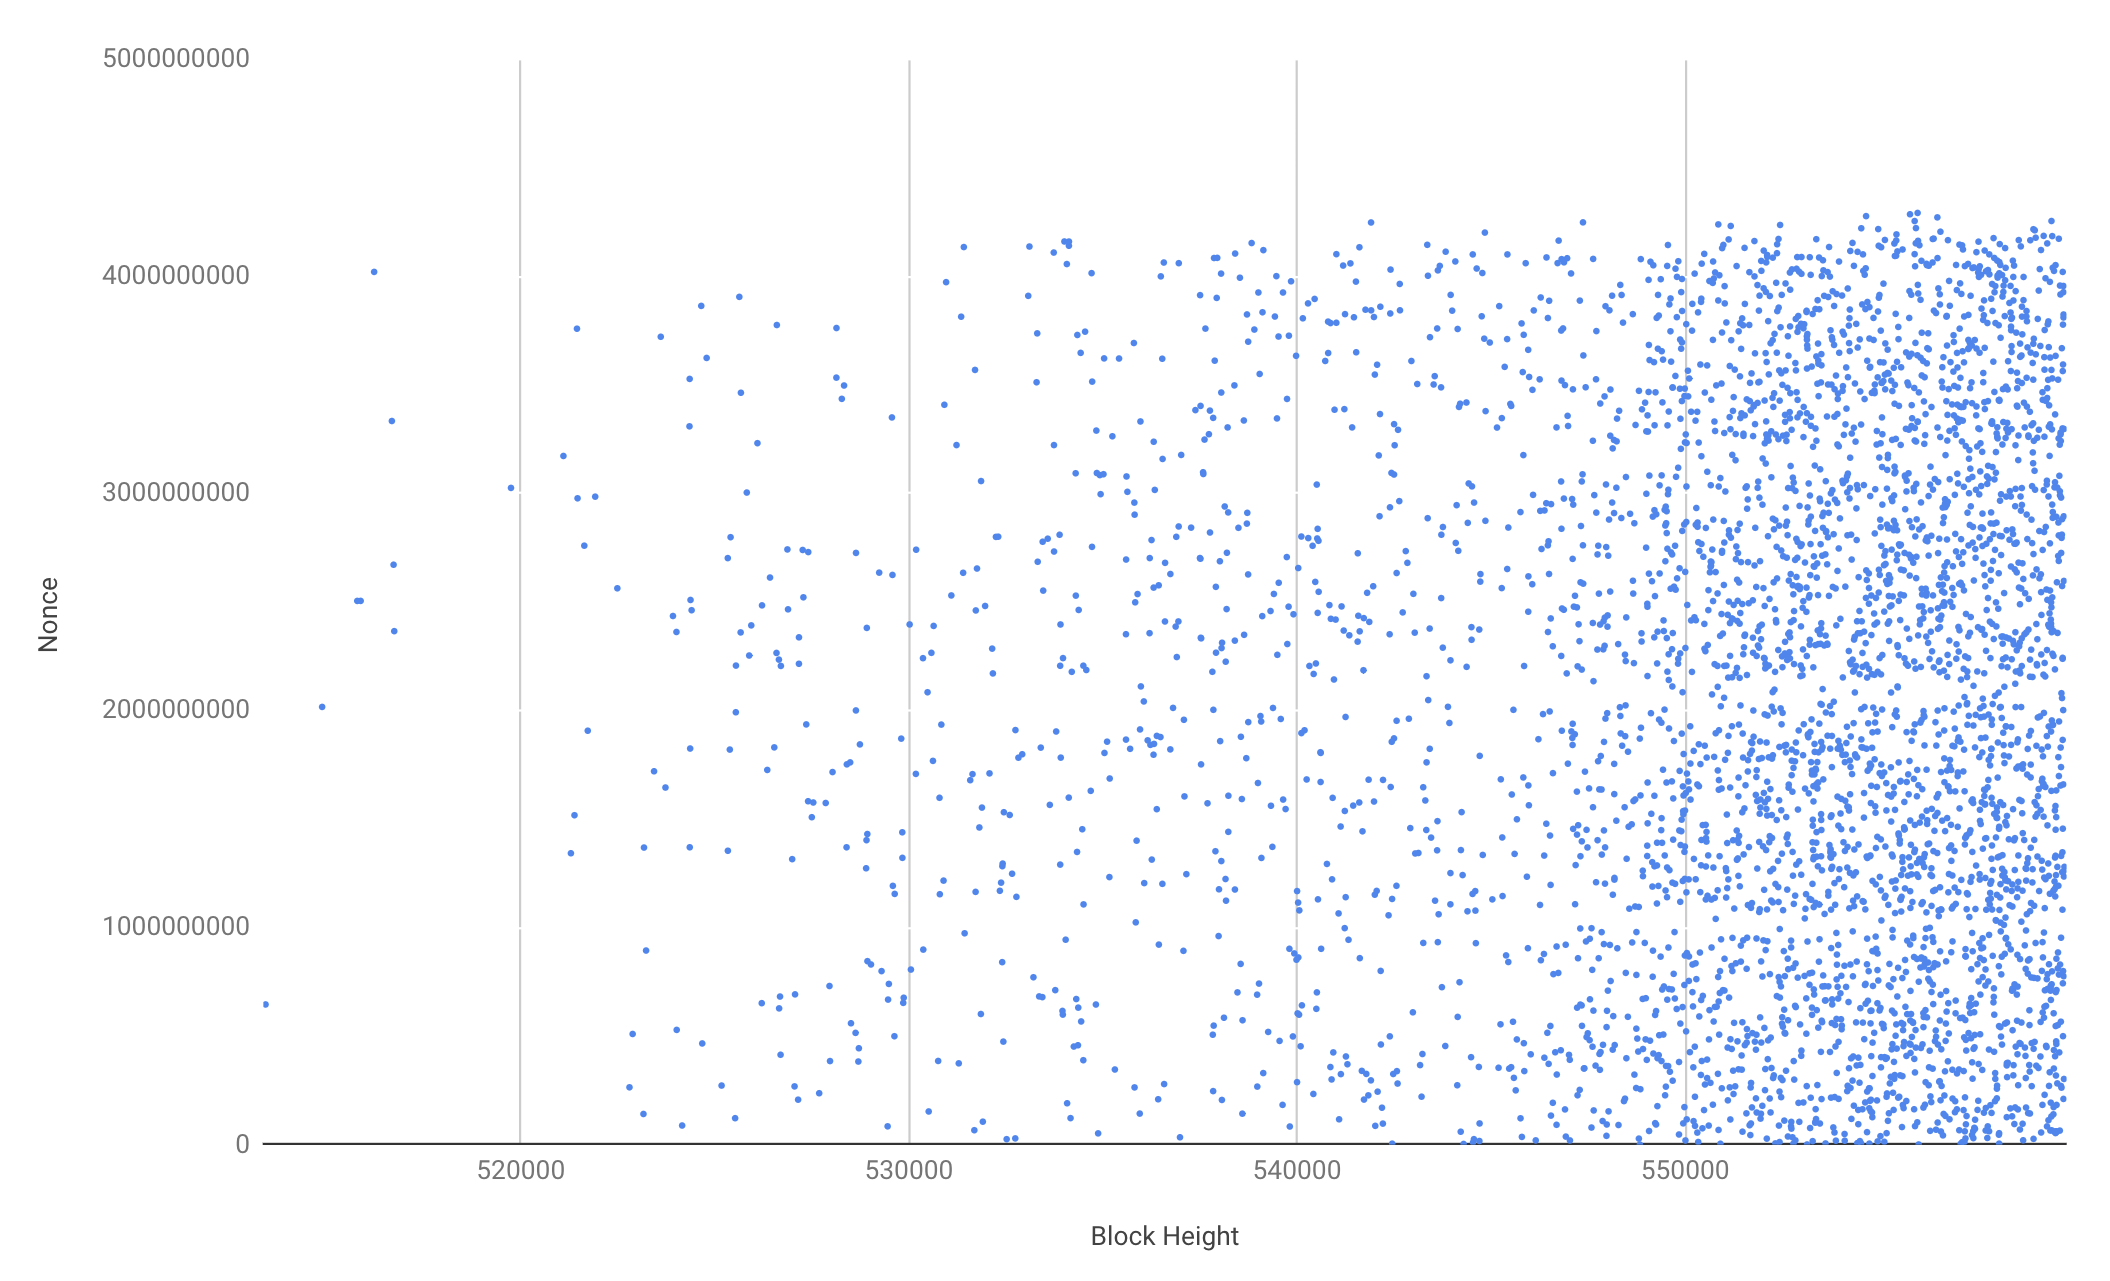
In the below chart we have looked at the nonce value distribution for blocks mined using overt AsicBoost. Again, the pattern remains visible, albeit faintly. This may suggest the pattern has nothing to do with covert AsicBoost, but it’s far from conclusive.
Bitcoin nonce value distribution – Overt AsicBoost blocks (Since 2018)
(Source: BitMEX Research)
Conclusion
For now, the unusual nonce value distribution on Bitcoin remains a mystery. The community may wish to dig into this issue further and conduct more analysis, such as reviewing mining pool software and ASICs in more detail. We would guess this is nothing more than a meaningless anomaly with a benign cause; however a mystery in Bitcoin like this could be intriguing to some analysts.
