Abstract: In this piece we present data displaying the proportion of smaller blocks produced by the different mining pools, over time. This follows on from our piece last week looking at empty blocks.

Smaller blocks overview
Following on from our analysis on empty blocks last week, some readers asked for a similar analysis to be conducted for non empty but smaller blocks, by mining pool. For your consideration, we present some data trying to capture the proportion of smaller blocks by mining pool. We are unable to draw any interesting conclusions from this analysis.
Charts illustrating the proportion of smaller blocks by mining pool
Figure 1 – Blocksize bucket analysis by mining pool (in bytes) – 2017
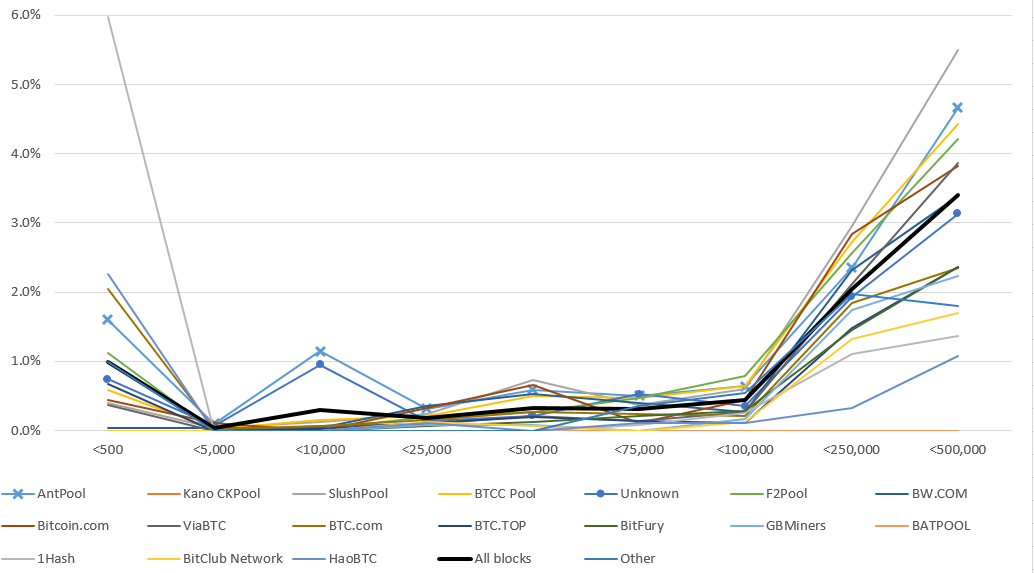
Source: Bitcoin Blockchain, BitMEX Research, Blockchain.info (For mining pool name)
Notes: Data up to 22nd October 2017. Mining pools with less than 800 blocks in the period are excluded
Figure 2 – Blocksize bucket analysis by mining pool (in bytes) – 2016
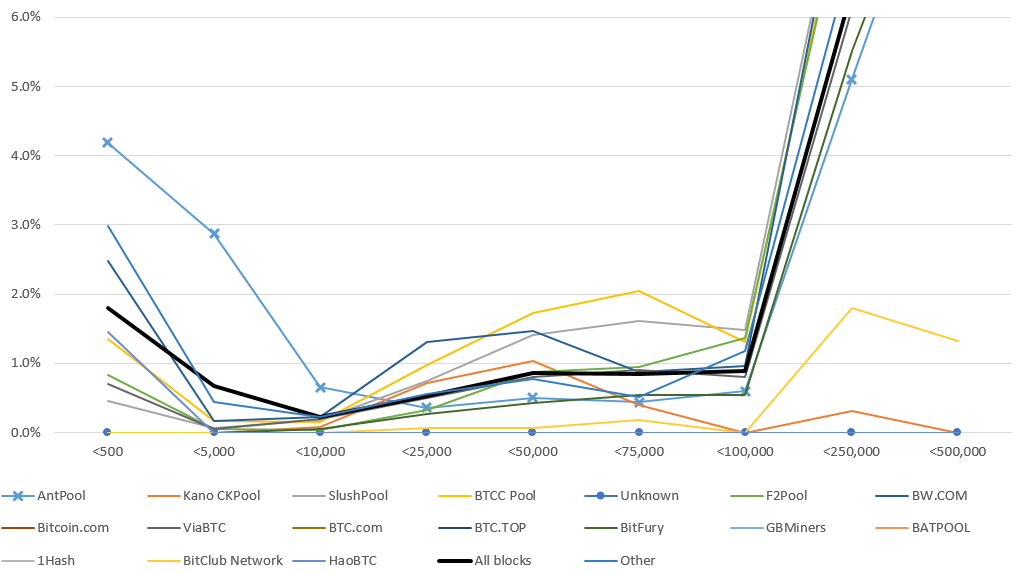
Source: Bitcoin Blockchain, BitMEX Research, Blockchain.info (For mining pool name)
Notes: Mining pools with less than 800 blocks in the period are excluded
Figure 3 – Blocksize bucket analysis by mining pool (in bytes) – 2015
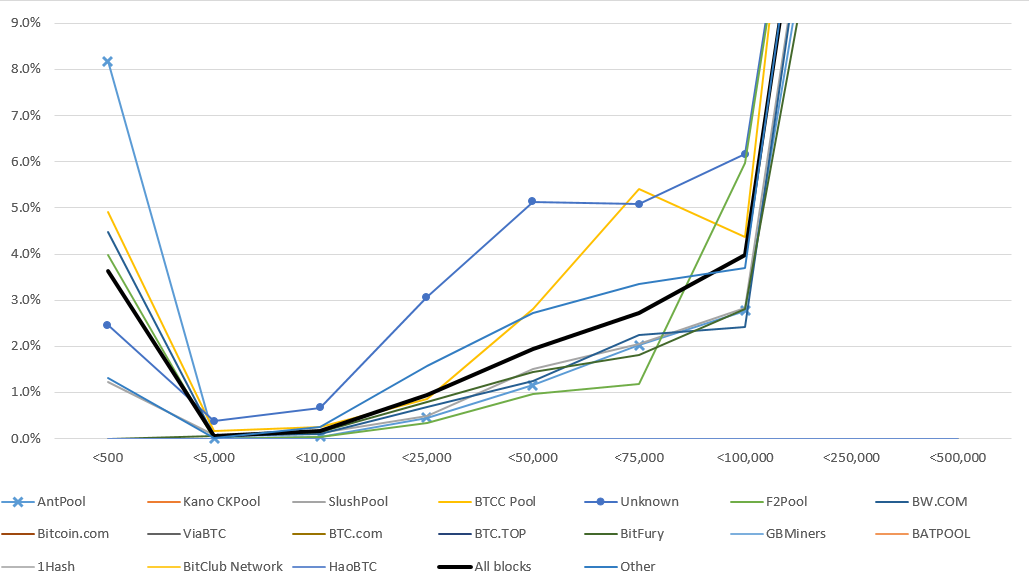
Source: Bitcoin Blockchain, BitMEX Research, Blockchain.info (For mining pool name)
Notes: Mining pools with less than 800 blocks in the period are excluded. BTCC Pool had many blocks with 2 transactions in this period
Figure 4 – Percentage of non empty blocks smaller than 10,000 bytes by mining pool – monthly
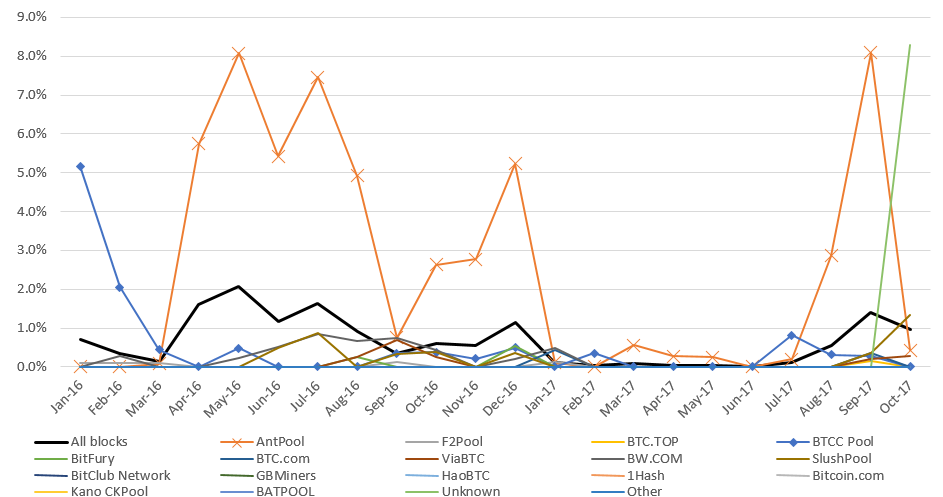
Source: Bitcoin Blockchain, BitMEX Research, Blockchain.info (For mining pool name)
Notes: Mining pool with less than 250 blocks in the month is excluded
Methodology
We chose 10 blocksize buckets:
- Less than 500 bytes
- 500 bytes to 5,000 bytes
- 5,000 bytes to 10,000 bytes
- 10,000 bytes to 25,000 bytes
- 25,000 bytes to 50,000 bytes
- 50,000 bytes to 75,000 bytes
- 75,000 bytes to 100,000 bytes
- 100,000 bytes to 250,000 bytes
- 250,000 bytes to 500,000 bytes
- 500,000 bytes to 1,000,000 bytes
The selection of the bucket boundaries was entirely arbitrary and therefore this could weaken the analysis. Figure 1 appears to indicate that the 10,000 byte bucket may be most significant, due to the apparent spike for some miners in 2017. Therefore non empty blocks less than 10,000 bytes were chosen as the range for the monthly chart, which is shown in figure 4.
Concluding remarks
As a reminder we do not believe any of the above data is strong evidence for covert ASICBOOST. Others have argued that smaller or empty blocks by some mining pools could be considered as circumstantial evidence for covert ASICBOOST, without always providing data backing up these claims. Our objective here was simply to produce charts illustrating the prevalence of these smaller blocks by mining pool.