This piece will delve further into neckline continuation patterns including Cup and Handle Patterns and Head and Shoulders, and how their unique layouts are important for any trader. This blog is part of a series that has already covered; the basics of chart patterns, guide to continuation patterns and the roles of triangles.
What is a Cup and Handle Pattern?
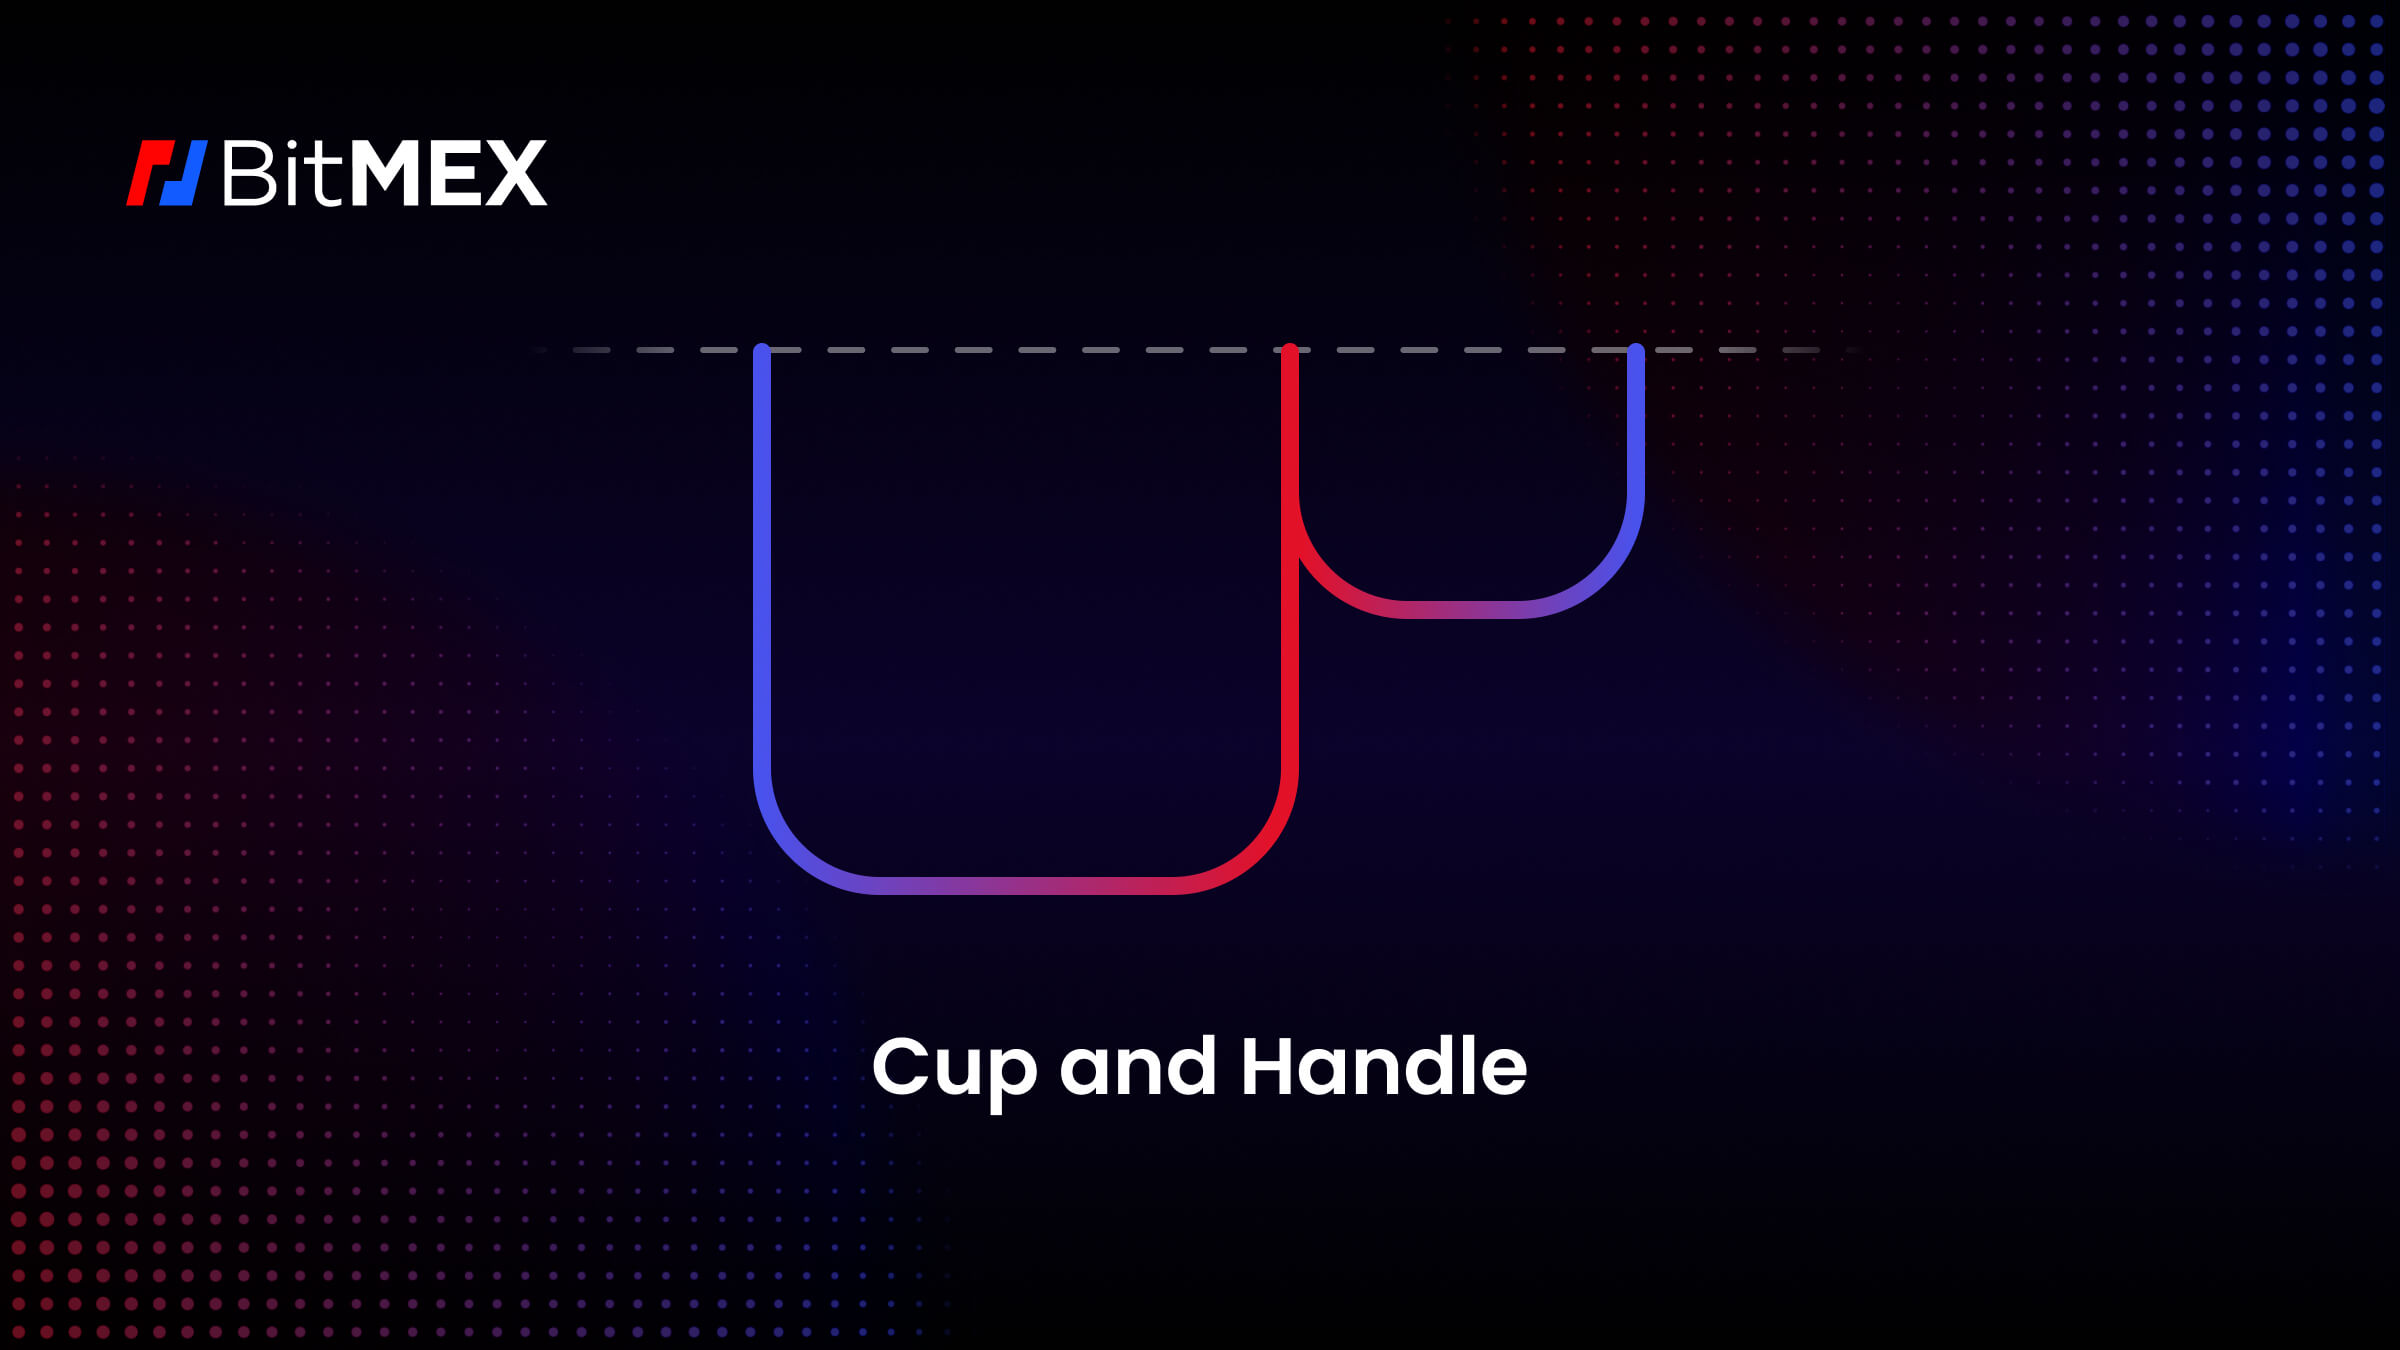
A cup and handle chart is a bullish pattern. It is visually similar to a tea cup in that the price of the asset will form a rounded bottom (known as the “cup”), followed by a short consolidation (known as a retracement), which will occur before a bullish breakout.
About Trend Lines
Cup Formation: A Cup-shaped bottom is the first stage of the identification process. It is characterised by a rounded U-shaped or V-shaped shape with an initial gradual decrease in price, then a gradual rise in price, resulting in the curvature of the cup’s bottom. However, the cup’s depth can vary -, it should generally have a smooth, rounded shape rather than an abrupt reversal, e.g. like the V-shaped move.
Handle Formation: Once the cup has been identified, a short consolidation period should be observed near the apex of the cup, which constitutes the handle. Typically, the handle appears as a relatively small down or sideways movement in the price.
- Volume: Trading volumes decline during the cup formation, indicating a decrease in selling pressure. A slight increase of volume during the handle formation is a pattern confirming indicator. Once the price begins to breakout from the handle there should be a substantial increase in trading volumes as an indication of renewed interest and a confirmation of the breakout strength.
- Breakout Confirmation: The breakout from the upper resistance level of the handle is the primary signal for confirmation of the pattern. The breakout should be followed by an increase in trading volume. This indicates an increase in buying interest and confirms the pattern’s upward potential.
- Symmetry: The cup’s left and right sides should be symmetrical in shape and length. Symmetry enhances the pattern’s dependability.
- Support and Resistance Levels: The pattern’s primary levels of support and resistance can be used to determine the possibility of a breakout and confirmation point. The resistance levels are typically located at the apex of both the cup and handle. The breakout level is used as resistance that is transformed into support after a breakout.
How to Confirm the Cup and Handle Pattern :
- Pattern Structure: Ensure that the cup and handle pattern follows the characteristic structure. The cup should have a rounded U or V shape, indicating a gradual shift from a downtrend to an uptrend. The handle should show a slight downward or sideways movement within the upper portion of the cup, representing a consolidation phase.
- Volume Trend: Following a breakout, observe the volume trend. Sustained high volume in the days after the breakout suggests that the market is still interested in the pattern and confirms that the pattern has the potential to move up in price.
What is the Head and Shoulders Pattern?
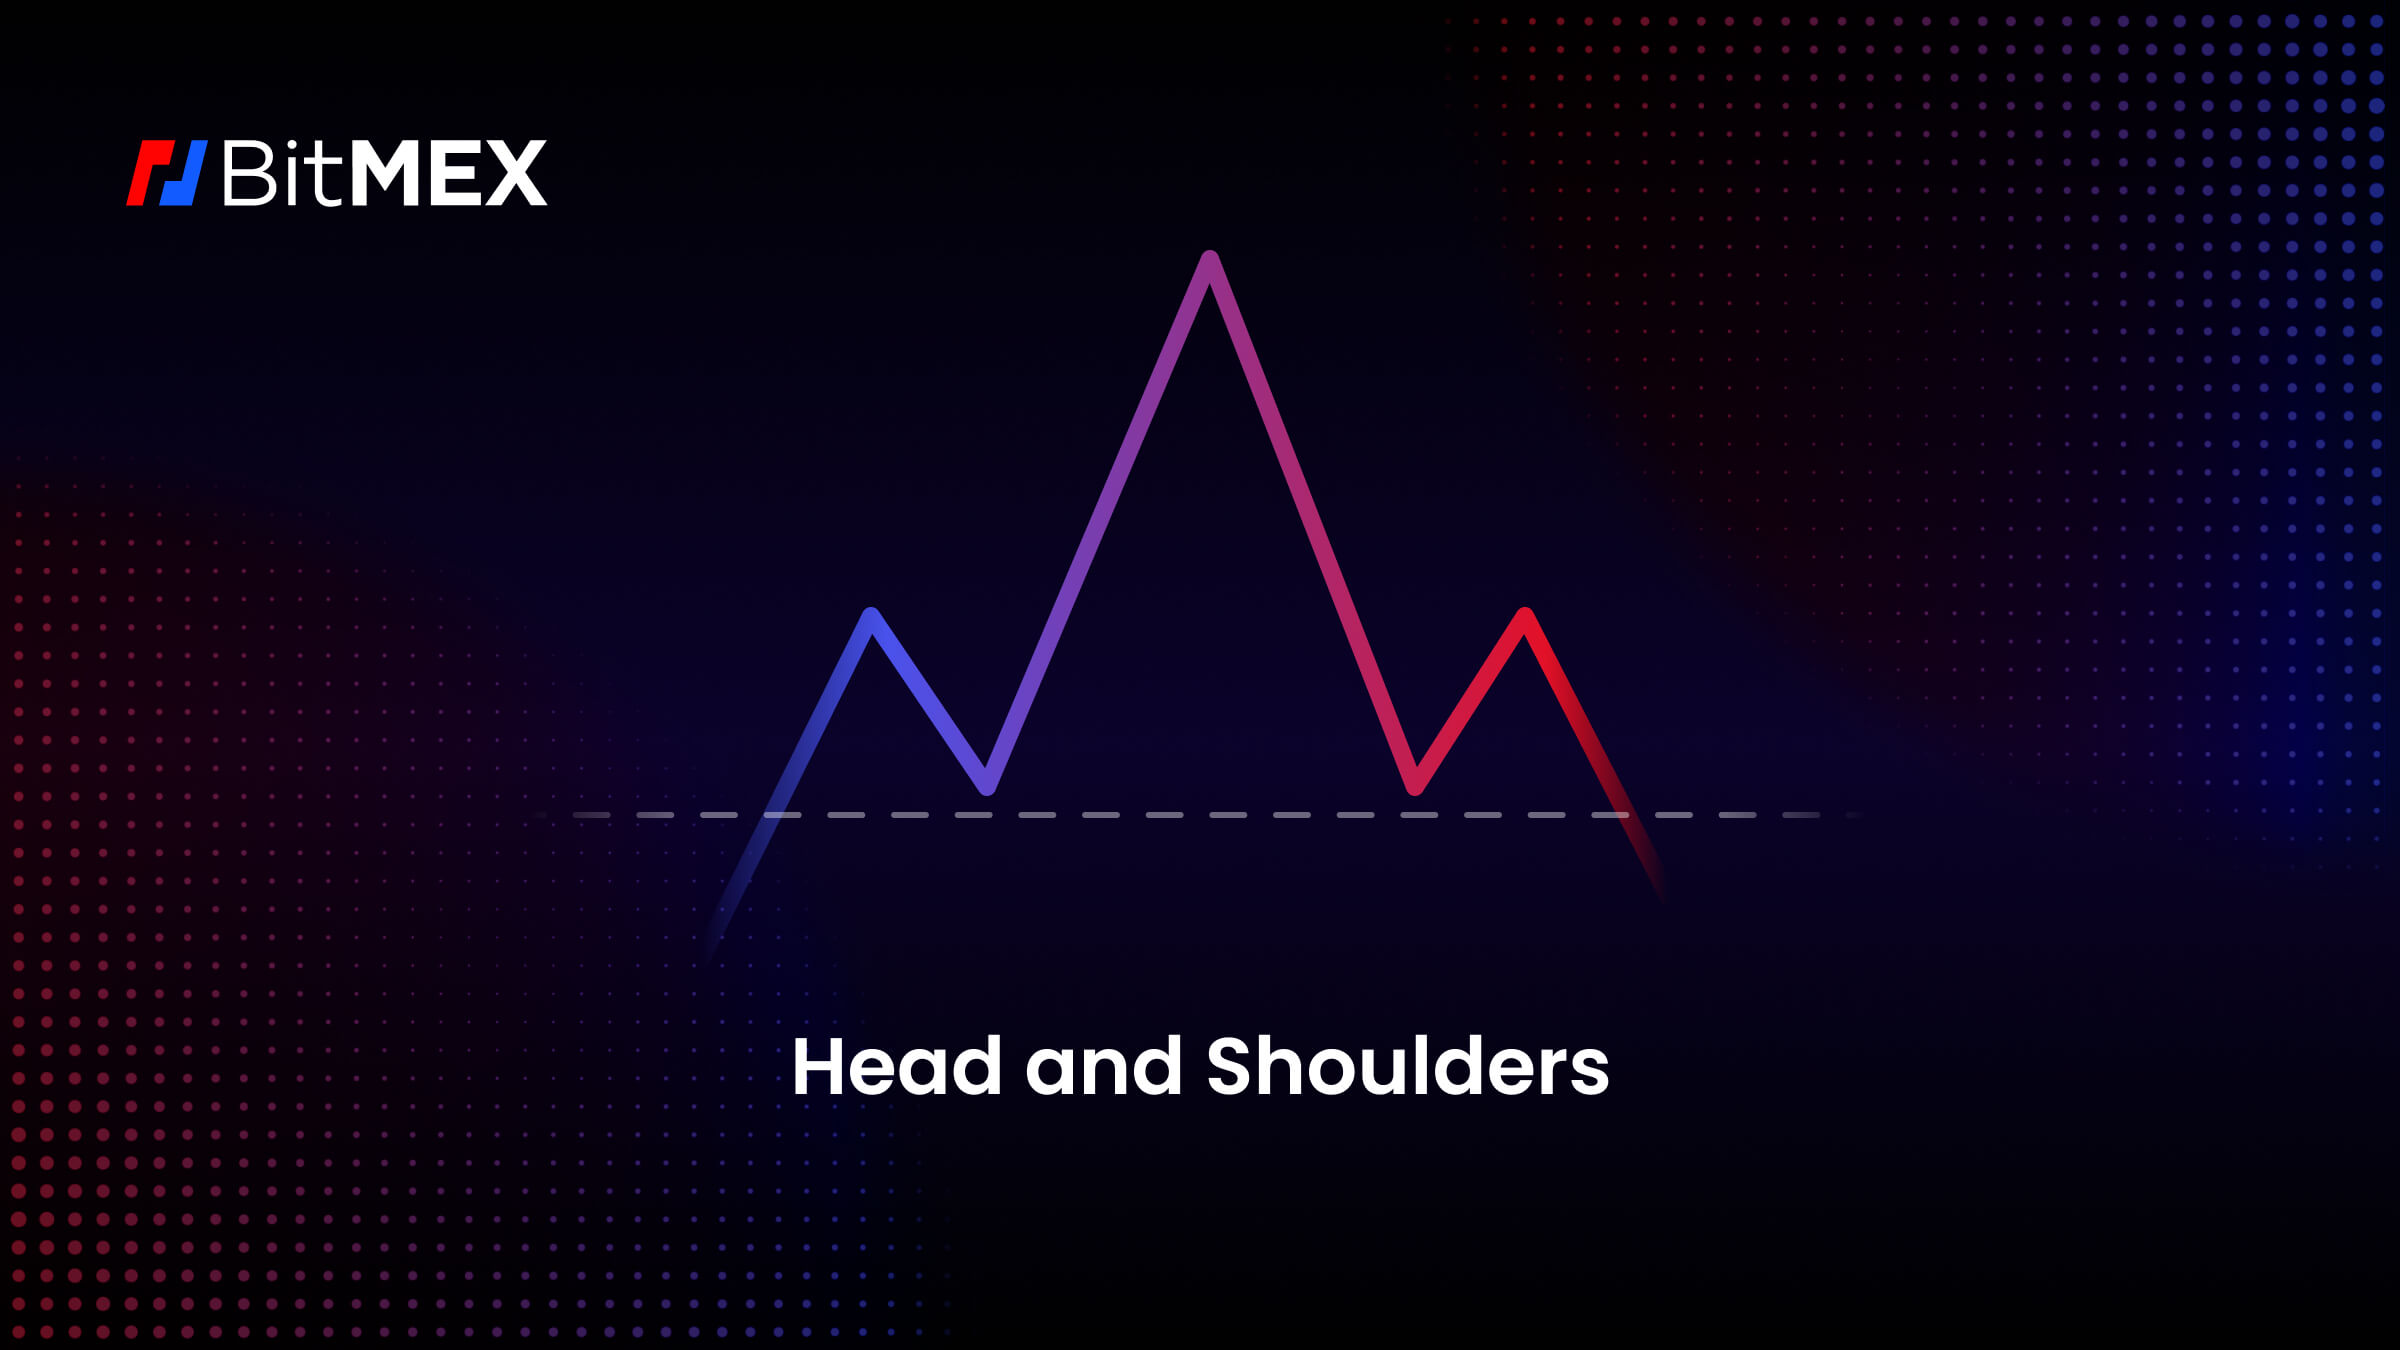
Head and Shoulders is a common technical chart pattern used in financial markets to signal a trend reversal. It is composed of three peaks, with a central peak forming the head and two smaller peaks forming the shoulders. This pattern is most commonly observed when a trend has shifted from an uptrend to a downtrend. It is often regarded as a bearish pattern when it appears following an uptrend, and is easy to recognize for beginners due to its distinctive shape.
What are the Indicators of the Head and Shoulders Pattern?
-
- Three Peaks: The pattern is composed of three peaks: a central peak, the head, and two lower peaks, the shoulders, on either side of the central peak. The left and right shoulders should be symmetrical, with the head being the highest point on the body.
- Troughs (Neckline): The neckline of the pattern is composed of two troughs. The troughs connect the lowest points of the left shoulder to the head, and the head to the right shoulder. This neckline is horizontal or slightly inclined.
- Volumes: Trading volumes tend to increase during the left shoulder formation and head formation, and then decline during right shoulder formation. A significant increase in volume after neckline breakout increases the probability of reversal.
How to Trade with Continuation Patterns:
- Uptrend Context: It is important to ensure that the pattern emerges after a long-term uptrend. A reversal pattern, such as the head and shoulders, indicates that the uptrend may be weakening.
-
- Neckline Breakout: The confirmation of the pattern takes place when the price falls below the collar line. This is a sign that the pattern has been completed and that a new downward trend may be forming.
- Volume Confirmation: A spike in volume during neckline breakout makes the pattern stronger.
Theoreticals aside, if you wish to begin trading crypto derivatives or spot on BitMEX, you can find all our existing products here. For more educational resources on trading at BitMEX, particularly derivatives, visit this page.
To be the first to know about our new listings, product launches, giveaways and more, we invite you to join one of our online communities and connect with other traders. For the absolute latest, you can also follow us on Twitter, or read our blog and site announcements.