The Moving Average is one of the most versatile and widely used of all technical indicators and is the basis for many mechanical trend-following systems in use today. This is because of the way it is constructed and the fact that it can be so easily quantified and tested.
It’s no secret that chart analysis is largely subjective and difficult to test. As a result, chart analysis does not lend itself that well to computerisation. Moving average rules, by contrast, can easily be programmed into a computer, which then generates specific buy and sell signals.
While two technicians may disagree as to whether a given price pattern is a triangle or a wedge, or whether the volume pattern favours the bull or bear side, moving average trend signals are precise and not open to debate.
What is Moving Average?
Before we explore this technical indicator, let’s begin by defining what a moving average is. A moving average is a technical indicator that shows the average price of an asset over a specified number of recent periods or candles.
For instance, if a 10-day average of closing prices is desired, the prices for the last 10 days are added up and the total is divided by 10. The term ‘moving’ is used as only the latest 10 days prices are used in the calculation.
In this article, you’ll learn:
- Different types of Moving Averages
- Bollinger Bands
- The Weekly Rule
- Moving Averages applied to long term
- Moving Averages tied to cycles
Different Types of Moving Averages
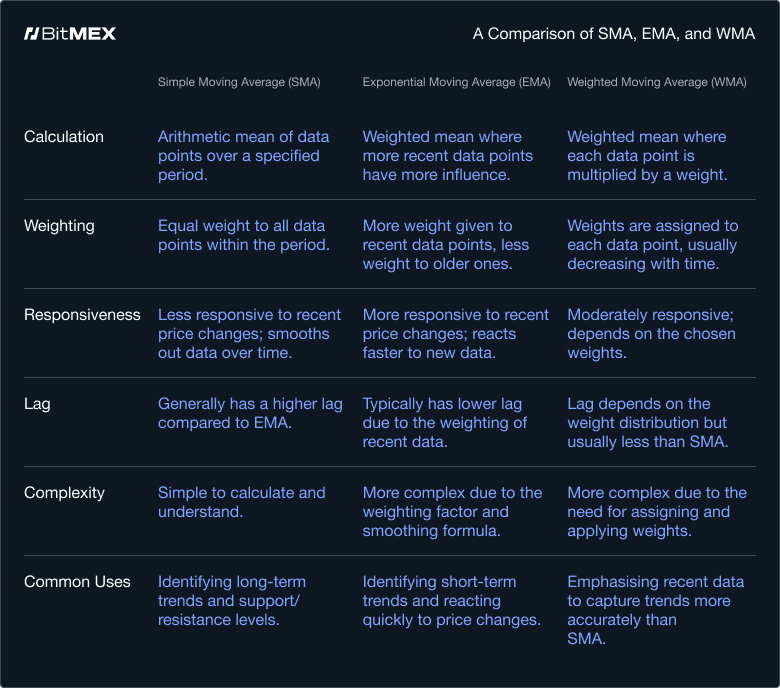
The Simple Moving Average (SMA)
The SMA calculates the average price of a cryptocurrency over a set period. SMA is calculated as:
SMA = (Sum of closing prices for a set number of periods) / (Number of periods)
The Exponentially Smoothed Moving Average (EMA)
EMA gives more weight to recent price changes, making it ideal for short-term trading. EMA is calculated as:
EMA = (Closing price - EMA previous day) x multiplier + EMA previous day
The Weighted Moving Average (WMA)
WMA focuses on recent prices by assigning more weight to them. You can calculate WMA for the last 20 candles with the following formula:
WMA = (Price1 x 20) + (Price2 x 19) + ... + (Price20 x 1) / 210
A Comparison of SMA, EMA, and WMA
How to Use Moving Averages to Boost Your Trading
- Support and resistance
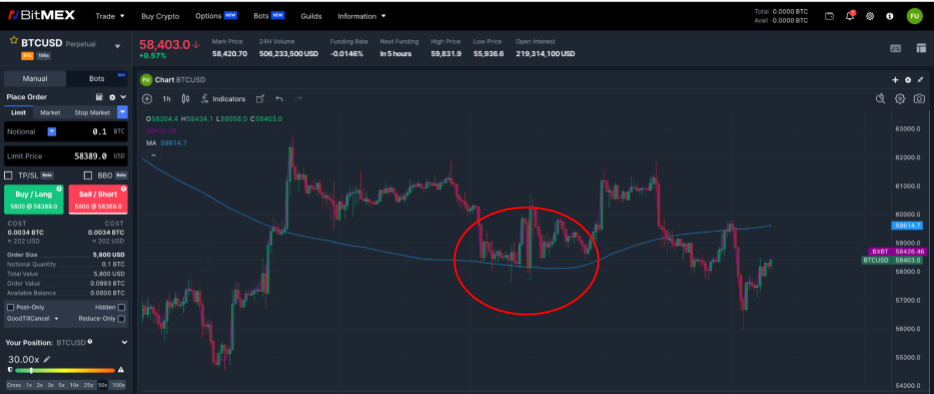
A moving average can act as a support level when the price is above the moving average. Traders often buy when the price dips to the moving average, expecting it to act as a floor.
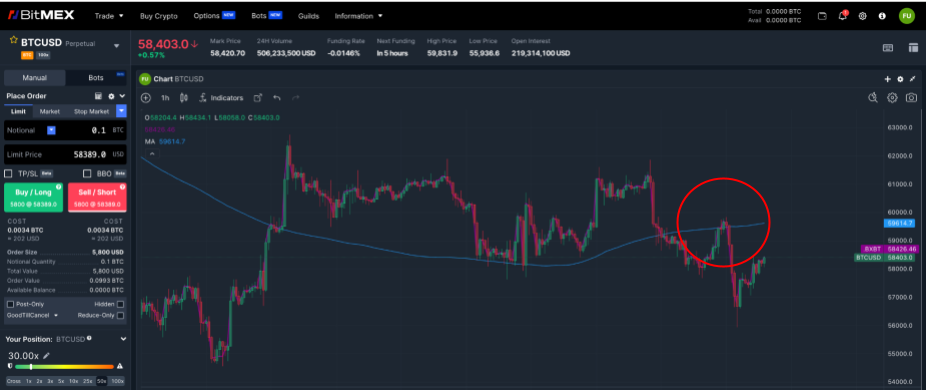
Conversely, a moving average can act as a resistance level when the price is below it. Traders may sell when the price rallies to the moving average, anticipating it will act as a ceiling.
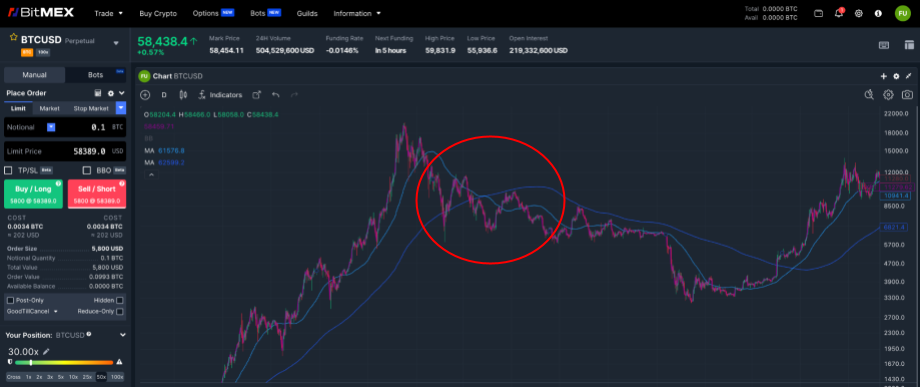
- Cross overs (e.g. Golden Cross 50 EMA crosses over the 200 SMA)
Moving average crossovers are popular signals for entering or exiting trades. A crossover occurs when a shorter-term moving average crosses over a longer-term moving average.
Golden Cross: This bullish signal occurs when a short-term moving average (e.g., 50 EMA) crosses above a long-term moving average (e.g., 200 SMA). It suggests the start of an uptrend.
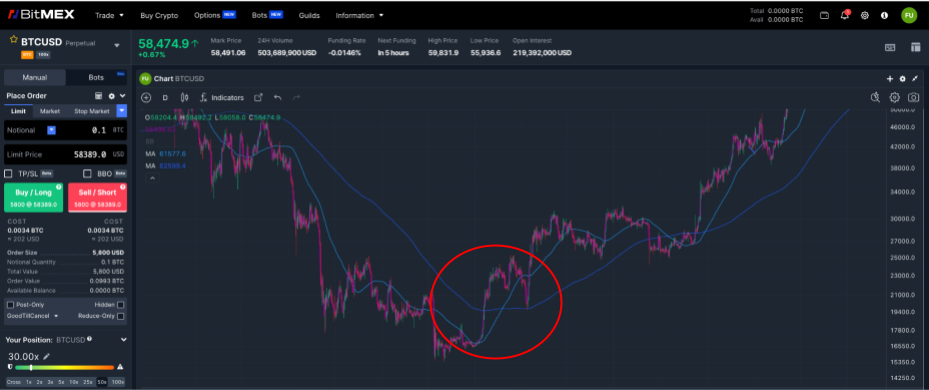
Death Cross: Opposite of the Golden Cross, this bearish signal occurs when a short-term moving average crosses below a long-term moving average. It suggests the start of a downtrend.
Theoreticals aside, if you wish to begin trading crypto derivatives or spot on BitMEX, you can find all our existing products here. For more educational resources on trading, visit this page.
To be the first to know about our new listings, product launches, giveaways and more, we invite you to join one of our online communities and connect with other traders. For the absolute latest, you can also follow us on Twitter, or read our blog and site announcements.