
In the world of trading, recognising key market patterns can determine the difference between whether you profit and loss. This is even more prudent in a volatile market like crypto.
In particular, there are market patterns which help signal market extremes, such as blowoff tops and selling climaxes. They are crucial indicators which can help advise one’s trading decisions at particular points in time, like when it’s time to buy or sell.
This article delves into each pattern, how to identify them, and ways to trade the indicators effectively.
What Are Blowoff Tops?
A blowoff top – often considered the “final frenzy” – is a phenomenon that occurs at the end of a significant upward trend. A blowoff top refers to a scenario where a sudden and sharp rise in prices is followed by a drastic decline.
You can see it as a red flag signal that tries to warn you to reconsider your positions and trading strategy. This pattern, often resulting from speculative trading, can signal the peak of an asset’s price (often preceding a market downturn), making it crucial for traders to recognise.
What makes blowoff tops particularly interesting in the context of futures trading, is the behaviour of open interest.
Characteristics of Blowoff Tops:
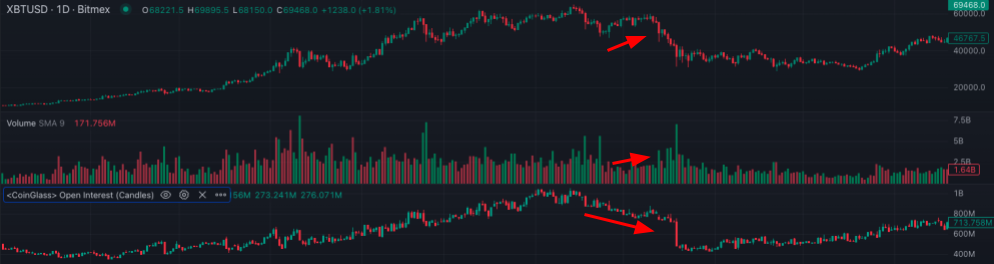
- Sharp Price Rally: After a prolonged period of price increase, the market suddenly experiences an even more rapid acceleration in price.
- Surge in Volume: This sharp rally is accompanied by a substantial increase in trading volume, indicating heightened market activity and participation.
- Drop in Open Interest: Despite the surge in volume, there is often a noticeable drop in open interest. This indicates that traders are closing out their positions, possibly taking profits or reducing exposure as the market reaches euphoric levels.
An Example of Blowoff Tops
To paint the scenario better, you can find an example of a blowoff top occurring in the context of trading charts, indicated by the red arrows.
How to Trade Blowoff Tops Effectively
The adage “time in the market precedes timing the market” rings true, as attempting to time the market (especially when using leverage), can easily backfire.
However, successfully trading blowoff tops demands a well-crafted strategy and a deep understanding of market dynamics.
The first step is to identify the blowoff top using technical indicators and chart patterns as mentioned above. Once identified, traders should look for confirmation through other tools like trend analysis and trading volume.
Risk Management and Caveats for Trading Blowoff Tops
While trading blowoff tops can be profitable, it comes with its own set of risks, as they’re often the result of speculative trading, which makes them highly volatile and unpredictable.
Which is why risk management strategies like setting Stop Loss orders are crucial when trading such patterns.
Moreover, blowoff tops can be influenced by a range of factors, including market news and economic indicators. So traders should always do their due diligence and not rely solely on chart patterns.
What are Selling Climaxes?
At the opposite end of the spectrum, a selling climax occurs at the end of a prolonged downtrend. A selling climax refers to a sharp and rapid decline in price, accompanies by heavy trading activity.
Characteristics of Selling Climaxes:
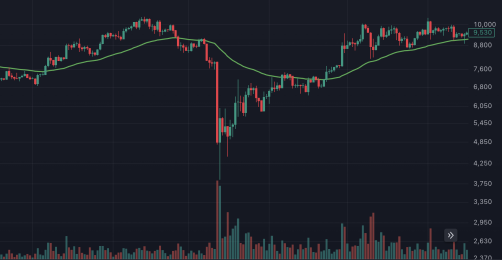
- Sharp Price Decline: After a long downtrend, prices suddenly drop further rapidly.
- Heavy Volume: The decline is accompanied by a significant increase in trading volume, indicating panic selling and capitulation among traders.
- Swift Rebound: Following the sharp decline, prices often rebound quickly as the panic subsides and buying interest returns.
An Example of Selling Climaxes
To paint the scenario better, you can find an example of a blowoff top occurring in the context of trading charts, as shown below.
How to Trade Selling Climaxes Effectively
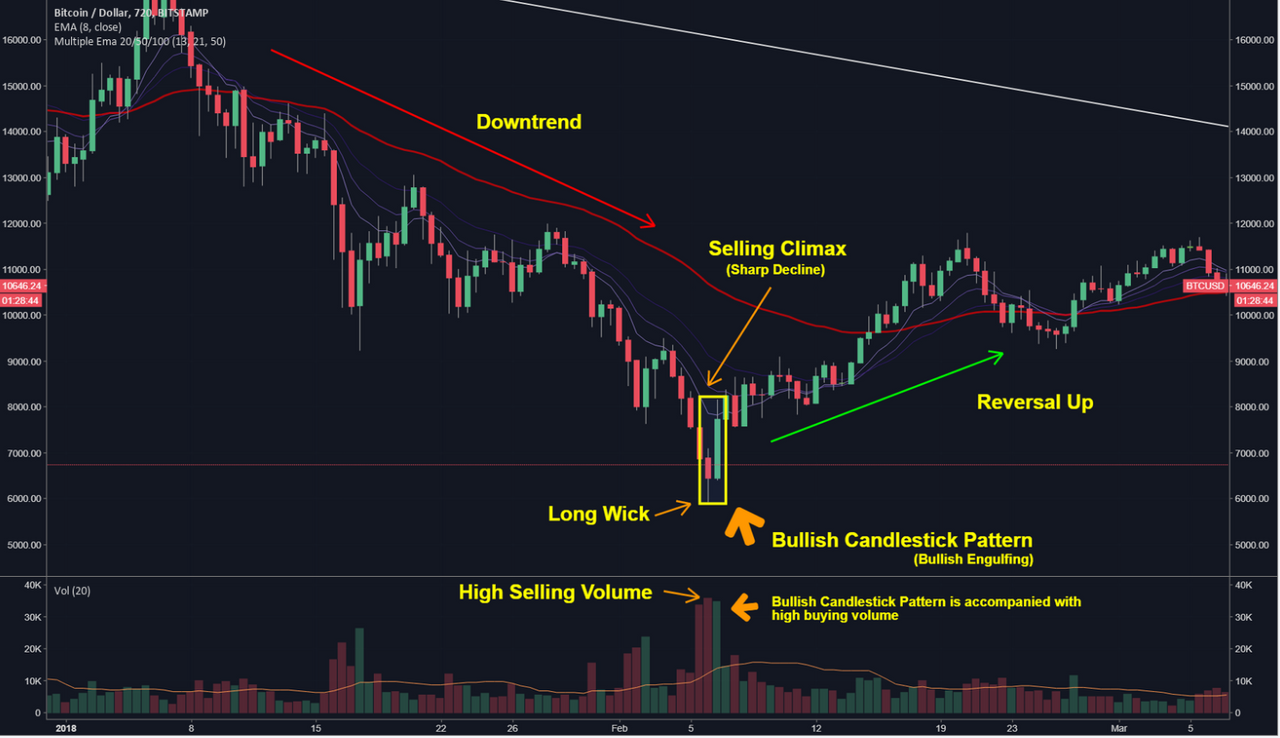
When the market is cascading downwards, it’s important not to catch a falling knife without any signals that confirms signs of reversal.
The general strategy for selling climax is to wait until ‘smart money’ enters the market with expanded buying volume and prints a high volume bullish candlestick.
The first step is to identify the preconditions outlined above using indicators and chart patterns. The appearance of specific bullish candlestick patterns, especially when accompanied by high buying volume, can confirm an uptrend:
- Hammer: A candlestick with a small body and long lower wick, indicating a potential reversal.
- Engulfing: A bullish engulfing pattern where a small bearish candle is followed by a larger bullish candle that completely engulfs the previous candle.
- Tweezer Bottoms: Two or more candles with similar low prices, suggesting a potential reversal.
- Dragonfly Doji: A candlestick with a long lower wick and no upper wick, indicating potential bullish reversal.
Theoreticals aside, if you wish to begin trading crypto derivatives or spot on BitMEX, you can find all our existing products here. For more educational resources on trading, visit this page.
To be the first to know about our new listings, product launches, giveaways and more, we invite you to join one of our online communities and connect with other traders. For the absolute latest, you can also follow us on Twitter, or read our blog and site announcements.