
As a beginner crypto trader, navigating trading charts can be overwhelming – especially given the countless techniques and tools available.
Before diving into the technical aspects, it’s essential to understand what technical analysis is, why it’s important for trading success, and how it’s different from fundamental analysis.
What is Technical Analysis?
Technical analysis is the study of market action, primarily through the use of charts, to forecast future price trends. It rests on three fundamental principles:
- Market action discounts everything
- Prices move in trends
- History repeats itself
#1: Market action discounts everything
This principle is the cornerstone of technical analysis. It posits that all factors affecting the price—whether fundamental, political, or psychological—are already reflected in market prices. In essence, price action mirrors shifts in supply and demand. For example, if supply exceeds demand, prices should fall. Charts do not cause market movements; they simply reflect the bullish and bearish psychology of the marketplace.
You might wonder what distinguishes a technician from a chartist, as both use technical analysis:
- Chartist: A chartist is someone who uses charts to identify patterns and trends in price movements. Chartists rely on technical analysis to make trading decisions and often use a variety of technical indicators to help them predict future price movements.
- Technician: A technician is someone who focuses on the technical aspects of trading, including chart analysis, market trends, and technical indicators. Technicians often use computer programs and trading software to help them analyze price movements and make trading decisions.
As a rule, chartists do not concern themselves with the reasons why price rise or fall.
#2: Price moves in trends
The whole purpose of charting the price action of a market is to identify trends in early stages to make a directional trade. There is a corollary to the premise that prices move in trends—a trend in motion is more likely to continue than to reverse. This corollary is, of course, an adaptation of Newton’s first law of motion.
Another way to state this corollary is that a trend in motion will continue in the same direction until it reverses. This is another one of those technical claims that seems almost circular. But the entire trend-following approach is predicated on riding an existing trend until it shows signs of reversing.
#3: History repeats itself
A significant part of technical analysis involves studying human psychology, which tends to remain constant over time. The idea is that patterns and behaviours that worked well in the past are likely to work well in the future. Understanding the past helps predict future market movements.
A common example of history repeating itself is seen in Bitcoin cycles, such as pre-halving rallies followed by post-halving reaccumulation and subsequent rallies.
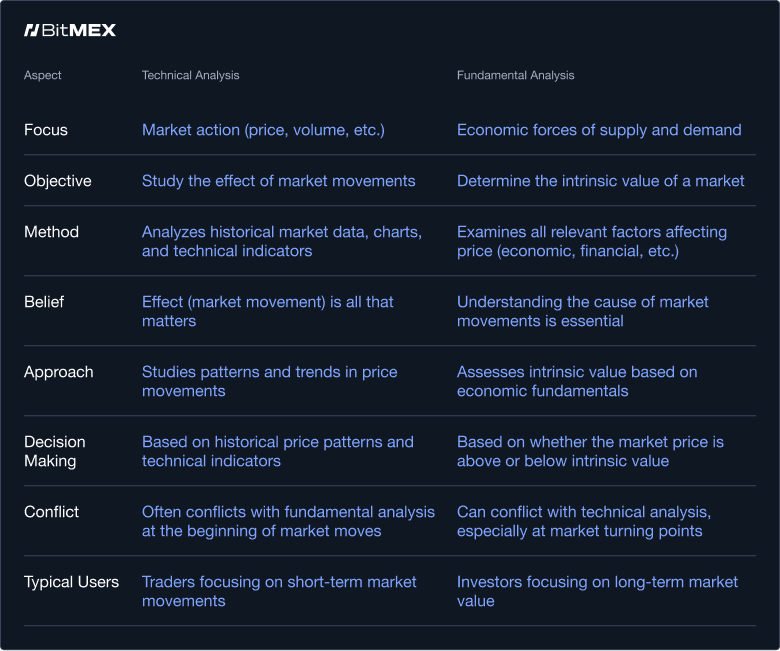
Technical Analysis vs Fundamental Analysis
Both approaches to market forecasting attempt to solve the same problem – that is, to determine the direction prices are likely going to move. However, they approach the analysis from different perspectives. Here is a table to breakdown their main differences:
Theoreticals aside, if you wish to begin trading crypto derivatives or spot on BitMEX, you can find all our existing products here. For more educational resources on trading, visit this page.
To be the first to know about our new listings, product launches, giveaways and more, we invite you to join one of our online communities and connect with other traders. For the absolute latest, you can also follow us on Twitter, or read our blog and site announcements.