 This article is part of our new series of crypto research content, produced by Bitcoin Magazine team and sponsored by BitMEX. To learn more about our wide-ranging partnership with Bitcoin Magazine, click here.
ETH In BTC Terms Looks Done
In this Bitcoin Magazine piece, we wanted to cover some of the most important charts we’re looking at right now and what they tell us.
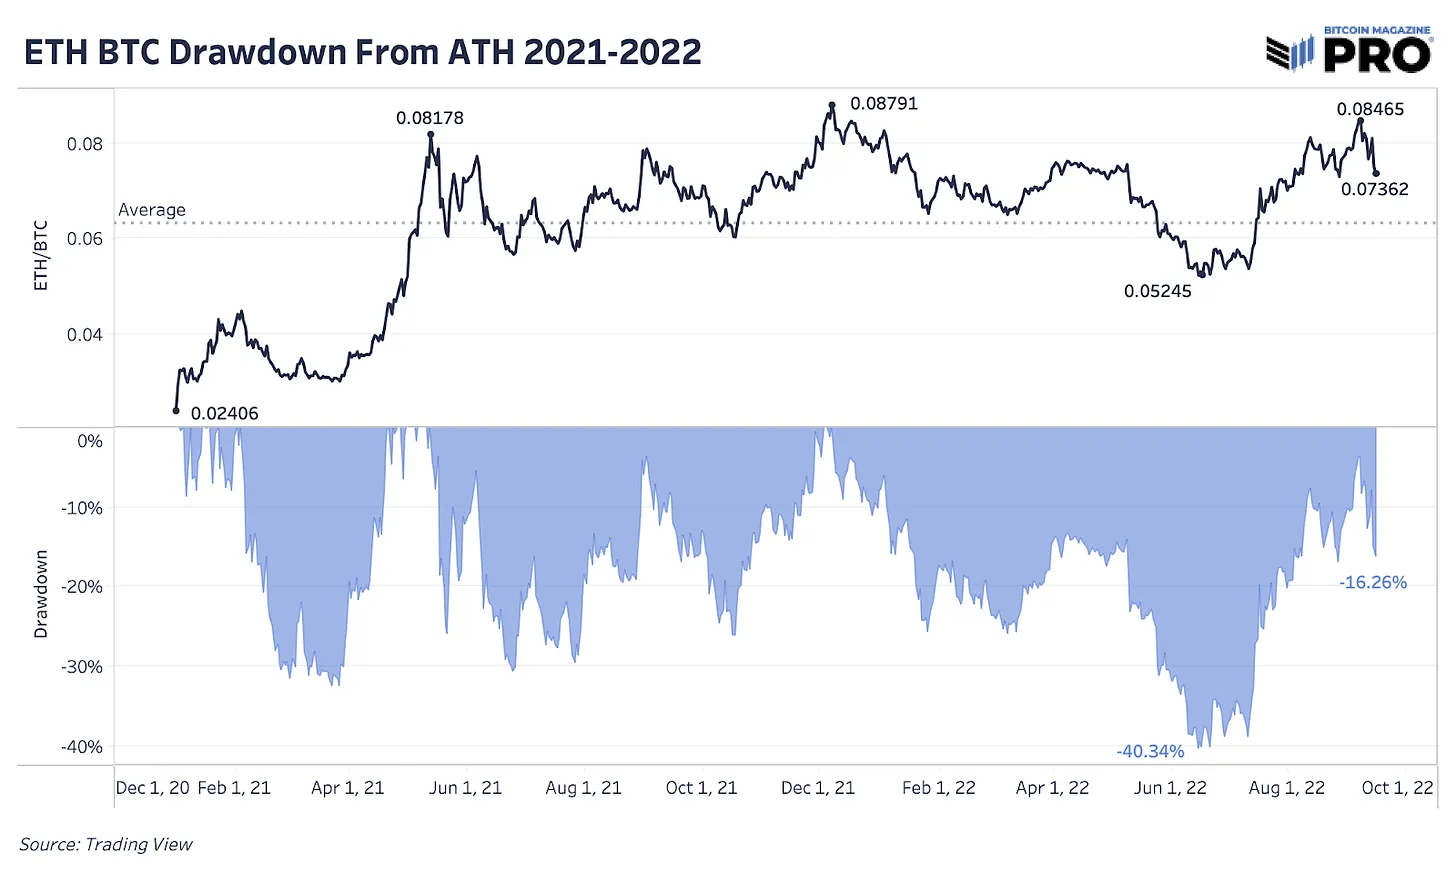
On the bitcoin front, let’s take a look at how ethereum’s price is holding up in bitcoin terms. As Bitcoin Magazine has highlighted before in their thesis, they don’t find these to be an equal comparison whatsoever but relative price does help them gauge speculative sentiment right now in the broader market. The speculation on what ether is and what it might become during this Merge event is now unwinding. Its price unwinds with it. ETH failing to break new local all-time highs in bitcoin terms after a successful and incredibly difficult technical feat is not a promising sign.
Ethereum speculation has also led to a wave of alternative cryptocurrency speculation across the board in hopes of a bullish cycle reversal that’s due for another unwind short term. These are not assets the market wants to own in a global recession.
If you haven’t yet signed up for a BitMEX account, you can do so here.
FedEx Crashes Leading Q3 Earnings
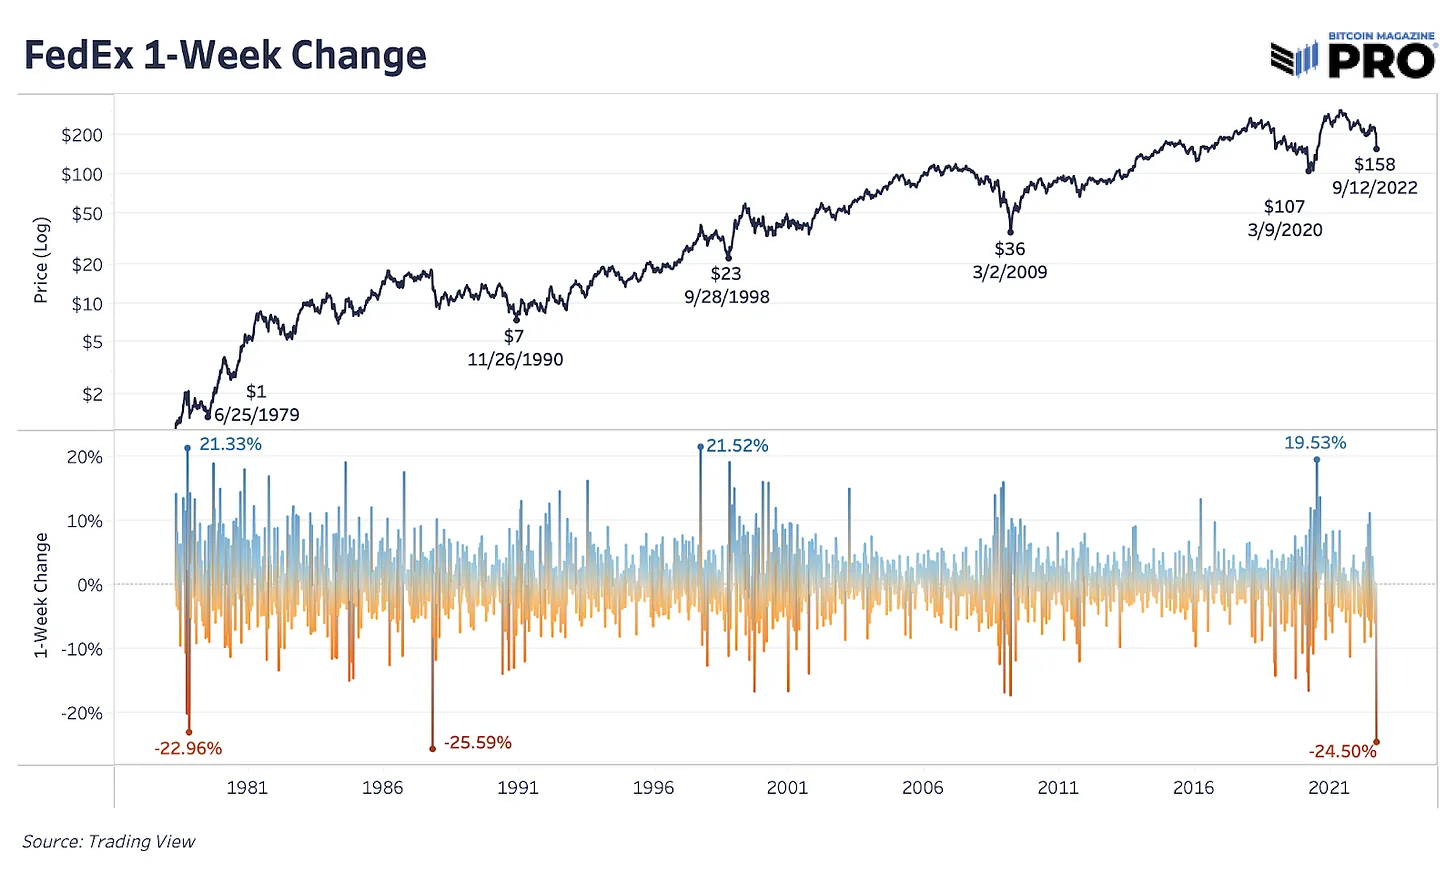
FedEx, a bellwether for economic conditions, had one of the largest earnings misses in history last week with the CEO highlighting expectations for a global recession to play out. The stock price saw its largest 1-day loss on record and one of its largest weekly changes ever, a 24.5% decline. Massive misses to earnings playing out in the second half of this year has been a trend Bitcoin Magazine has highlighted before as conditions worsen.
A wave of Q3 earnings reports will hit the market the week of September 26 providing updates on how inflation and wage growth has affected margins while noting layoff plans. There’s many ways to look at a pending decline in earnings per share to worsen: the rate of change in the U.S. dollar (DXY) is one of them. Analysts are still projecting 3.7% earnings growth for the S&P 500 Index in Q3 from an estimate that was over 9% in July. Even if 3.7% happens, it would be the lowest earnings growth rate since Q3 2020. Last point, data from the Institute for Supply Management (ISM) has historically led to large surprises in earnings per share surprise declines.
FedEx destroyed after hours following a huge earnings miss. The massive miss from the shipping giant reads like a sign of whats to come. $FDX -15.4% pic.twitter.com/HiEPS9V2oj
— Dylan LeClair 🟠 (@DylanLeClair_) September 15, 2022
Treasury Curve Tells All
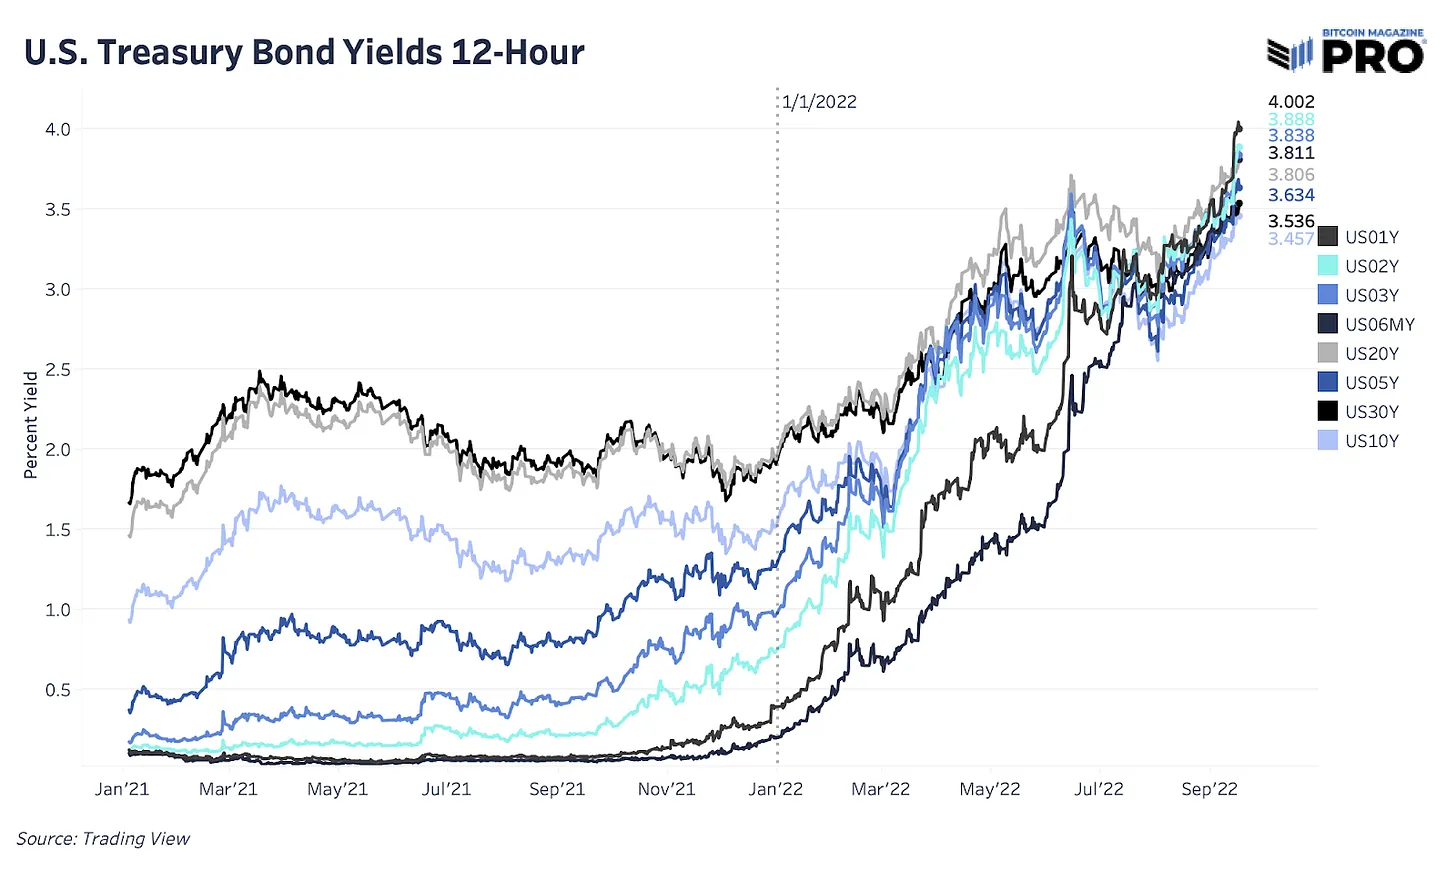
The 1-year Treasury bond hitting over 4% was unthinkable for most of last year and is a sign that something larger in the market is ready to break. The entire curve has flattened and inverted across durations showing the market’s demand and expectations for higher rates in one of the worst-performing years for U.S. government debt in history. The bond market no longer seems to doubt the Federal Reserve’s path to higher rate hikes. September’s Federal Open Market Committee (FOMC) meeting will likely be a 75 basis points rate hike but the markets have to price in the small, yet rising, probability of a 100 bps move.
It’s All One Trade
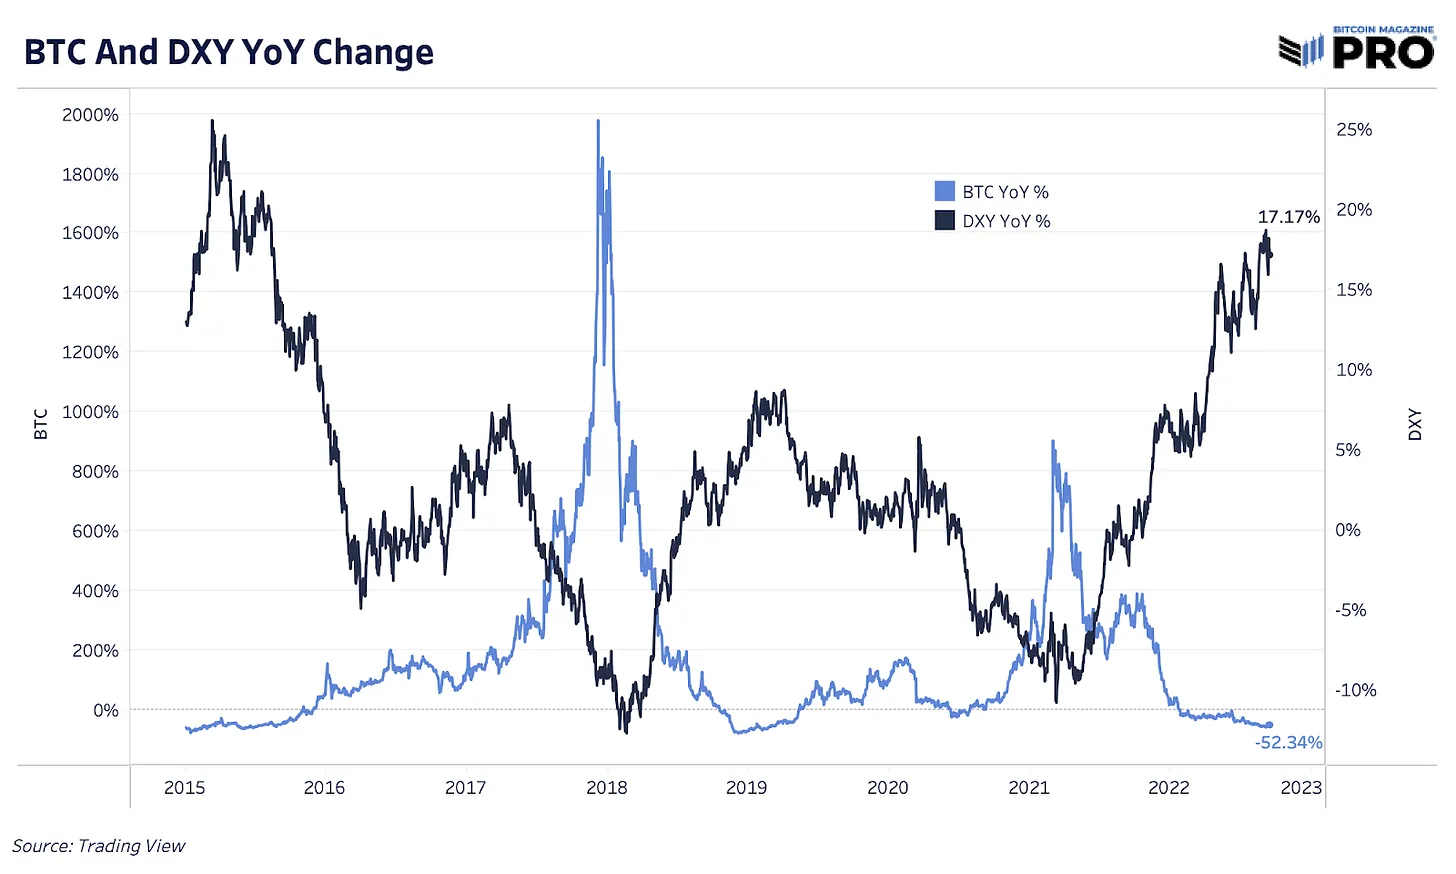
This year and this cycle has been about the U.S. dollar. Either you have dollars or you are short and there’s not enough dollars to go around when liquidity keeps drying up. The continued fall of foreign currencies relative to the dollar continues, especially as interest rates rise and the borrowing costs at large rise with it. People don’t have the purchasing power to service the U.S. dollar-denominated interest or have the capacity to refinance at higher rates.
Everything relative to the U.S. dollar is losing, even if monetary debasement and inflation continues on. Bitcoin, like every major asset in the world, is not immune to this trend. Although we look close to the U.S. dollar strength topping out soon, market participants have to ask what is going to slow it down? Continued Federal Reserve monetary tightening while the euro and yen face energy and yield curve control pressures is not a trend to jump in front of.
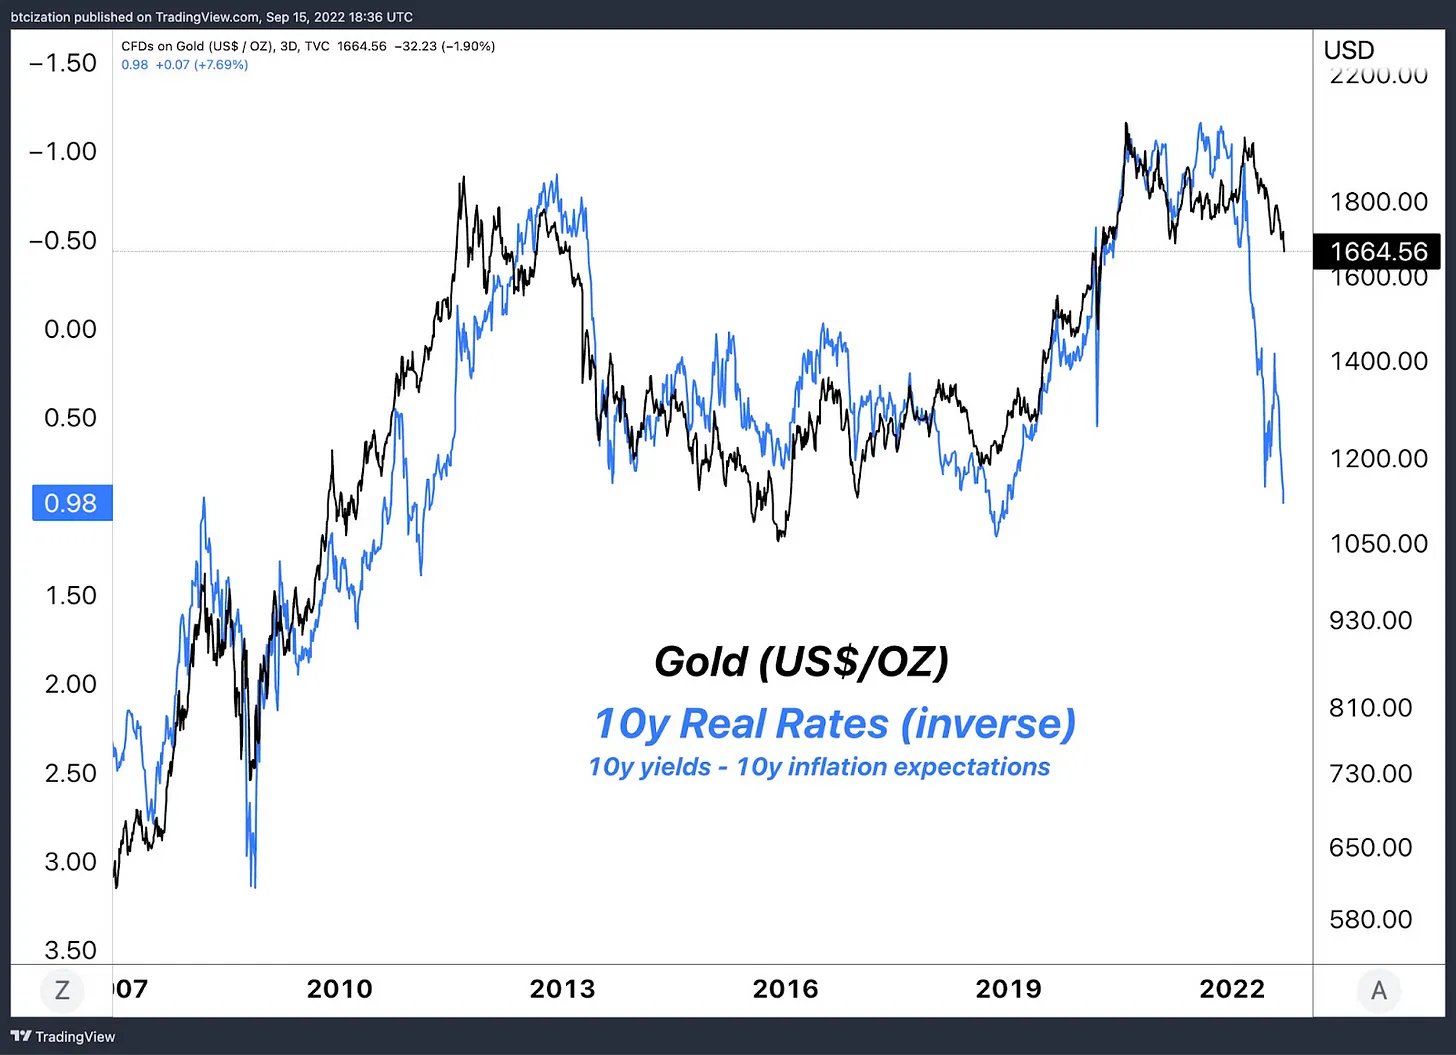
Gold Getting Crushed
The correlation between inverse real yields (10-year Treasury yields less 10-year inflation expectations) and gold lives on. As real yields continue to rise with the 10-year yield flying higher and long-term inflation expectations slightly coming down, gold looks primed to fall further. This macro relationship has held up historically during deteriorating economic conditions and we continue to see it playing out.
Even with record levels of inflation and monetary debasement, gold failing right now to act as a monetary hedge is yet another sign of how strong the macroeconomic trends are.
 To be the first to know about our contracts, new listings, product launches, and giveaways, you can connect with us on Discord, Telegram, and Twitter. We encourage you to also check our blog regularly and subscribe to the Bitcoin Magazine Pro newsletter.
In the meantime, if you have any questions please contact Support.