
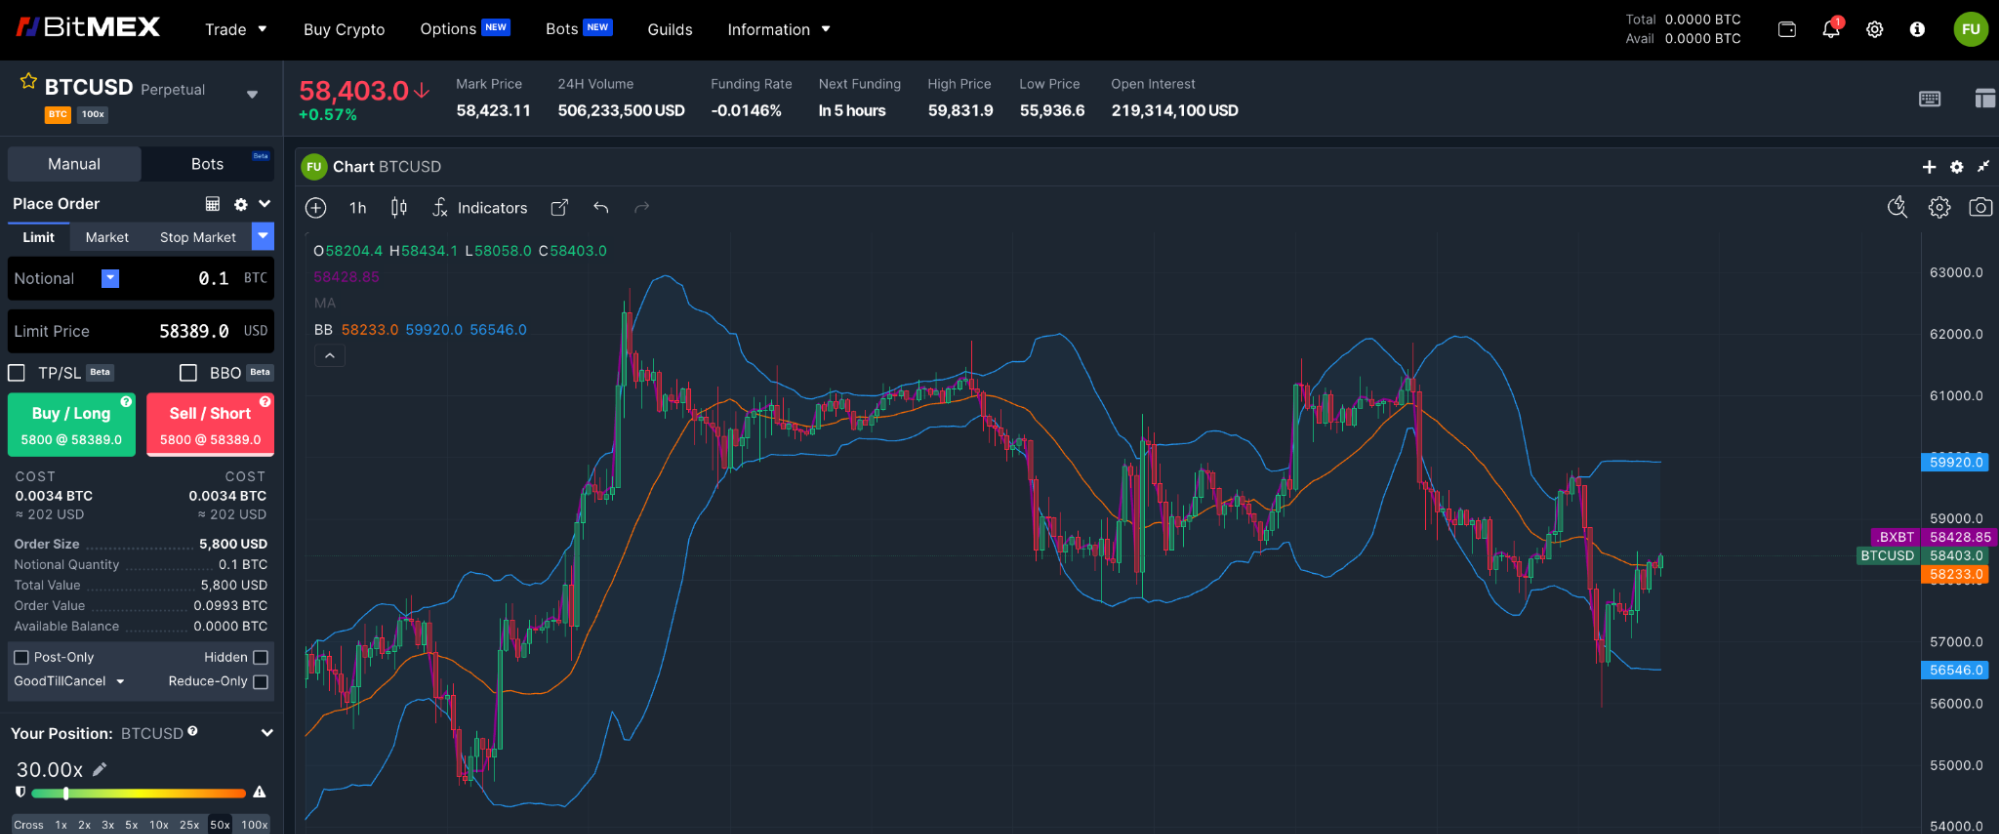
What Are Bollinger Bands?
Bollinger Bands are a popular tool in technical analysis used to measure market volatility and identify potential price trends. Created by John Bollinger in the 1980s, this tool consists of three bands:
- Middle Band: A moving average (typically 20 days)
- Upper Band: Two standard deviations above the middle band
- Lower Band: Two standard deviations below the middle band
Purpose and History
John Bollinger developed this tool to help traders gauge market volatility and spot potential trend reversals. By plotting a moving average and adding bands based on price fluctuations (standard deviations), traders can see a price range where the asset is likely to move.
How Bollinger Bands Can Boost Your Crypto Trading
In the volatile world of cryptocurrencies, prices can change rapidly. Bollinger Bands provide a visual way to understand this volatility and helps traders identify when an asset might be overbought or oversold, signaling possible trend reversals or breakouts.
How to Calculate Bollinger Bands
- Calculate the Middle Band:
- Compute the 20-day simple moving average (SMA) of closing prices.
- Determine the Standard Deviation:
- Find the differences between each closing price and the SMA.
- Square these differences, average them, and take the square root to get the standard deviation.
- Calculate the Upper and Lower Bands:
- Multiply the standard deviation by two.
- Add this result to the Middle Band to get the Upper Band.
- Subtract this result from the Middle Band to get the Lower Band.
To summarise the above formula:
- Middle Band = 20-day SMA
- Upper Band = Middle Band + (2 × 20-day Standard Deviation)
- Lower Band = Middle Band – (2 × 20-day Standard Deviation)
How to Interpret Bollinger Bands
- Price movements: When prices touch or exceed the Upper Band, it might indicate overbought conditions; touching or falling below the Lower Band may signal oversold conditions.
- Trend reversals: Consistent touching of the bands can suggest a trend reversal or breakout.
- Confirmation with other indicators: Combine Bollinger Bands with other tools like RSI or MACD for more accurate signals.
Tips for Crypto Trading with Bollinger Bands
- Adjust your time frames: The standard 20-day setting may not fit all trading time frames. Adjust the periods based on your trading strategy.
- Set parameters accordingly: Different cryptocurrencies have varying volatilities. Modify the standard deviation as needed.
- Use them with caution: Don’t rely solely on Bollinger Bands. Complement them with other indicators and consider the overall market conditions.
Bollinger Bands can be a powerful tool for identifying price trends and potential reversals. By understanding and correctly applying them, traders can make more informed decisions in the dynamic crypto market.
Theoreticals aside, if you wish to begin trading crypto derivatives or spot on BitMEX, you can find all our existing products here. For more educational resources on trading, visit this page.
To be the first to know about our new listings, product launches, giveaways and more, we invite you to join one of our online communities and connect with other traders. For the absolute latest, you can also follow us on Twitter, or read our blog and site announcements.