
Abstract: BitMEX Research is delighted to announce the launch of a new website to monitor the Ethereum network, Nodestats.org. The website connects to five different Ethereum nodes and collects data every five seconds. The main focus of the website is providing metrics related to the computational resources each Ethereum node requires. While analysing some of the metrics, we may have identified issues with respect to the integrity of the data reported by the nodes, which may be of concern to some Ethereum users. Nodestats.org was produced in collaboration with TokenAnalyst, who are BitMEX Research’s Ethereum network data and analysis partner.
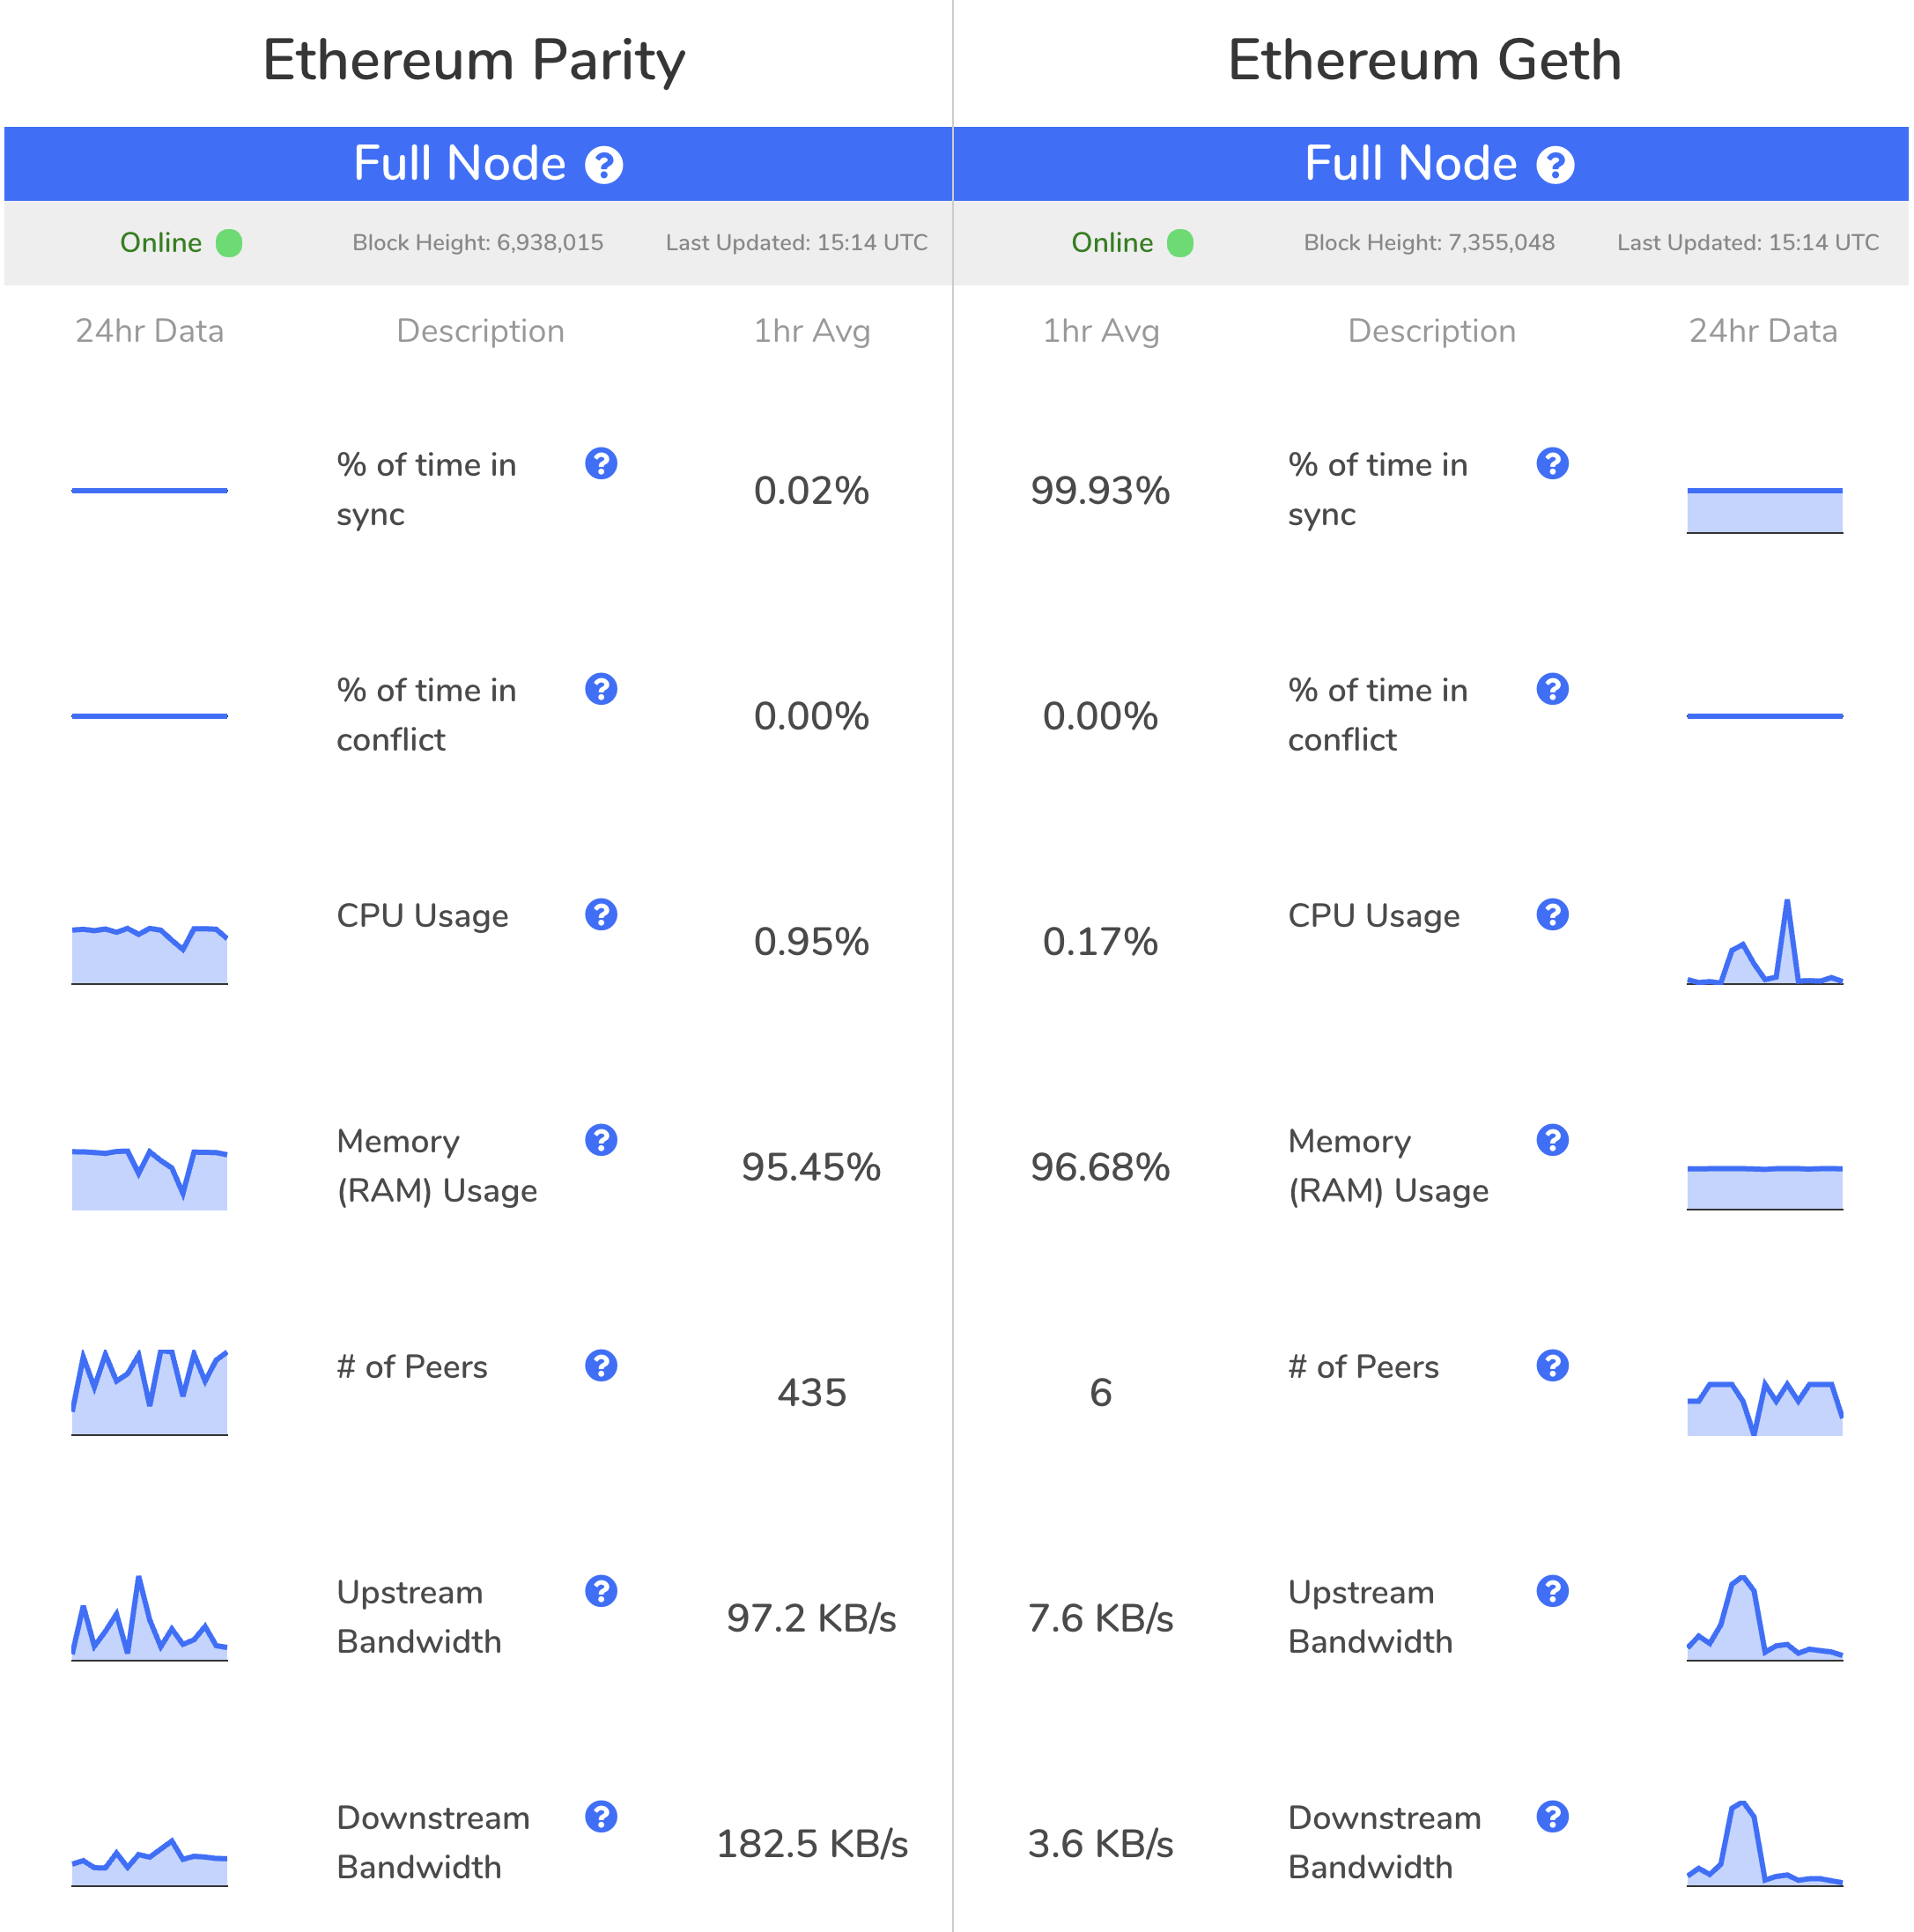
(Screenshot of website as at 12 March 2019)
Overview
Nodestats.org compares the statistics of the two largest Ethereum node client implementations by overall adoption – Geth and Parity. Within these client implementations, Nodestats.org compares the performance of different node configurations – fast, full, and archive nodes.
The main purpose of Nodestats.org is as follows:
- To provide metrics comparing the computational efficiency of the different Ethereum implementations. For instance by comparing requirements related to:
- CPU usage
- Memory (RAM)
- Bandwidth
- Storage space
- To compare the resource requirements between running Ethereum node software and that of other coins, such as Bitcoin
- To evaluate the strength of the Ethereum P2P network and transaction processing speed, by looking at metrics related to whether the nodes have processed blocks fast enough to be at the chain tip or whether poor block propagation results in nodes being out of sync for a significant proportion of the time
Nodestats.org began collecting data at the start of March 2019 and it is too early to draw any firm conclusions. However, we are saving the data and hope to analyse the long term trends at a later point. The Nodestats.org data is produced by querying our five Ethereum nodes or machines running the nodes, every five seconds (720 times per hour) and then storing the results in a database. Various rolling averages and other metrics produced from this data, are displayed on the Nodestats.org website.
Description of the Nodestats metrics
| Name | Description | Initial findings |
| % of time in sync |
This represents the percentage of time the node has verified and downloaded all the block data, up what the P2P network is informing the node is the chain tip. The hourly metric is calculated by determining if the node is at the tip every 5 seconds, which should be 720 queries per hour. The proportion of these queries where the node says it is at the tip is the reported metric. This field is based on the web3 “isSyncing” field, which we believe uses the highest block the node has seen, the “highestBlock” field, to determine if the node is behind what its peers regard as the highest block ever seen. |
Nodes typically report they are at the tip around 99.8% of the time, which means that in only around 1 of the 720 hourly queries are the nodes not at the chain tip. The only exception here is the Ethereum Parity full node, which we talk about later in this report. We believe the data integrity of this metric is poor, for instance in the case of the Parity full node the integrity of the information provided is weak, as we explain later in this report. Going forwards we aim to establish a more effective way of calculating this metric. |
| % of time on conflicting chain | This represents the percentage of time the node is following a different or conflicting chain to the node opposite it on the website. This is determined by storing all the block hashes in our database, if the nodes have a different block hash at the same height, they are considered to be on different chains. |
Typically Nodestats.org is not able to identify times when the clients are following different chains. As such this metric is normally 0%. (i.e. 0 times out of 720 in a one hour period) |
| CPU Usage | This represents the average percentage utilization of the machine’s CPU resources. All the machines Nodestats.org are using have the “Xeon(R) CPU E5-2686 @ 2.30GHz” processing unit with two cores. The exception to this is the archive node, which has 16 cores. All the nodes are using the AWS “i3.large” machines, with the exception of the archive node, which is running “i3.4xlarge”. |
Generally speaking, CPU usage tends to be between 0.01% and 1.0%. Parity tends to be towards the 1% level, while Geth appears to use less CPU power. Geth’s CPU usage appears less stable than Parity’s, with Geth’s CPU demand occasionally spiking to around the 1% level. |
| Memory Usage | Nodestats.org takes a reading from the machines every 5 seconds, related to how much memory is being utilized by the Ethereum client. All the machines Nodestats.org are using have 14GB of Ram, with the exception of the archive node, which is a 120GB of Ram machine. | Generally speaking, however much RAM is available, the nodes use up the overwhelming majority of it (e.g. over 95%). The memory demands of the clients appear to be reasonably stable. |
| Peer count | The node provides Nodestats.org with the number of network peers, every 5 seconds. | Parity tends to have around 450 peers, while Geth only has around 8. Geth’s peer count is more volatile than Parity, as it appears to occasionally fall to around 6. |
| Upstream bandwidth | Nodestats.org takes a reading from the machine every 5 seconds, related to the total network upstream bandwidth of the server. | Parity, which has more peers, tends to use over 100KB/s of bandwidth (in each direction). In contrast Geth tends to only use around 4KB/s of bandwidth. Geth’s bandwidth demand tends to be more volatile than Parity, with occasional spikes to around 60KB/s. |
| Downstream bandwidth | Nodestats.org takes a reading from the machine every 5 seconds, related to the total network downstream bandwidth of the server. | |
| Chain data size | This metric represents the total data utilized by all the directories dedicated to the client. Unlike the other metrics, the disclosed figure is the absolute value, not a rolling 1 hour average. | Currently, Parity requires around 180GB, Geth uses just under 200GB, and the full archive node uses up 2.36TB of data. |
The Parity full node is still syncing
The Parity full node was started on 1 March 2019, at the time of writing (12 March 2019) it has still not fully synced with the Ethereum chain. The client is around 450,000 blocks behind, and based on its current trajectory, it should catch up with the main chain tip in a few days. Due to the slow initial sync, the “% of time in sync” metric is shown as near 0%, as the client is never in sync.
The Ethereum Parity Full node machine has the following specifications:
- Dual Core 2.3GHz
- 14GB of RAM
- SSD storage
- 10 Gb/s internet connection
The fact that a machine with the above specification takes over 12 days to sync may indicate that it is the initial sync issues could be a greater concern for the Ethereum network than post sync issues, such as block propagation. While the slow initial sync is a potential problem, at least for this system setup, Ethereum has not yet reached a point where the node cannot catch up, as the sync is faster than the rate of blockchain growth.
Data integrity issues
The Parity full node also sometimes reports that it is in sync, despite being several hundred thousand blocks behind the chain tip. For instance in the screenshot at the start of this piece, the website reports that the node is fully synced 0.02% of the time, indicating the node falsely thought it was at the tip for some periods of time.
As the chart generated from the Parity full node logs below illustrates, the highest block seen on the network figure, in blue, appears potentially incorrect. The highest block number seen on the network figure, sometimes falls in value as time progresses and has remained consistently well behind the actual chain tip (shown in green). On occasion this potentially buggy figure fell towards the height of the verified chain (orange) and our website incorrectly reports the node as in sync. This may be of concern to some Ethereum users, since the Parity full node has many connections to the network, therefore this may be a bug.
Ethereum Parity Full Node Block Height Data – 11 and 12 March 2019 (UTC)
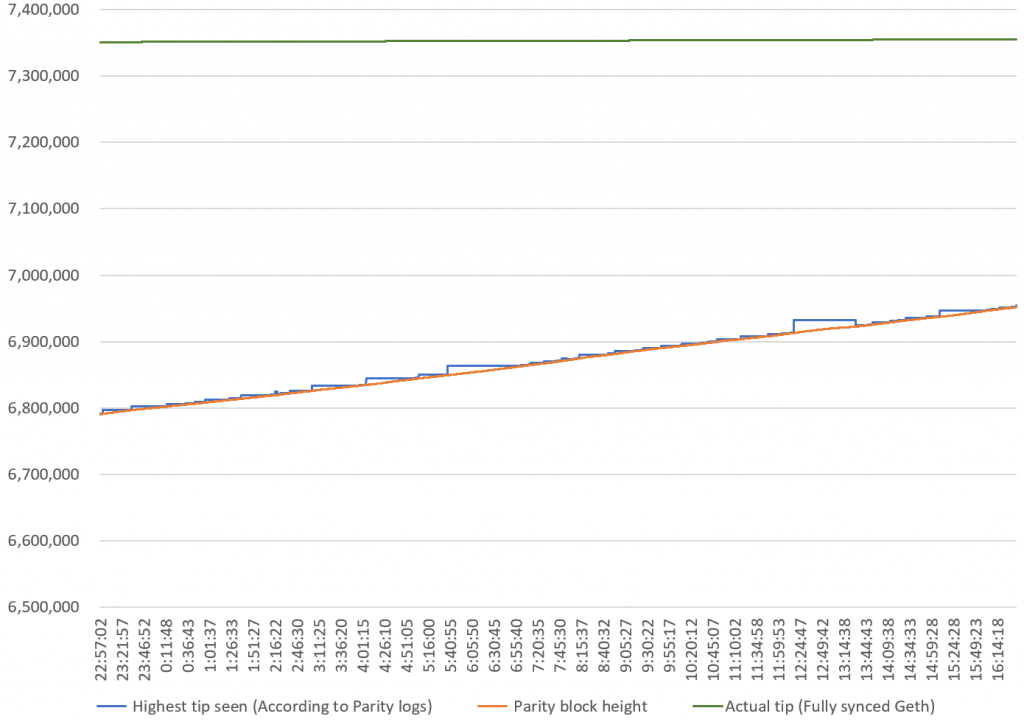
(Source: Ethereum Parity full node logs)
This potential bug could undermine this whole metric for our website, even for the other nodes, as the highest tip seen field may not function appropriately and our figures may be inaccurate. However, we continue to include this metric, since the Nodestats.org website displays the data reported by the nodes, regardless of our view on the integrity of the data. We may look to implement our own improved metric in the future.
One could argue the impact of this potential bug could be severe in some limited circumstances, if exploited by an attacker in the right way. For example a user could accept an incoming payment or smart contract execution as verified, while their node claims to be at the network chain tip. However, the client may not really be at the chain tip and an attacker could exploit this to trick the recipient into delivering a good or service. The attacker would need to double spend at a height the vulnerable node wrongly thought was the chain tip, which could have a lower proof of work requirement than the main chain tip. Although successful execution of this attack is highly unlikely and users are not likely to be using the highest seen block feature anyway.
Conclusion
Like its sister website, Forkmonitor.info, Nodestats.org is very much a work in progress. Along with TokenAnalyst, over the coming months and years, we plan to add more features, such as:
- Improving the integrity of the data, by being less reliant on what the nodes report and developing our own calculation methodologies
- Charts & tools for analysing longer term trends
- Improved granularity of the data
- Fork detection systems
- Data related to other peers
For now, Nodestats.org provides a useful tool to assess the approximate system requirements for running Ethereum nodes. At at a very basic level, it also provides mechanisms to assess the reliability of the Ethereum network and its various software implementations. However, we accept that the “% of time in sync” metric may not be reliable, but it does highlight a potential issue.