This article serves looks at bearish candlesticks and how they can be a warning sign for market performance.
To know more, you can also read up on; the basics of chart patterns, a guide to continuation patterns, the roles of triangles, trading cups and shoulders articles. We have also published an introduction to candlesticks, bullish candlesticks and neutral candlesticks.
Bearish
Hanging Man
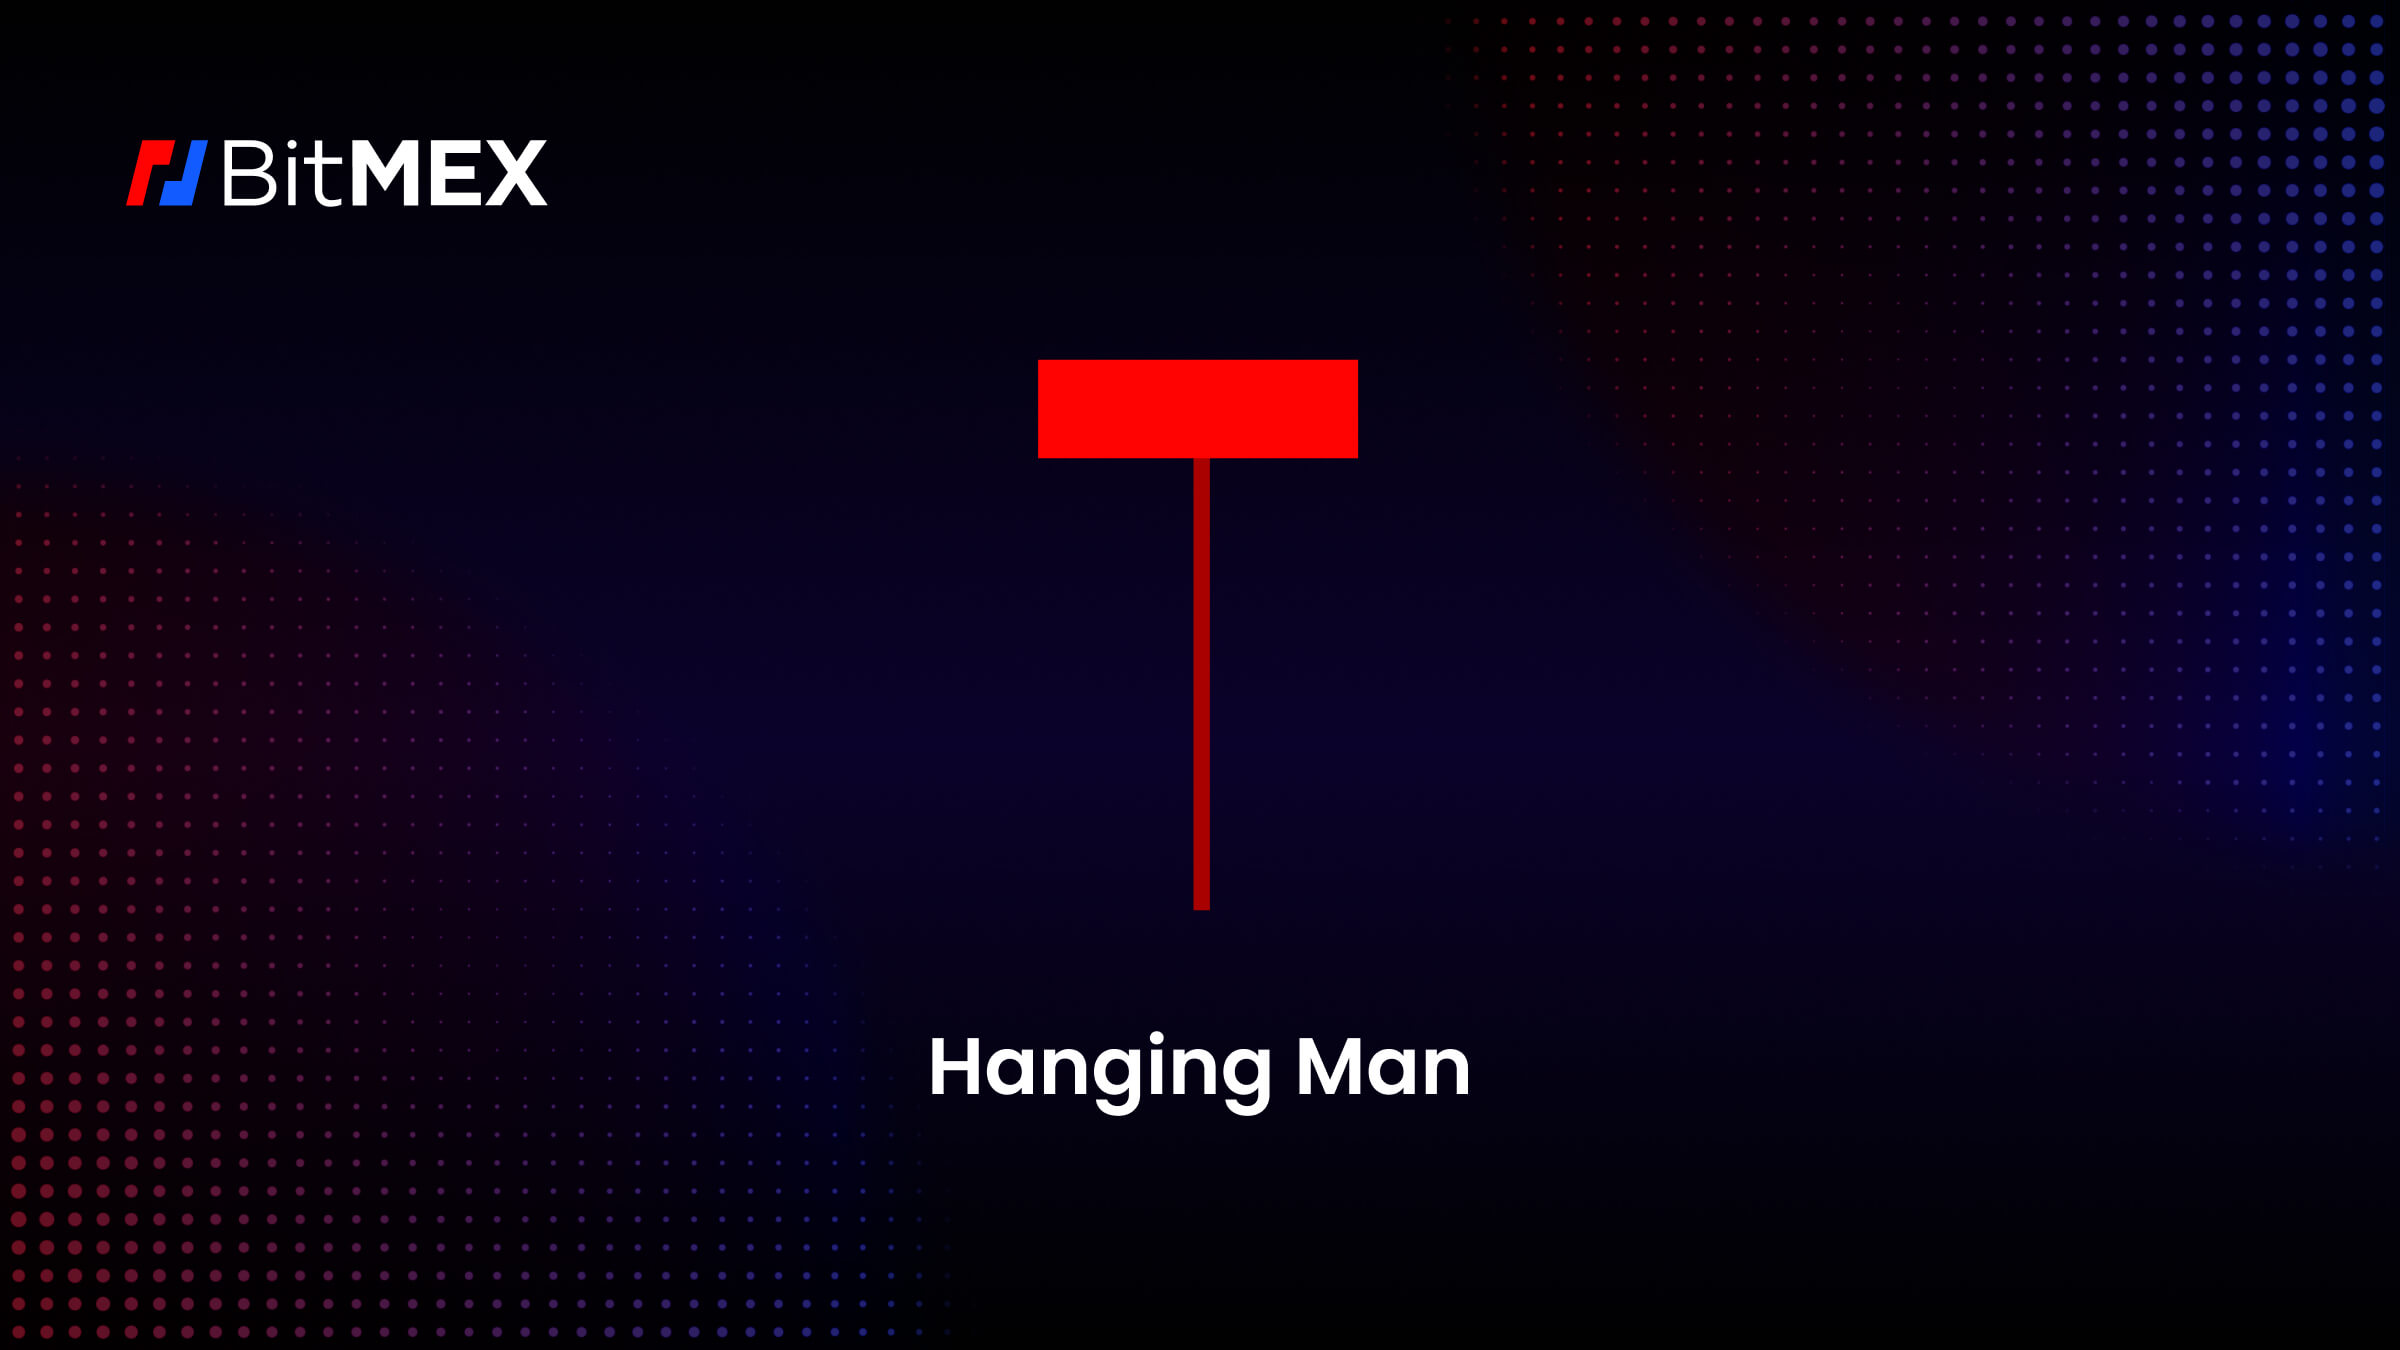
A Hanging Man is a bearish candlestick pattern that develops during an uptrend, signalling probable weakness since it signals a market reversal is imminent, especially if confirmed by following price action.
What are the Indicators of a Hanging Man Pattern?
- Seek out a candlestick that is red and small only.
- Validate that the first candlestick has shadows with different lengths: the lower shadow is longer while there is little to no upper shadow.
How to Interpret the Hanging Man Pattern?
The candlestick’s small body reflects a limited trading range between the open and close prices, signalling that there was little to no price movement between the open and close throughout the session. The lengthy lower shadow on the candlewick suggests that sellers drove the price sharply down throughout the trading session, potentially testing or breaking below crucial support levels while the lack of a significant upper shadow indicates that buyers attempted to drive the price higher but were unable to keep control, resulting in the bearish reversal signal.
What is the Direction of the Hanging Man Pattern?
Timeframe
A hanging man on a longer-term chart (such as daily or weekly) may be more significant than one on a shorter-term chart (such as intraday).
Shooting Star
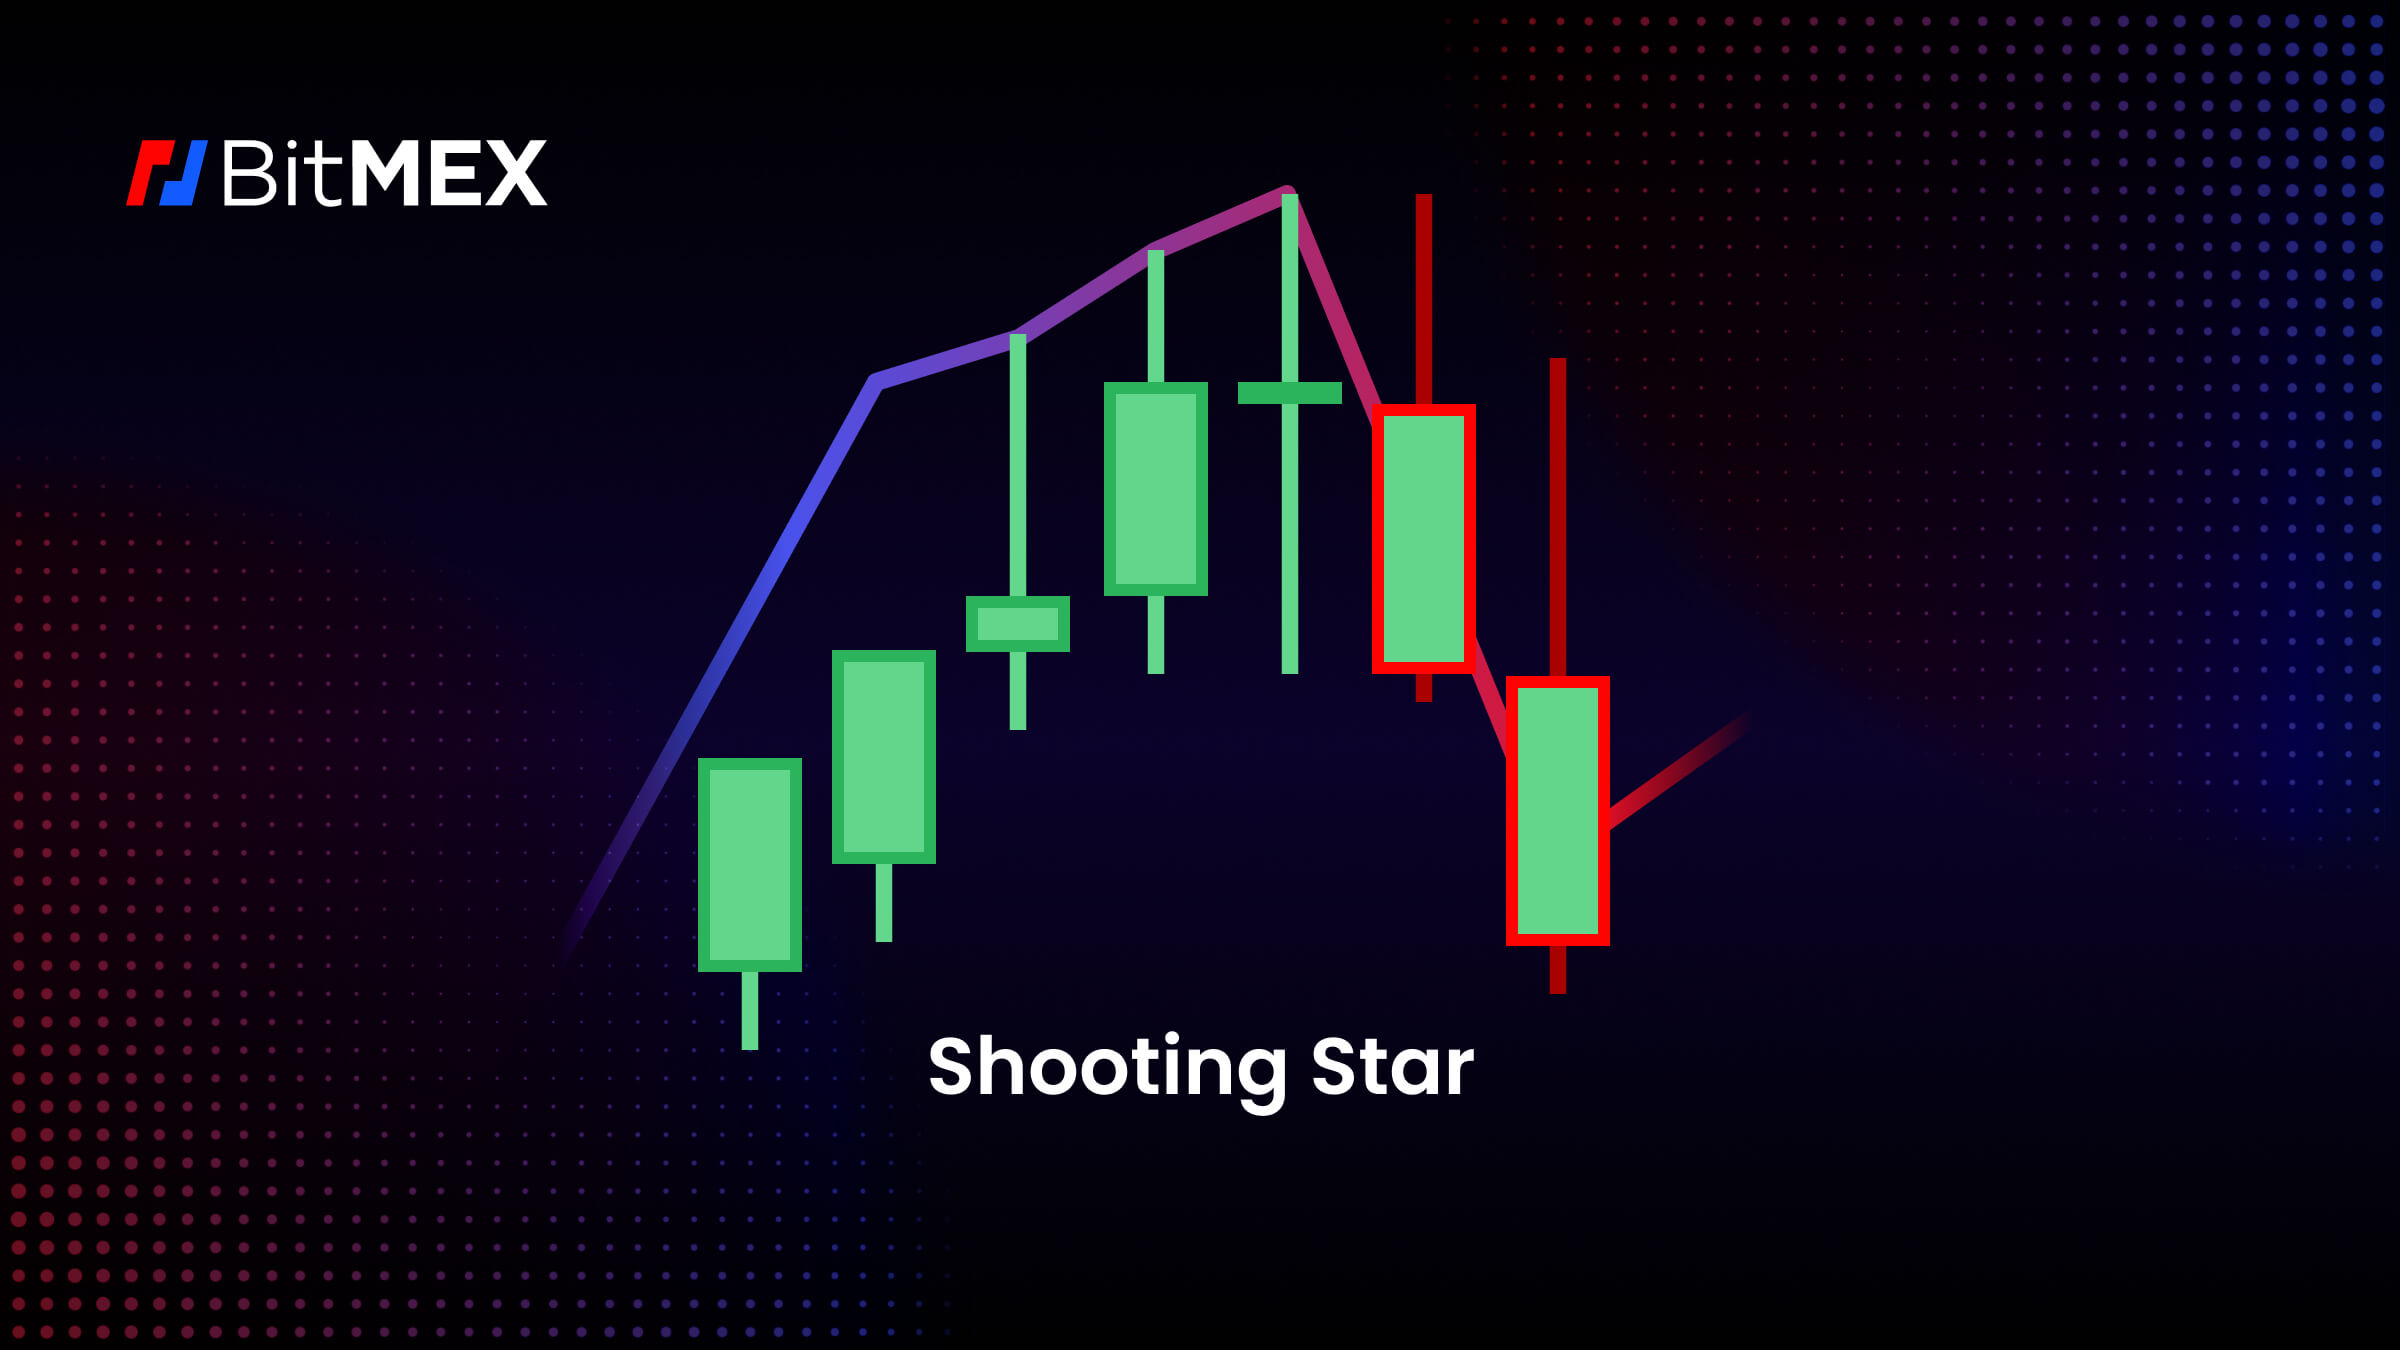
A Shooting Star candlestick pattern occurs during an uptrend and indicates probable reversal, with a small body at the bottom and a lengthy upper wick, signifying selling pressure and market weakness.
What are the Indicators of a Shooting Star Pattern?
- Seek out a candlestick with a small body only.
- Validate that the candlestick is red and hence opening price < closing price.
- Verify that the upper shadow is noticeably longer than the actual body, about two to three times longer.
- Verify that the lower shadow is either very short or not present at all.
- Take into account the situation:
– The shooting star pattern shows a bearish reversal signal when it shows up following a prolonged uptrend.
How to Interpret the Shooting Star Pattern?
The pattern originates from the fact that it resembles a star with an upward-pointing tail.
The small body near the bottom of the candlestick is followed by a lengthy upper shadow that extends above the real body in the shooting star pattern. The body reflects the price range between the starting and closing prices for a given trading session, whilst the upper shadow represents the highest price reached during that session.
The shooting star’s lengthy upper shadow suggests that buyers attempted to drive prices higher during the session, but were ultimately unsuccessful, and sellers were able to bring the price back down. This rejection of higher prices is a bearish indicator, indicating that the bullish momentum has diminished and a reversal is possible.
What is the Direction of a Shooting Star Pattern?
A shooting star candlestick pattern often moves from top to bottom on a price chart. In other words, a shooting star pattern indicates a possible reversal from bullish to a bearish trend.
Volume Analysis
A rise in trading volume on the day of the shooting star can serve as validation. As the volume increases, it suggests that the reversal is being supported by more people. A drop in volume can indicate a lack of interest in the pattern, which can reduce its reliability.
Theoreticals aside, if you wish to begin trading crypto derivatives or spot on BitMEX, you can find all our existing products here. For more educational resources on trading at BitMEX, particularly derivatives, visit this page.
To be the first to know about our new listings, product launches, giveaways and more, we invite you to join one of our online communities and connect with other traders. For the absolute latest, you can also follow us on Twitter, or read our blog and site announcements.