Abstract: We examine a question which many in the crypto-currency community frequently ask: “When is the next global financial crisis going to happen?” We attempt to answer this by first explaining how that since 2008, the epicentre of financial risk seems to have shifted from the banks to the asset management industry. We therefore argue that a repeat of 2008, where retail banking deposits and payment systems are under threat, is unlikely. In particular, we assert that corporate debt investment funds and unconventional debt investment vehicles, encouraged by the deceptively low volatility and low return environment, could be the area where the fragility in the financial system is most significant.

(Ten years since the global financial crisis, as the newspapers from the time exposed to the sunlight turn yellow and pink, at some point credit conditions could tighten significantly again, but will the asset management industry, rather than the banking sector, be the epicentre of risk?)
Please click here to download a PDF version of this report
Overview
Due in part to the timing of its launch, Bitcoin is said to have been born out of the financial chaos and scepticism resulting from the 2008 global financial crisis. Therefore, many Bitcoin investors and members of the crypto-currency community often seem to ask:
When is the next global financial crisis going to happen?
Due to the demand, we will attempt to address the issue.
First, we will look into the question itself. In our view, there appears to be three main assumptions behind the question:
- The next global financial crisis will arrive in the next few years and it’s inevitable one will occur every decade or so;
- Such a crisis will have a positive impact on the price of Bitcoin;
- The next global financial crisis will look similar to the last one, resulting in many questioning the integrity of the banking system and electronic payment systems.
Of these three assumptions, we only really agree with the first one. Although we think the latter two assumptions could possibly hold true, there is significant uncertainty about them.
As for the second assumption, we touched on this issue in March 2018, when we noted that Bitcoin was trading more like a risk-on asset than a safe-haven asset. Of course the Bitcoin price has fallen a lot since then and this could change going forwards. If Bitcoin does respond well in the next crisis (when liquidity is constrained), that will be a huge positive for Bitcoin and the store of value investment thesis. Although, there is no significant evidence for this yet. A decoupling of the Bitcoin price from many of the alternative coins, which more clearly have a risk-on type investment thesis (e.g. world computer or high capacity payment network), is necessary for this to occur, in our view.
As for the third assumption, the mechanics of the next global financial crisis, that is the focus of this report.
Bank Balance Sheets In Developed Markets Are Relatively Healthy
As the famous saying goes, “History doesn’t repeat itself but it often rhymes.” Over the last decade, bank management teams and banking regulators have operated in the shadows of 2008. As a result, bank balance sheets and capital ratios have significantly strengthened. Bank Tier 1 capital ratios in developed markets have improved from around 5% pre-crisis to around 12% today (Figure 1). The more basic ratio of equity to total assets, which is more difficult to manipulate, also illustrates a similar story: improving from c5% to c9% in the period (Figure 2).
Figure 1 – US & UK Bank’s Aggregate CET1 Capital Ratios
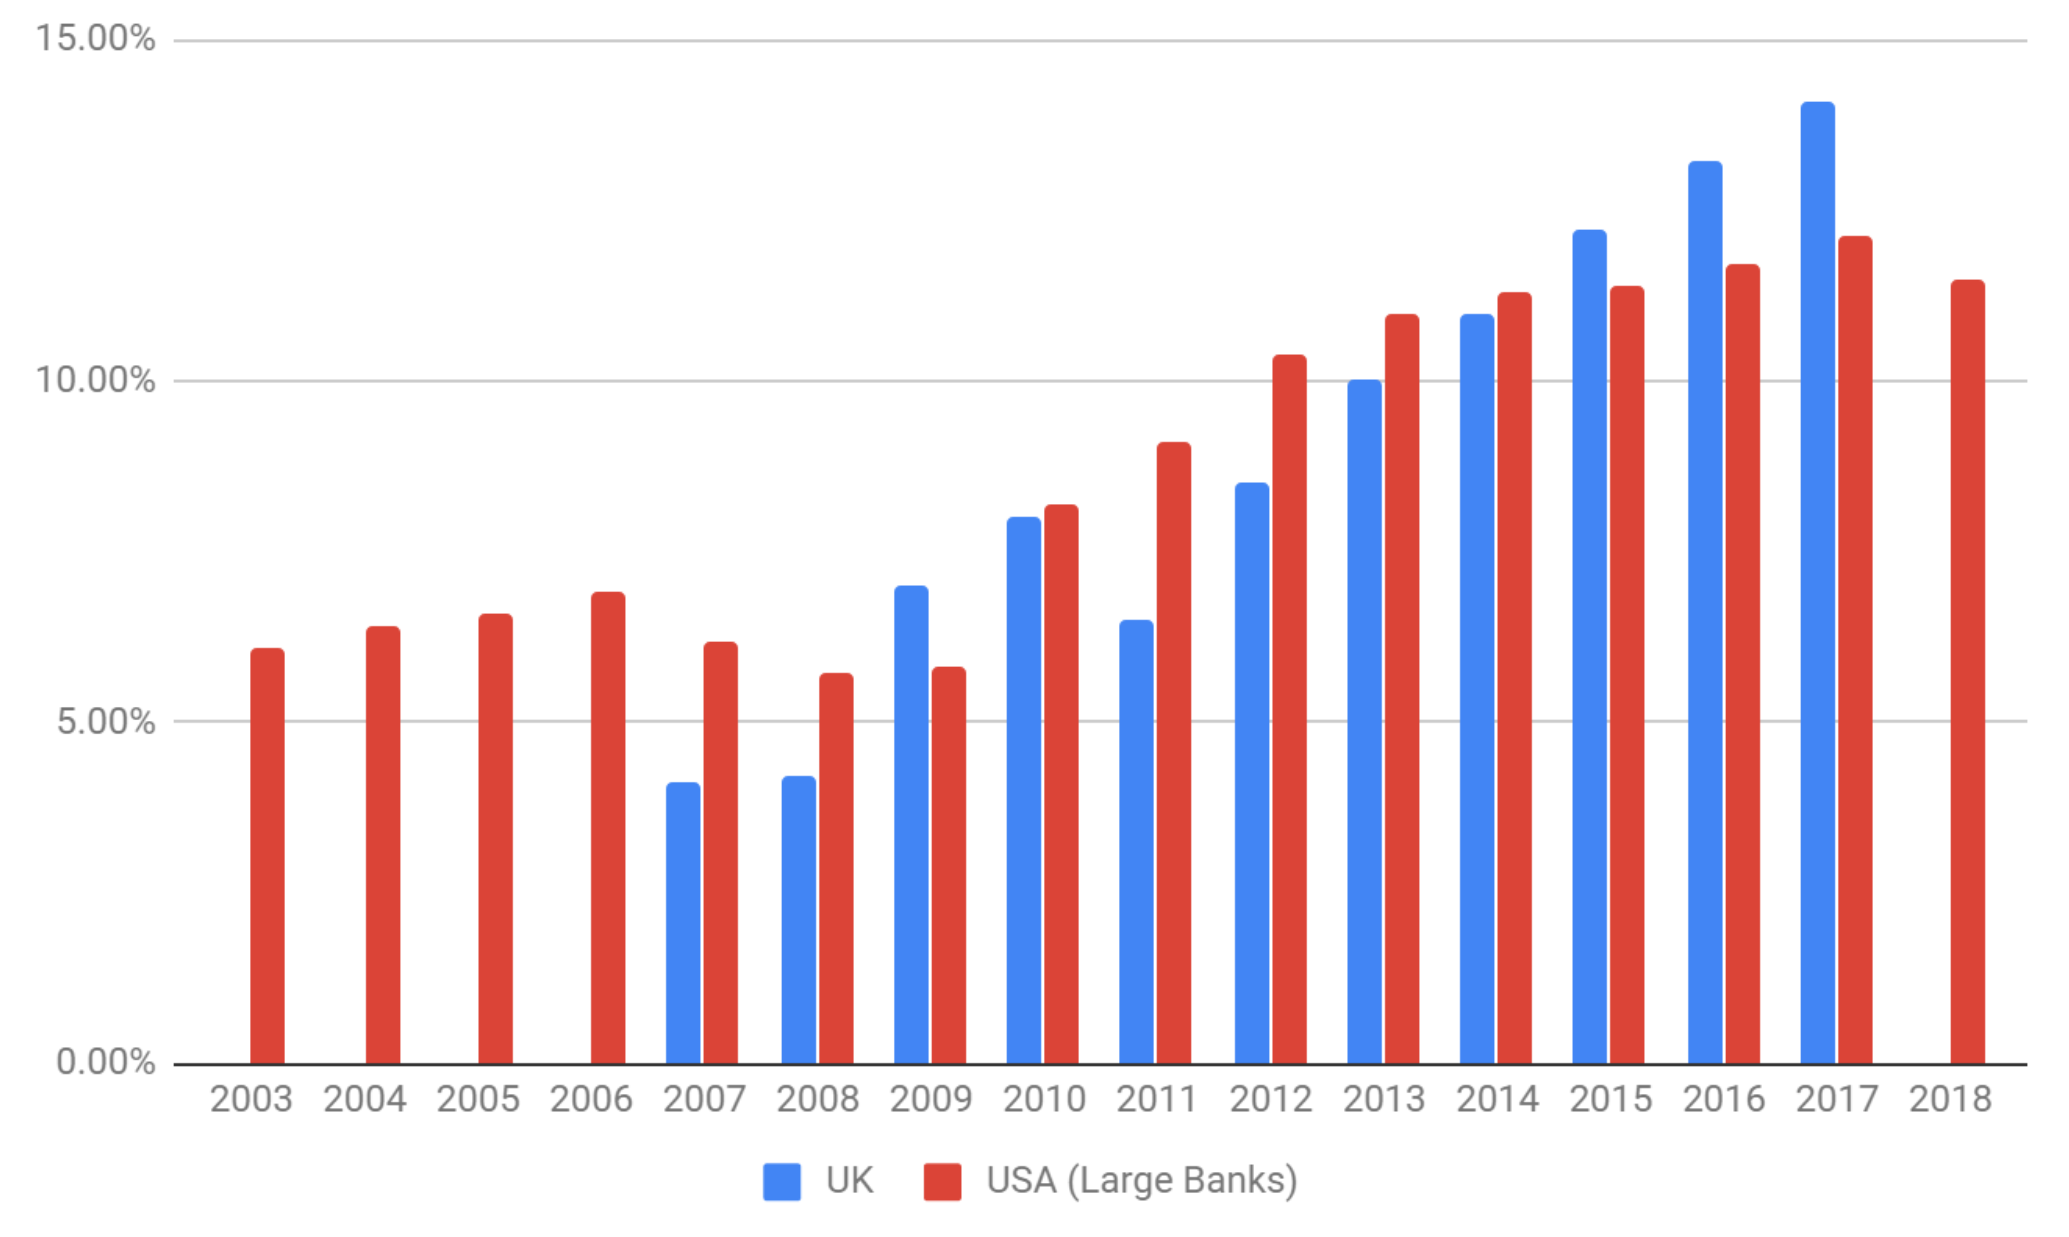
(Source: UK aggregate data from the Bank of England, US data from the Federal Reserve)
Figure 2 – US Bank’s Aggregate Tangible Equity to Total Assets Ratio (Banks with over $50 billion in assets)
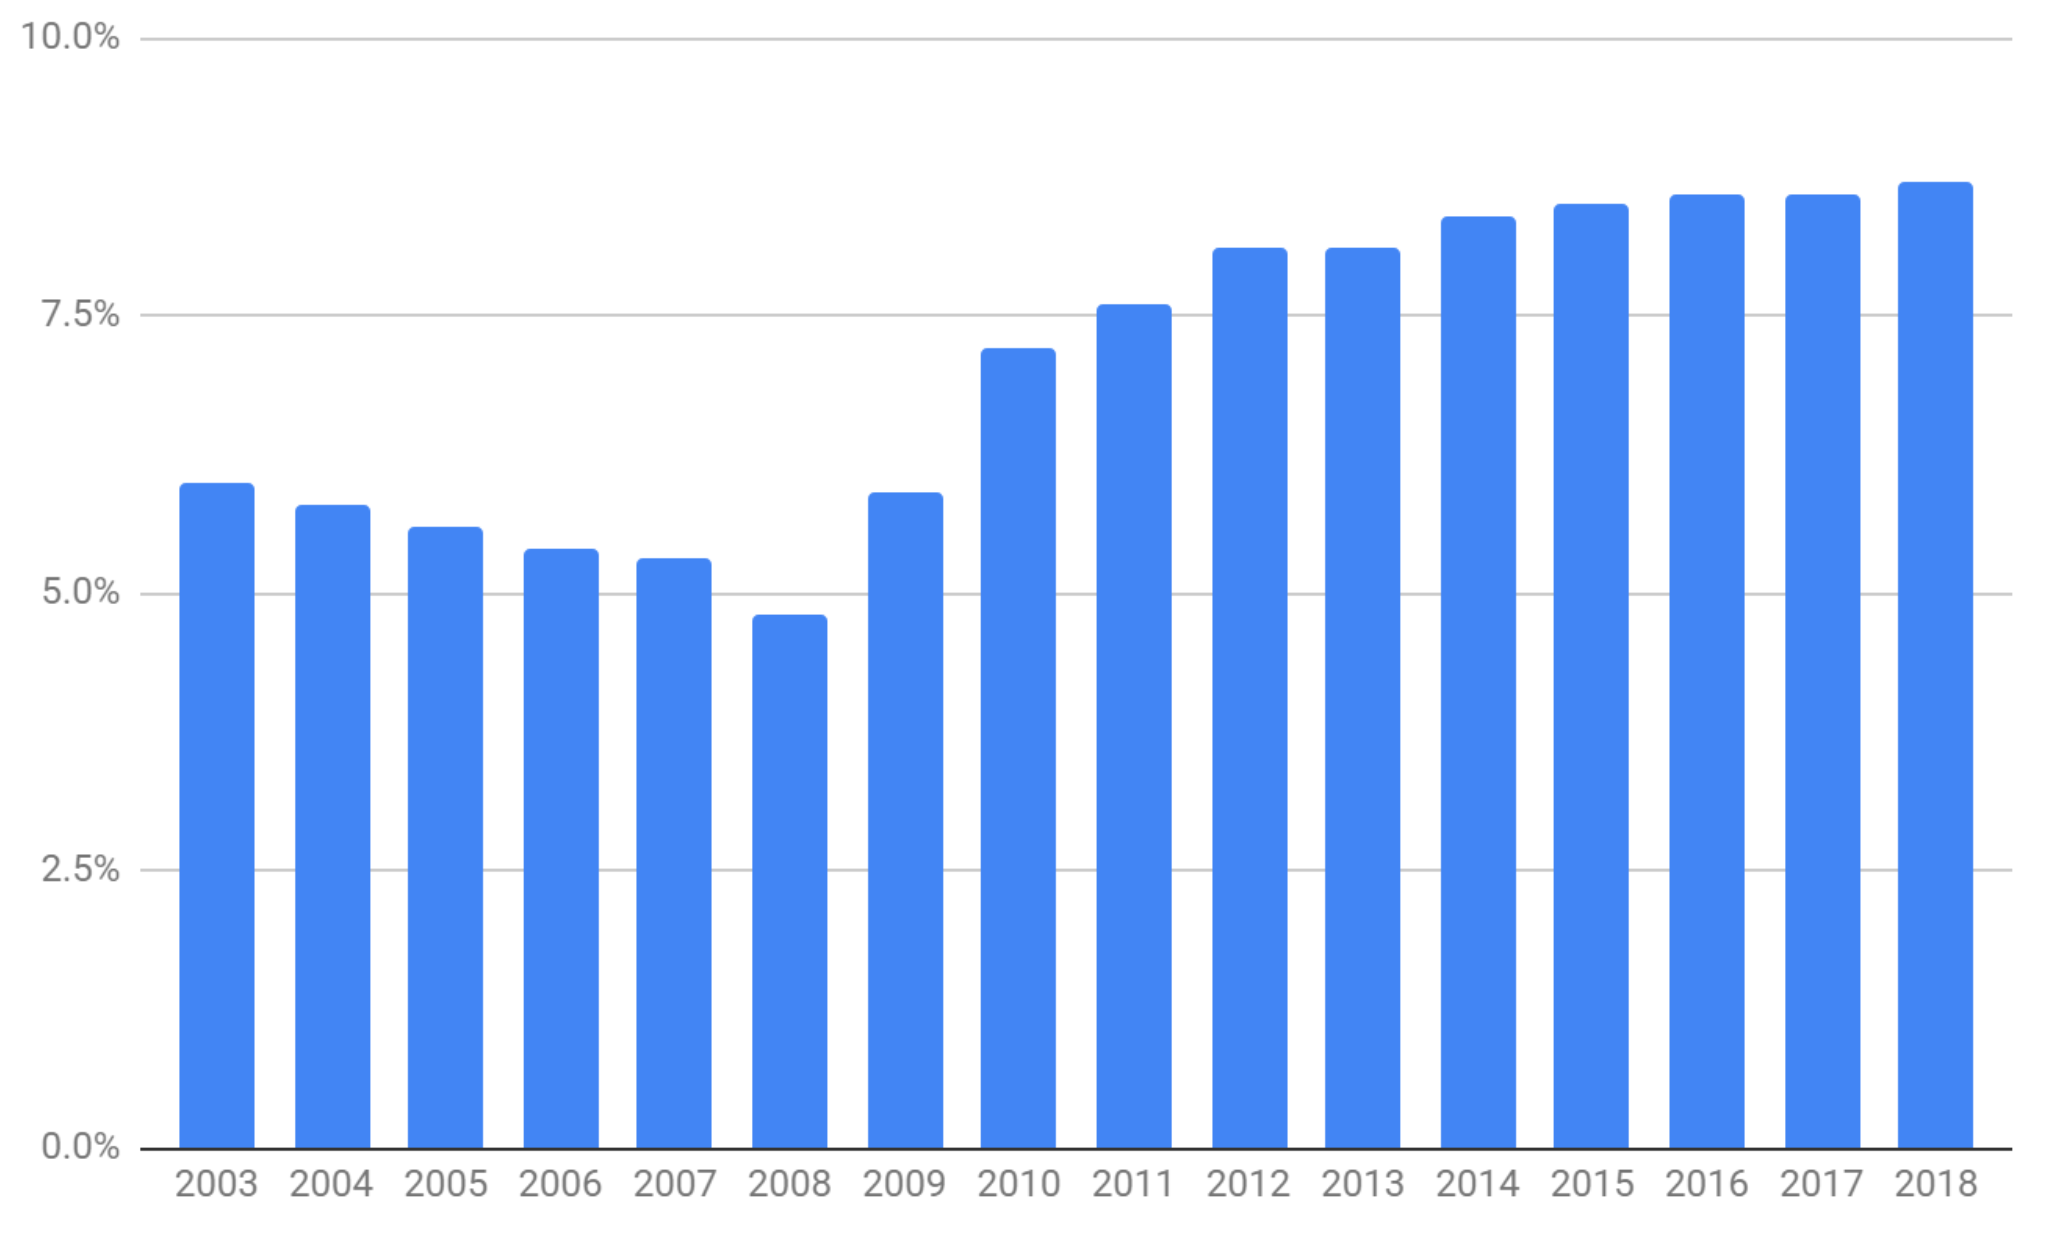
(Source: Federal Reserve)
Perhaps even more revealing and compelling than the above ratios, is the following more simple chart (Figure 3). It illustrates that the main western banks have not expanded their balance sheets at all since the global financial crisis. Actually, the sample of the nine major banks we have reviewed experienced a significant decline in total assets in aggregate, from US$19.3 trillion in 2008 to US$15.6 trillion in 2018. One could argue that M&A activity is a driver of the below chart, but our point still stands.
Figure 3 – Total Assets Of Selected Banks In Developed Markets – US$ Trillion
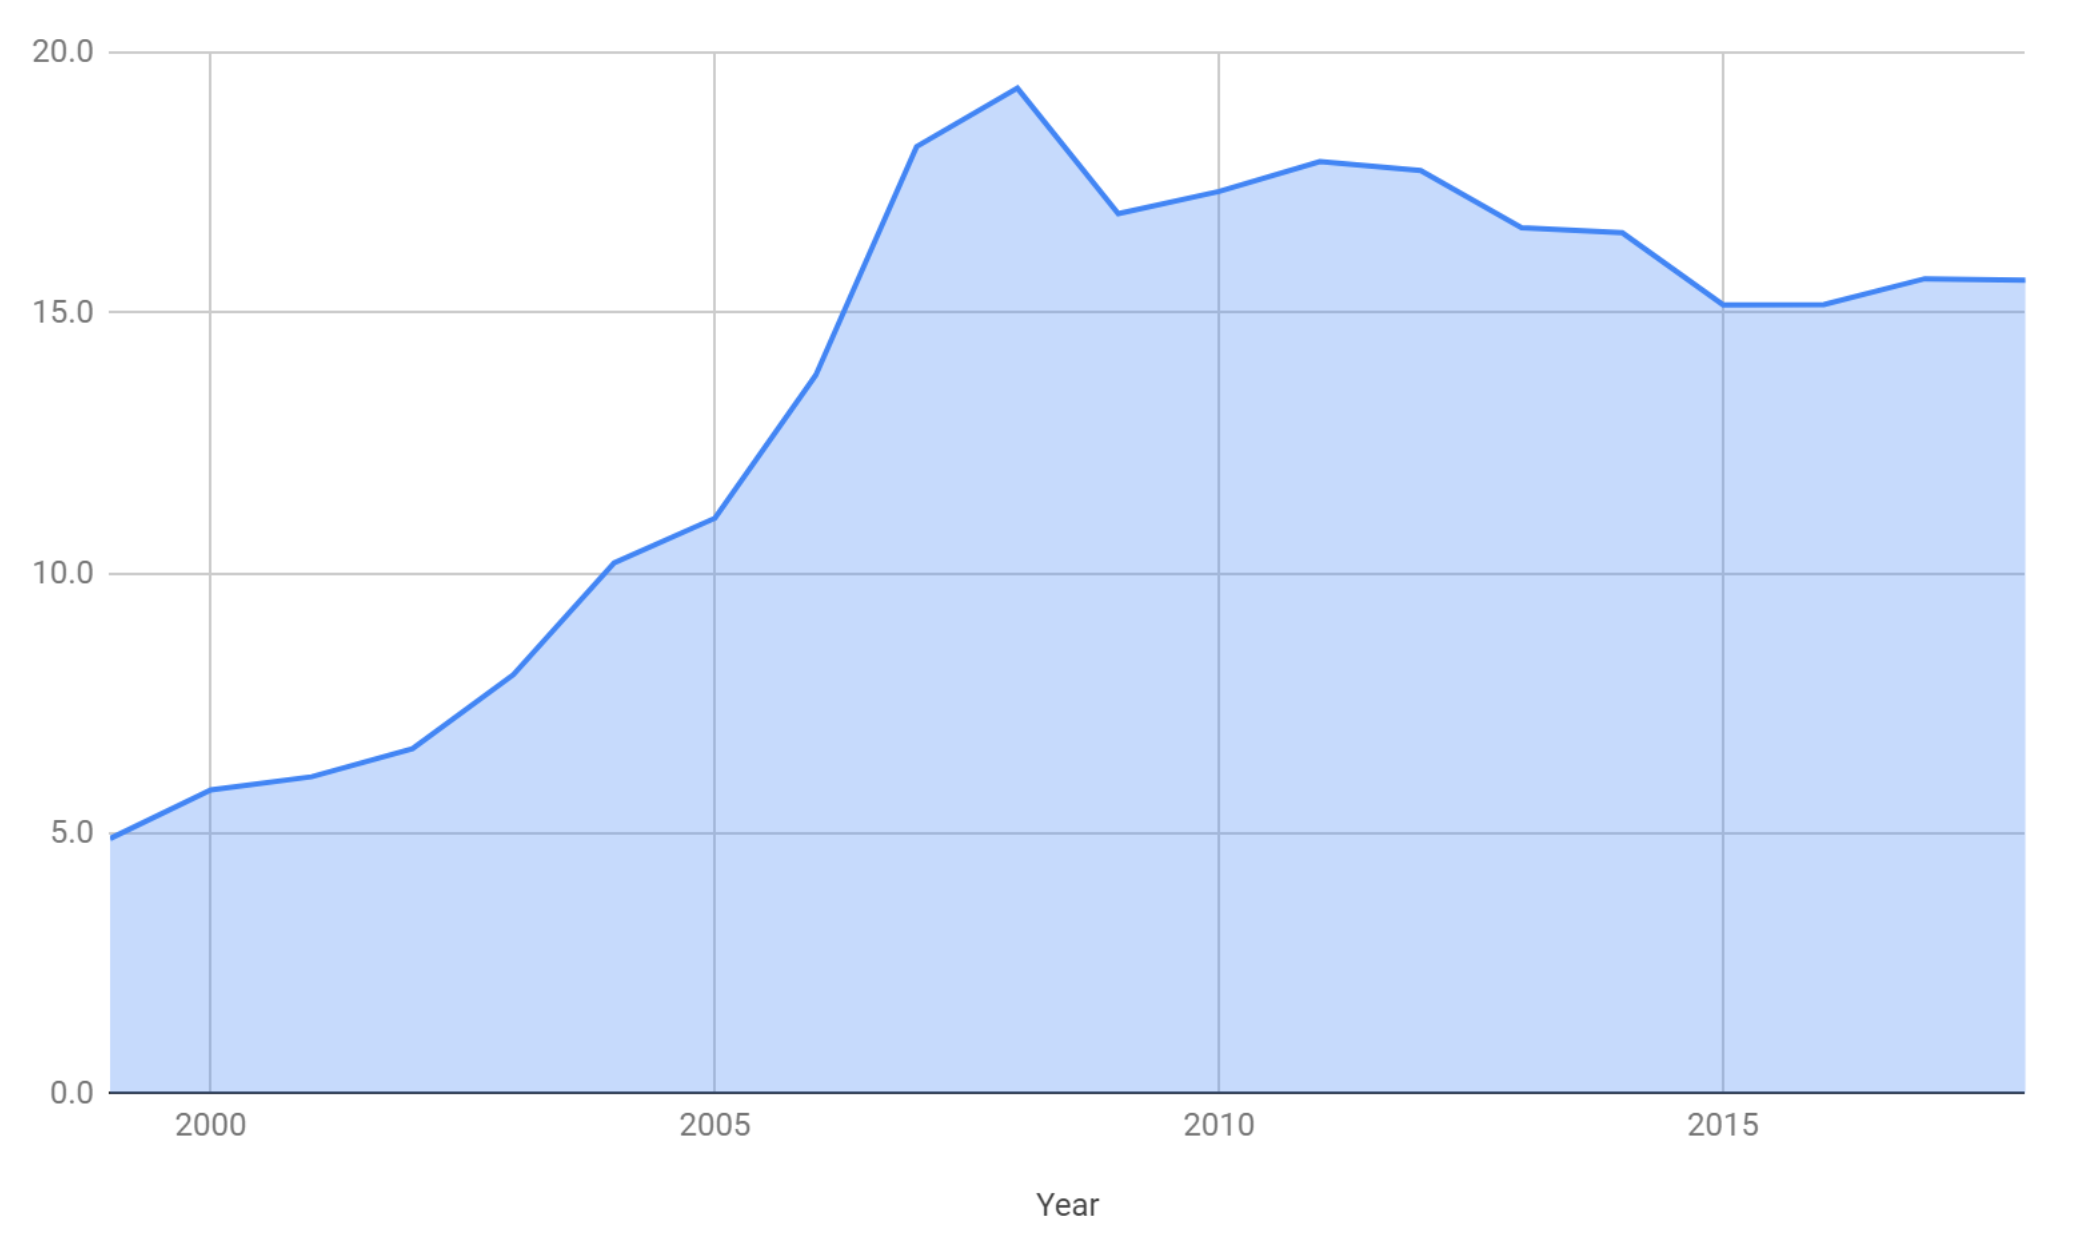
(Source: BitMEX Research, Bank Earnings, Bloomberg)
(Note: The chart represents the total reported assets for JP Morgan, Bank of America, Citigroup, Wells Fargo, HSBC, RBS, Deutsche Bank, Credit Suisse and UBS.)
In our view, financial leverage is one of the the primary drivers of financial risk. The epicentre of risk in the financial system appears to have shifted since 2008. In 2008, the risk was caused by leverage in the banking system and the interrelationships between this and the securitisation of the mortgage market. Today, the equivalent risk is leverage in the asset management industry and in particular the corporate debt sector, driven by the deceptively low volatility environment.
Growth In Leverage In The Asset Management Industry
The asset management industry is far more opaque than banking and determining the degree of leverage is far more challenging. Therefore, it is difficult to conclude on either the extent of leverage in the asset management industry or the timing of any financial crisis related to this leverage.
A 2015 Bank of International Settlement (BIS) report entitled “Leverage on the buy side,” focused on the shift in risk from the banking system to the asset management industry. The report notes that while investment fund leverage has been reasonably stable in equities, in the fixed income area, it has grown considerably since 2008, especially in emerging markets. The BIS report concludes with the following:
Leverage in the banking system was an important ingredient in the 2008 global financial crisis. Since then, asset managers (the “buy side”) have quickly increased their footprint in global financing, helped by the sharp retrenchment of banks nursing their balance sheets back to health. Balance sheet information for investment funds is much less readily available than for highly regulated banks. Using information provided by a market data vendor, we found that leverage on the buy side is not negligible, although it seems to vary considerably depending on the type of fund. Equity fund portfolios seem to be minimally leveraged, while fixed income funds tend to resort abundantly to borrowed money.
(Source: BIS)
The BIS report used data from investment fund flow specialist EPFR, and although we agree with the report’s conclusions, it is difficult to formulate a strong view of the data’s reliability. Although we have not found good sources of global data ourselves, US-domiciled investment funds over a certain size are required to submit data to the SEC about the extent of leverage used. The SEC has complied this data since Q2 2013 and we have summarised the main trends in the below charts (Figures 4, 5, and 6).
The data shows that, unlike the banking sector, the asset management industry has expanded considerably since 2008 (Figure 4). At the same time, leverage also appears to have increased, although producing a clear chart since 2008 illustrating this is difficult.
Figure 4 – US Fund Industry Gross Asset Value (US$ billion)
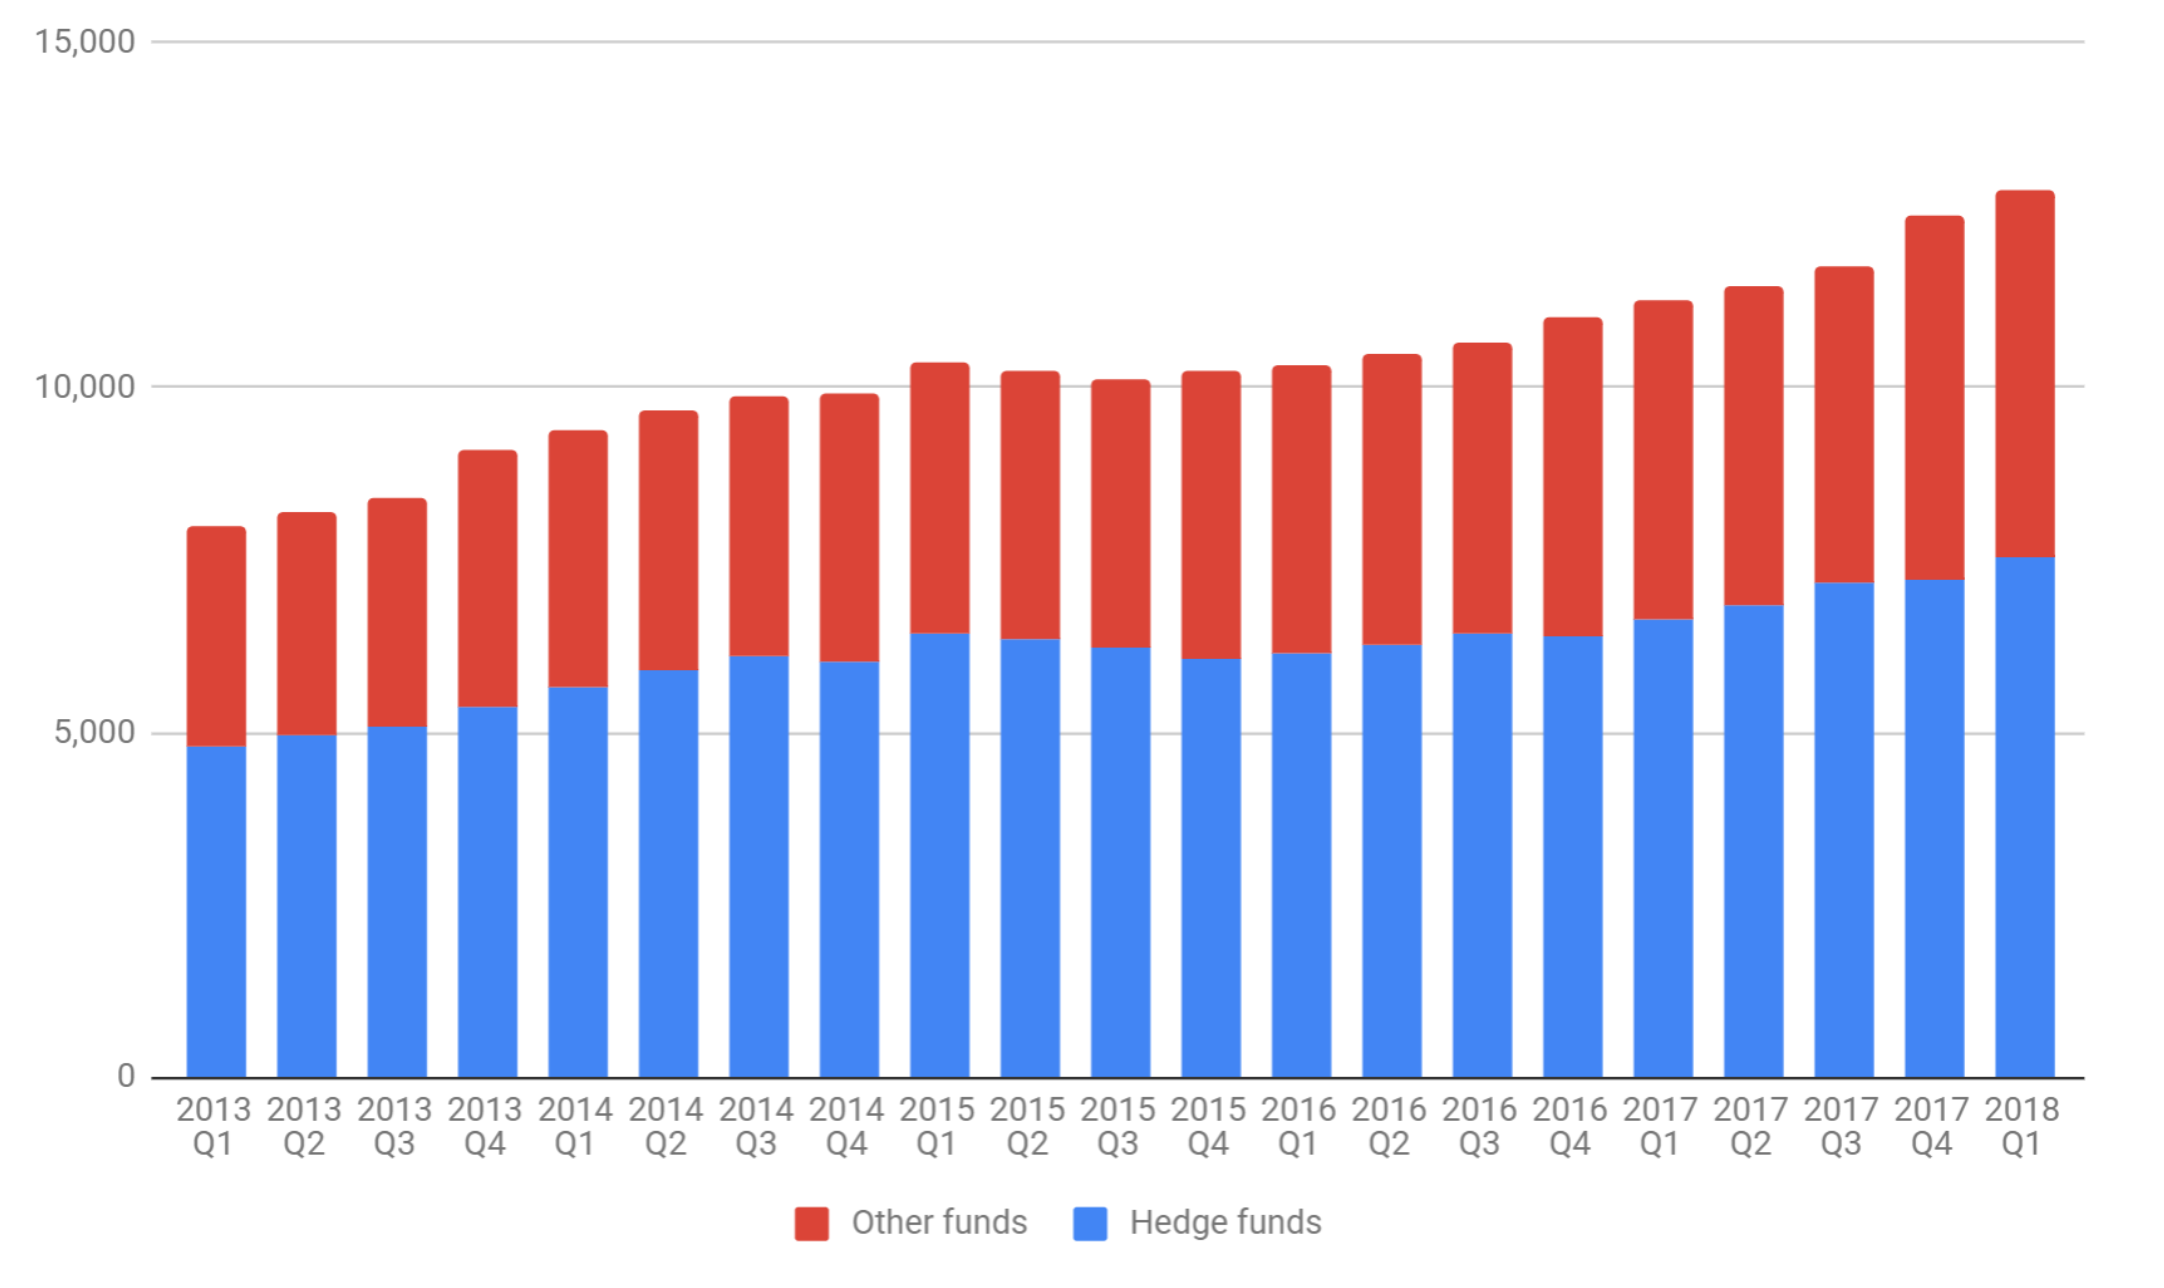
(Source: BitMEX Research, SEC)
Although there are competing methodologies, the most basic method for establishing the degree of leverage for an investment fund is calculating the gross asset value over the net asset value, sometimes referred to as the gearing ratio. Unfortunately the time span in the below chart (Figure 5) is limited, but it appears to indicate a moderate expansion of leverage, at least in the hedge fund sector.
Figure 5 – US Private Fund Industry Gearing Ratio – Gross Asset Value/Net Asset Value
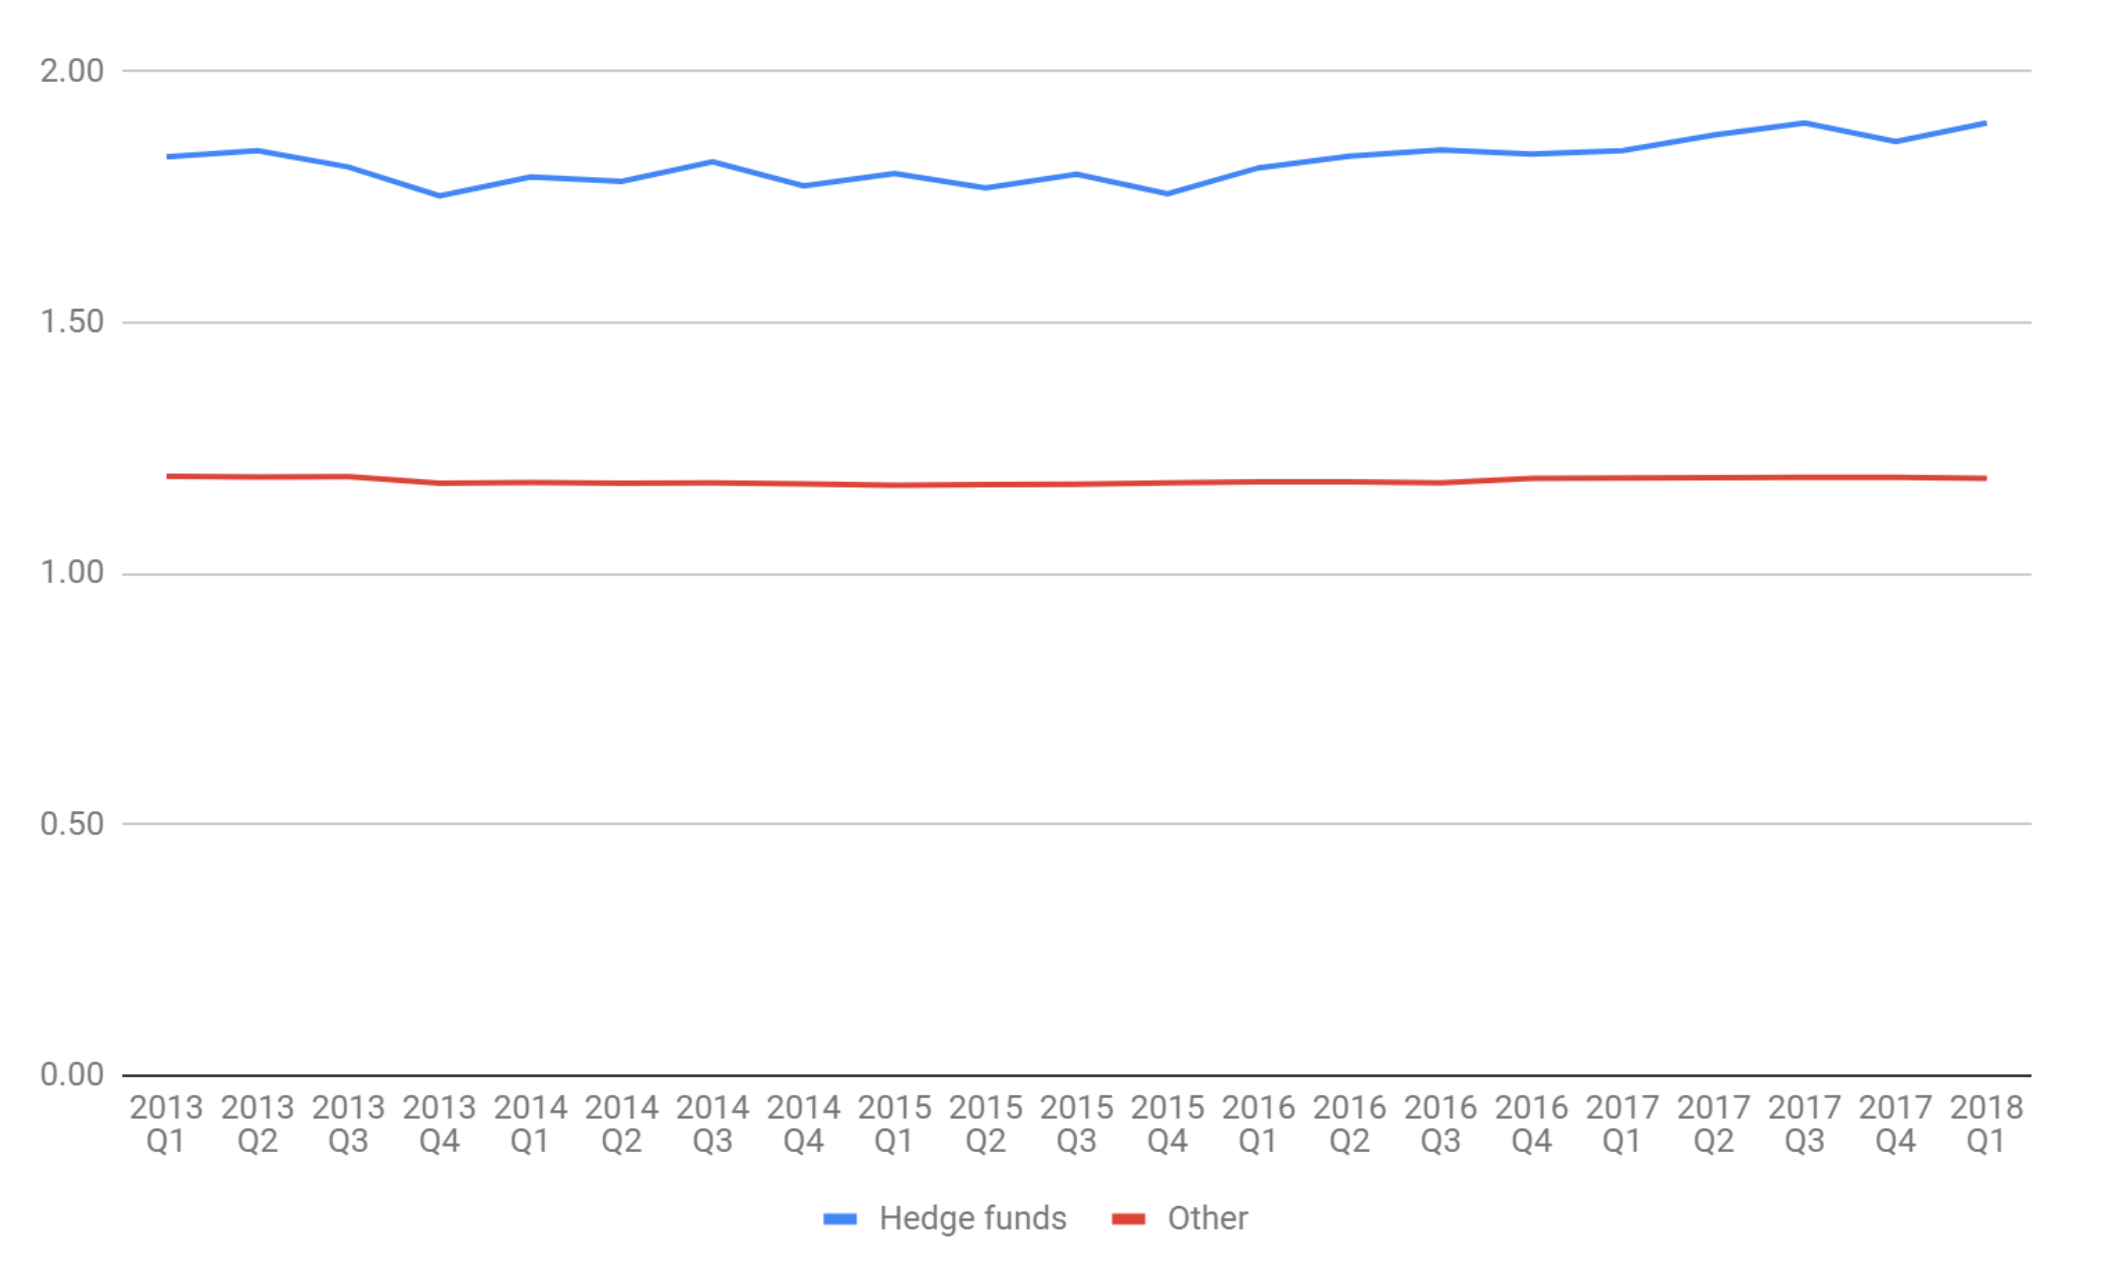
(Source: BitMEX Research, SEC)
The gearing ratio underestimates true leverage, by ignoring the impact of derivatives. Disclosure of the notional value of derivative exposure is also required by the SEC. The below chart illustrates the growth in usage of derivatives by US-based hedge funds.
Figure 6 – US Private Fund Industry – Hedge Funds – Notional Value Of Derivatives/Net Asset Value
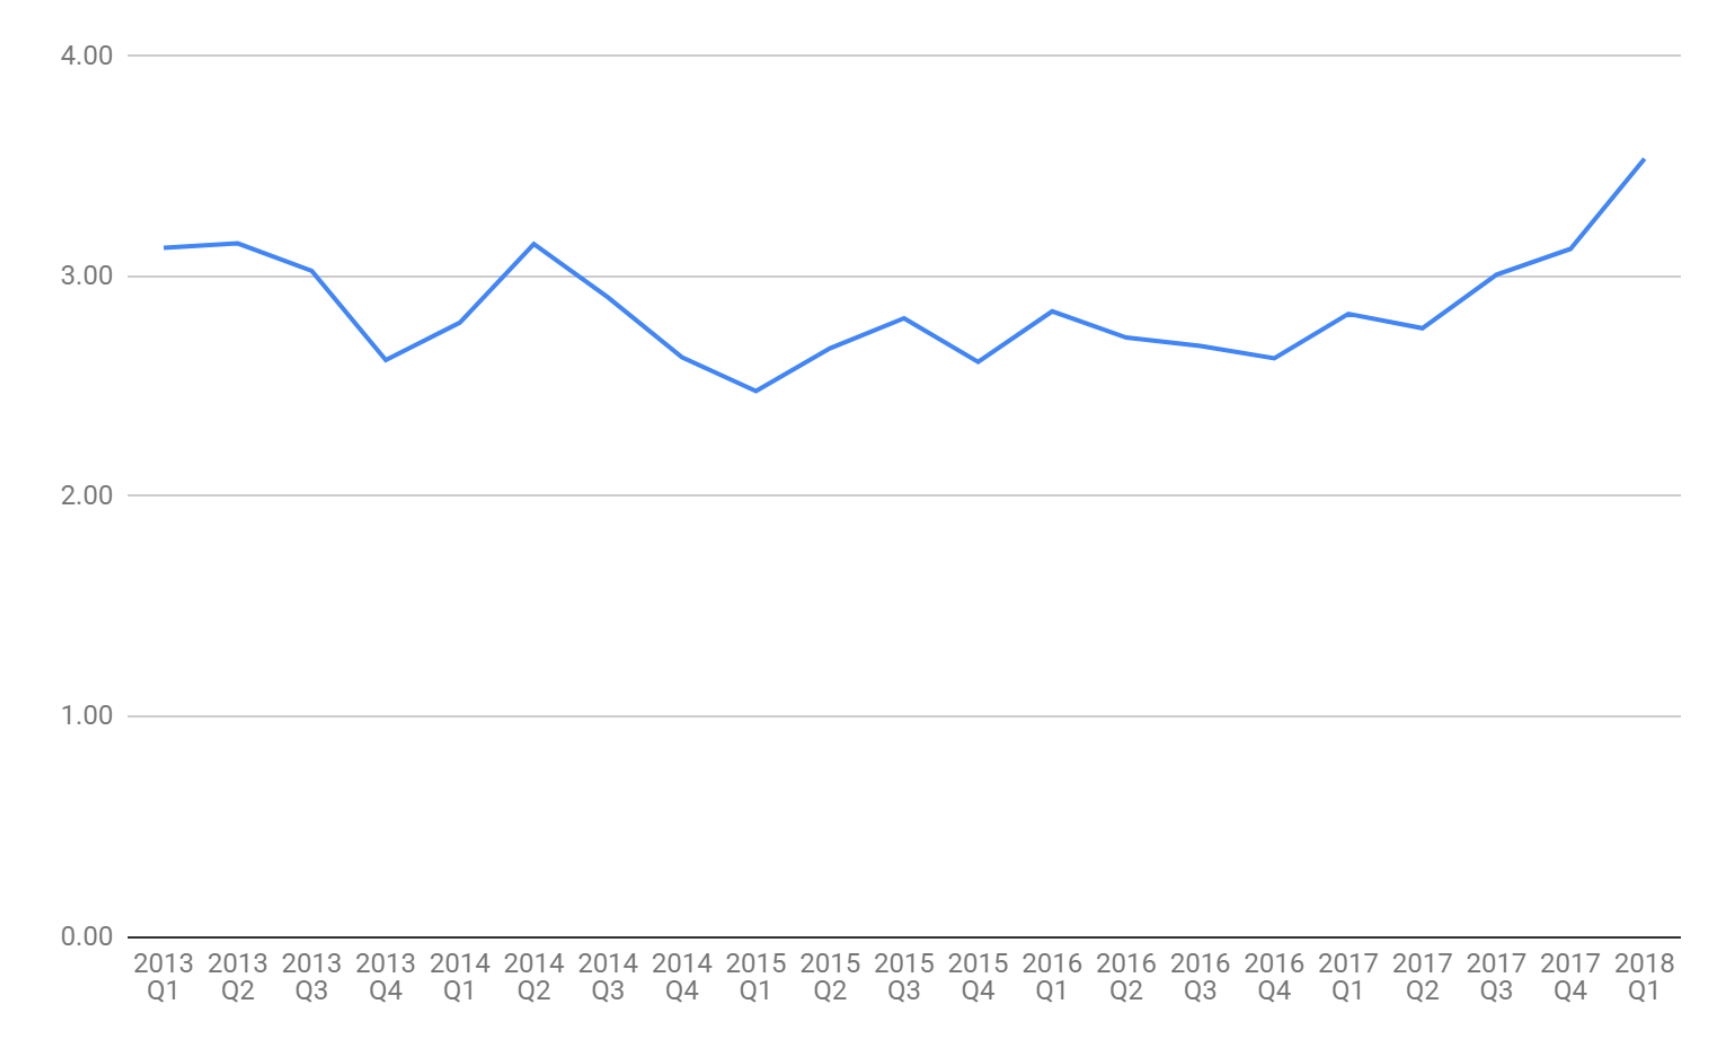
(Source: BitMEX Research, SEC)
(Note: Adjustments were made to reflect changes in how the SEC reports the data.)
New Corporate Debt Market Vehicles
In addition to the increased use of leverage in the fixed income market by investment funds, the mechanics of the debt markets are becoming increasingly complicated and opaque. The replacement of the role of the banks in the corporate debt markets, has resulted in the rapid growth of a whole range of interrelated, non-mutually exclusive investment structures. Some of these structures are summarized in the table below.
| Type of Debt | Description/Comments | Reference |
| Collateralized Loan Obligations (CLOs) | CLOs are when a group of loans from multiple companies, are pooled together to form a security. The product is typically split into different tranches, lower risk tranches with lower returns and higher risk tranches with higher returns. Investors in the highest risk tranche are the last to be paid in the event of any insolvencies.
Typical buyers of these products are pension funds, insurance companies and hedge funds. They are particularly popular with yield hungry Asian investors. |
Market growth – Figure 7 |
| Leveraged Loans | These are typically variable rate loans provided to companies who are already highly indebted. In the majority of cases the loan is fully unsecured. The typical holders of such instruments are pension funds and other private investors.
The Bank of England recently estimated the size of the leveraged loan market globally at US$2.2 trillion and compared it to the size of the US subprime mortgage market in 2006 (US$1.3 trillion). |
Market growth – Figure 8
Credit quality – Figure 15 |
| Private debt deals | This is similar to the leveraged loan market, except the debt does not normally trade on a secondary market. | Market growth – Figure 9 |
| Bond fund ETFs and mutual funds | ETFs have expanded in popularity in all asset classes in the period, corporate bond funds are no exception. | Market growth – Figure 10 |
| Private Equity | Credit quality – Figure 16 |
(Note: The fields in the above table are not meant to be mutually exclusive)
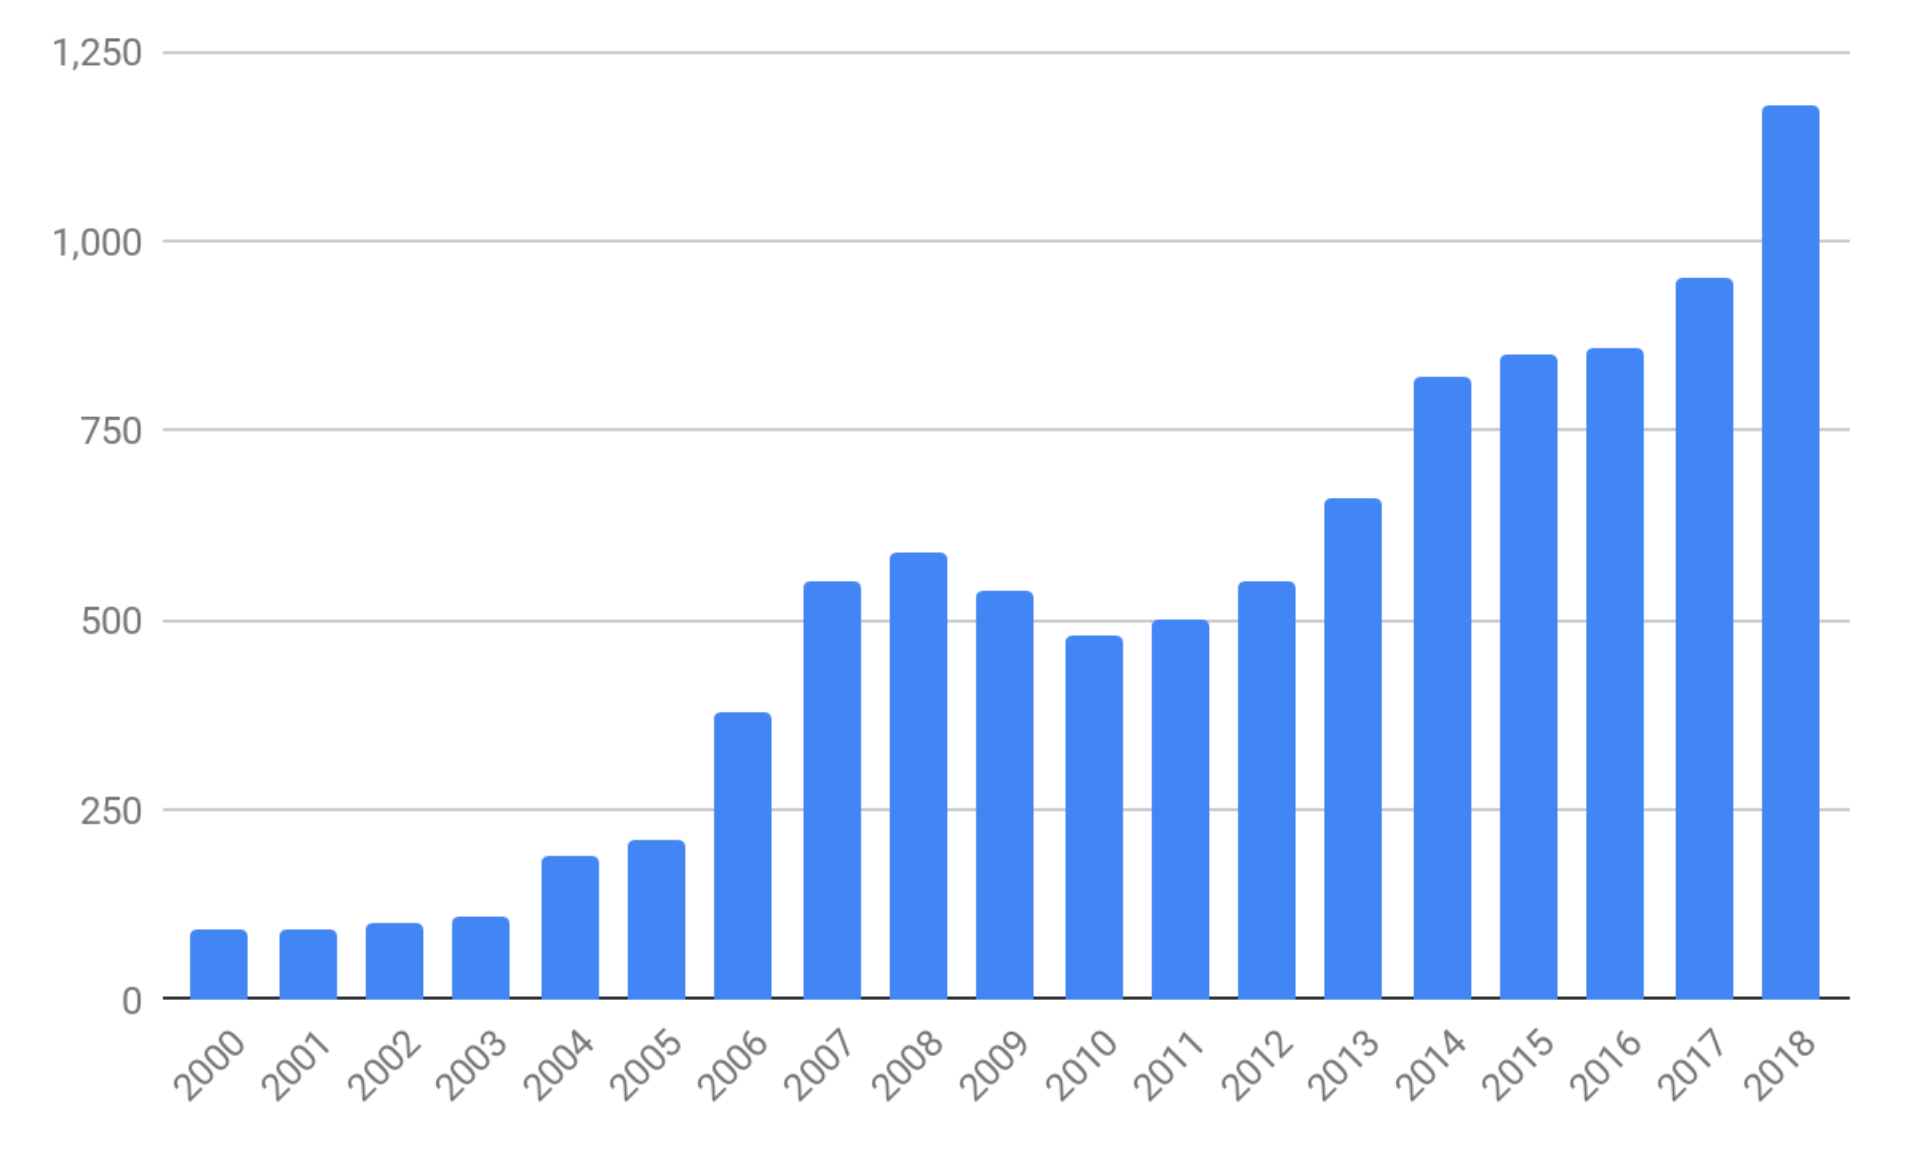
As the following charts from various sources indicate, all these non-bank mechanisms for providing corporates with financing have grown considerably since the last global financial crisis.
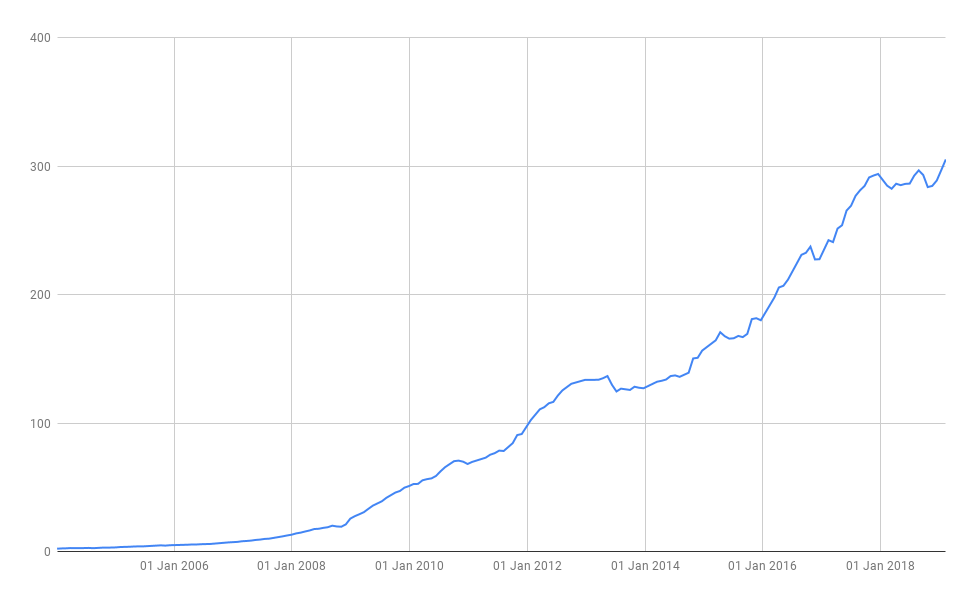
Figure 7 – Size of Collateralized Loan Obligation (CLO) Market – US$ billion
(Source: Citi, FT)
Figure 8 – Size of US Leveraged Loan Market – US$ billion
(Source: S&P, FT)
Figure 9 – Size of Private Debt Market – US$ billion
(Source: Bank of America, FT)
Figure 10 – Size of the Top Bond ETFs Targeting US Investors – US$ Billion
(Source: BitMEX Research Bloomberg)
(Note: The chart represents the sum of the market capitalisations of the following bond ETFs: iShares Core U.S. Aggregate Bond ETF, Vanguard Total Bond Market ETF, iShares iBoxx $ Investment Grade Corporate Bond ETF, Vanguard Short-Term Corporate Bond ETF, Vanguard Short-Term Bond ETF, Vanguard Intermediate-Term Corporate Bond ETF, iShares J.P. Morgan USD Emerging Markets Bond ETF, Vanguard Total International Bond ETF, iShares MBS Bond ETF, iShares iBoxx $ High Yield Corporate Bond ETF, PIMCO Enhanced Short Maturity Strategy Fund, Vanguard Intermediate-Term Bond ETF, iShares Short-Term Corporate Bond ETF, SPDR Barclays High Yield Bond ETF, iShares Short Maturity Bond ETF)
Corporate Debt Markets Conditions
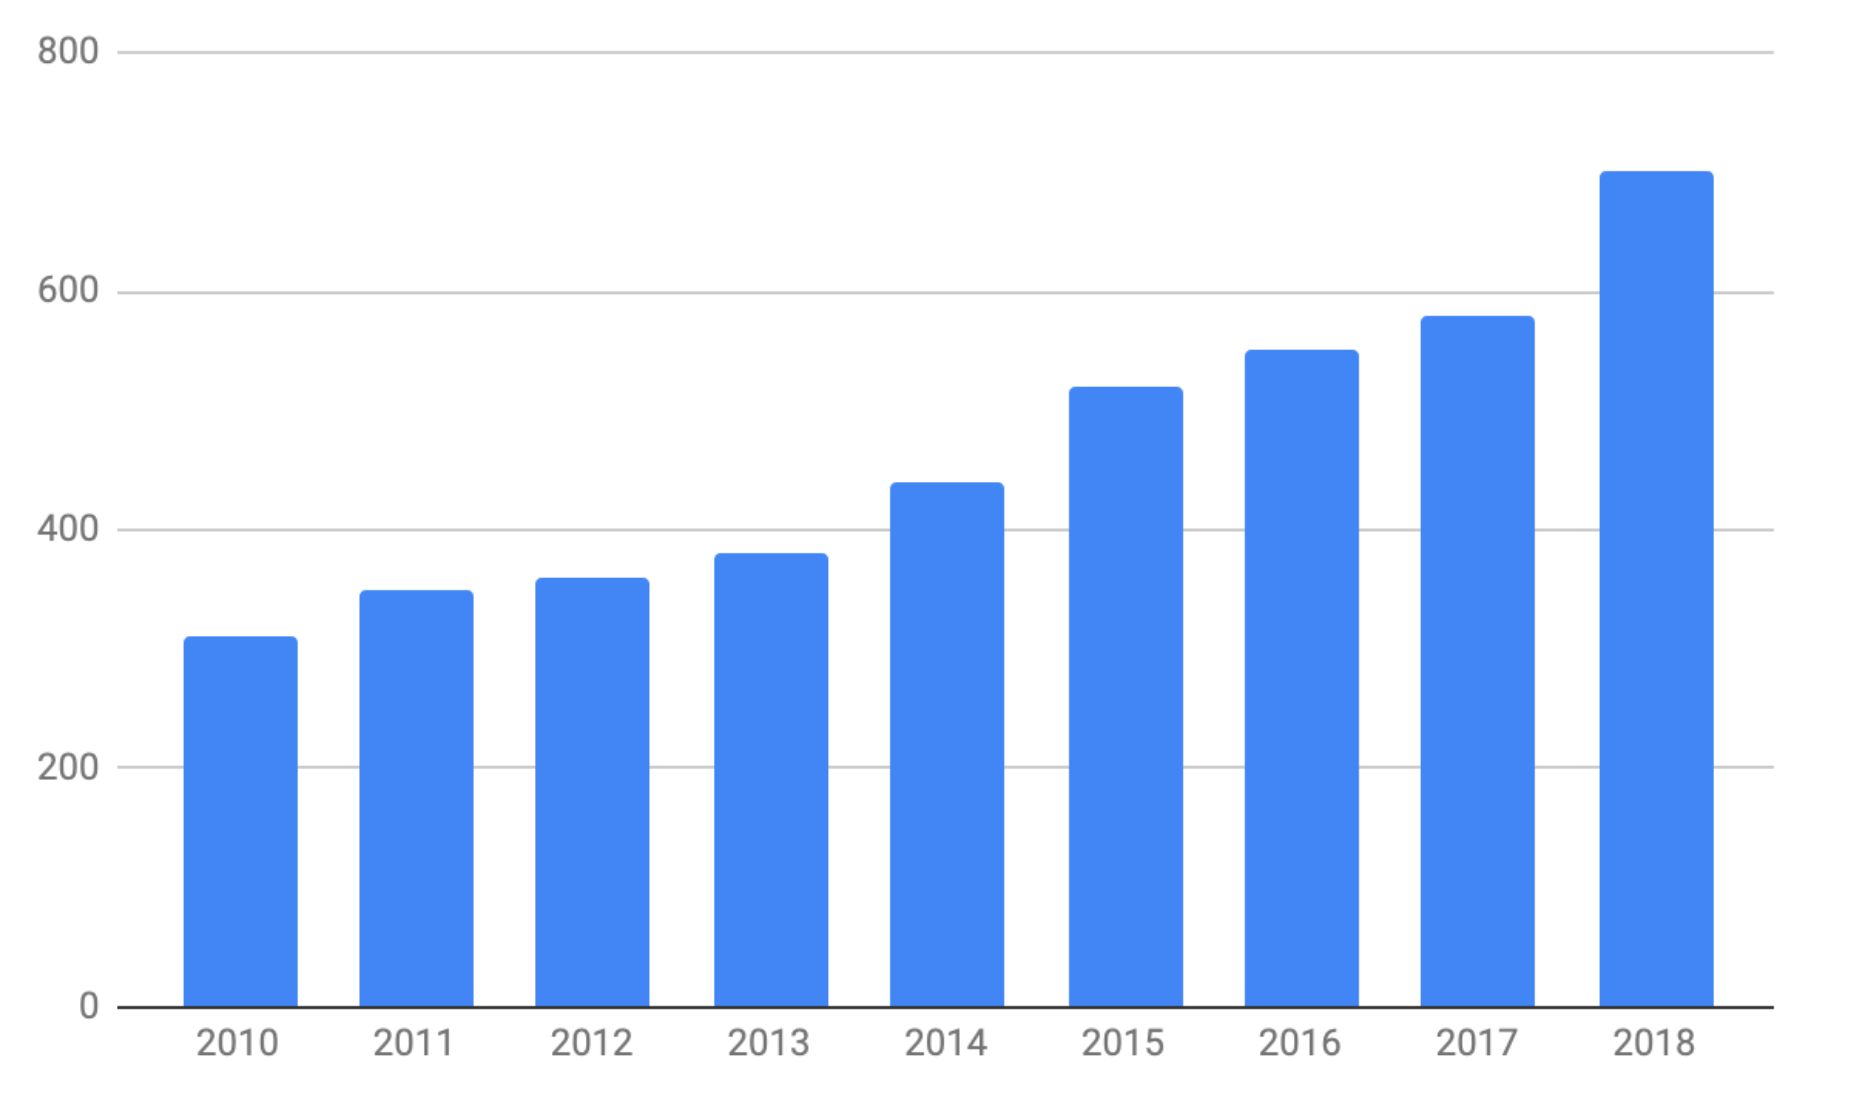
As Figure 11 below illustrates, corporate debt levels have increased considerably since 2008, with gross debt of Russell 3000 companies now totalling US$11 trillion, compared to being just over US$8 trillion at the time of the last crisis. Corporations have taken advantage of low interest rates and the new investment products mentioned above, to borrow money at record levels.
However, as the red line on Figure 11 illustrates, Russell 3000 corporate balance sheet conditions still appear reasonably healthy, with an aggregate net debt to EBITDA of just under 2.5x. Although this ratio has been increasing in the last few years, it is nowhere near as large as the c3.7x level which was present before the 2008 financial crisis. This perceived strength is caused by a few large tech giants hoarding cash and the strong economy boosting earnings. If the economy turns, corporate balance sheets could start to look unhealthy again, as earnings fall.
Figure 11 – Corporate Debt levels
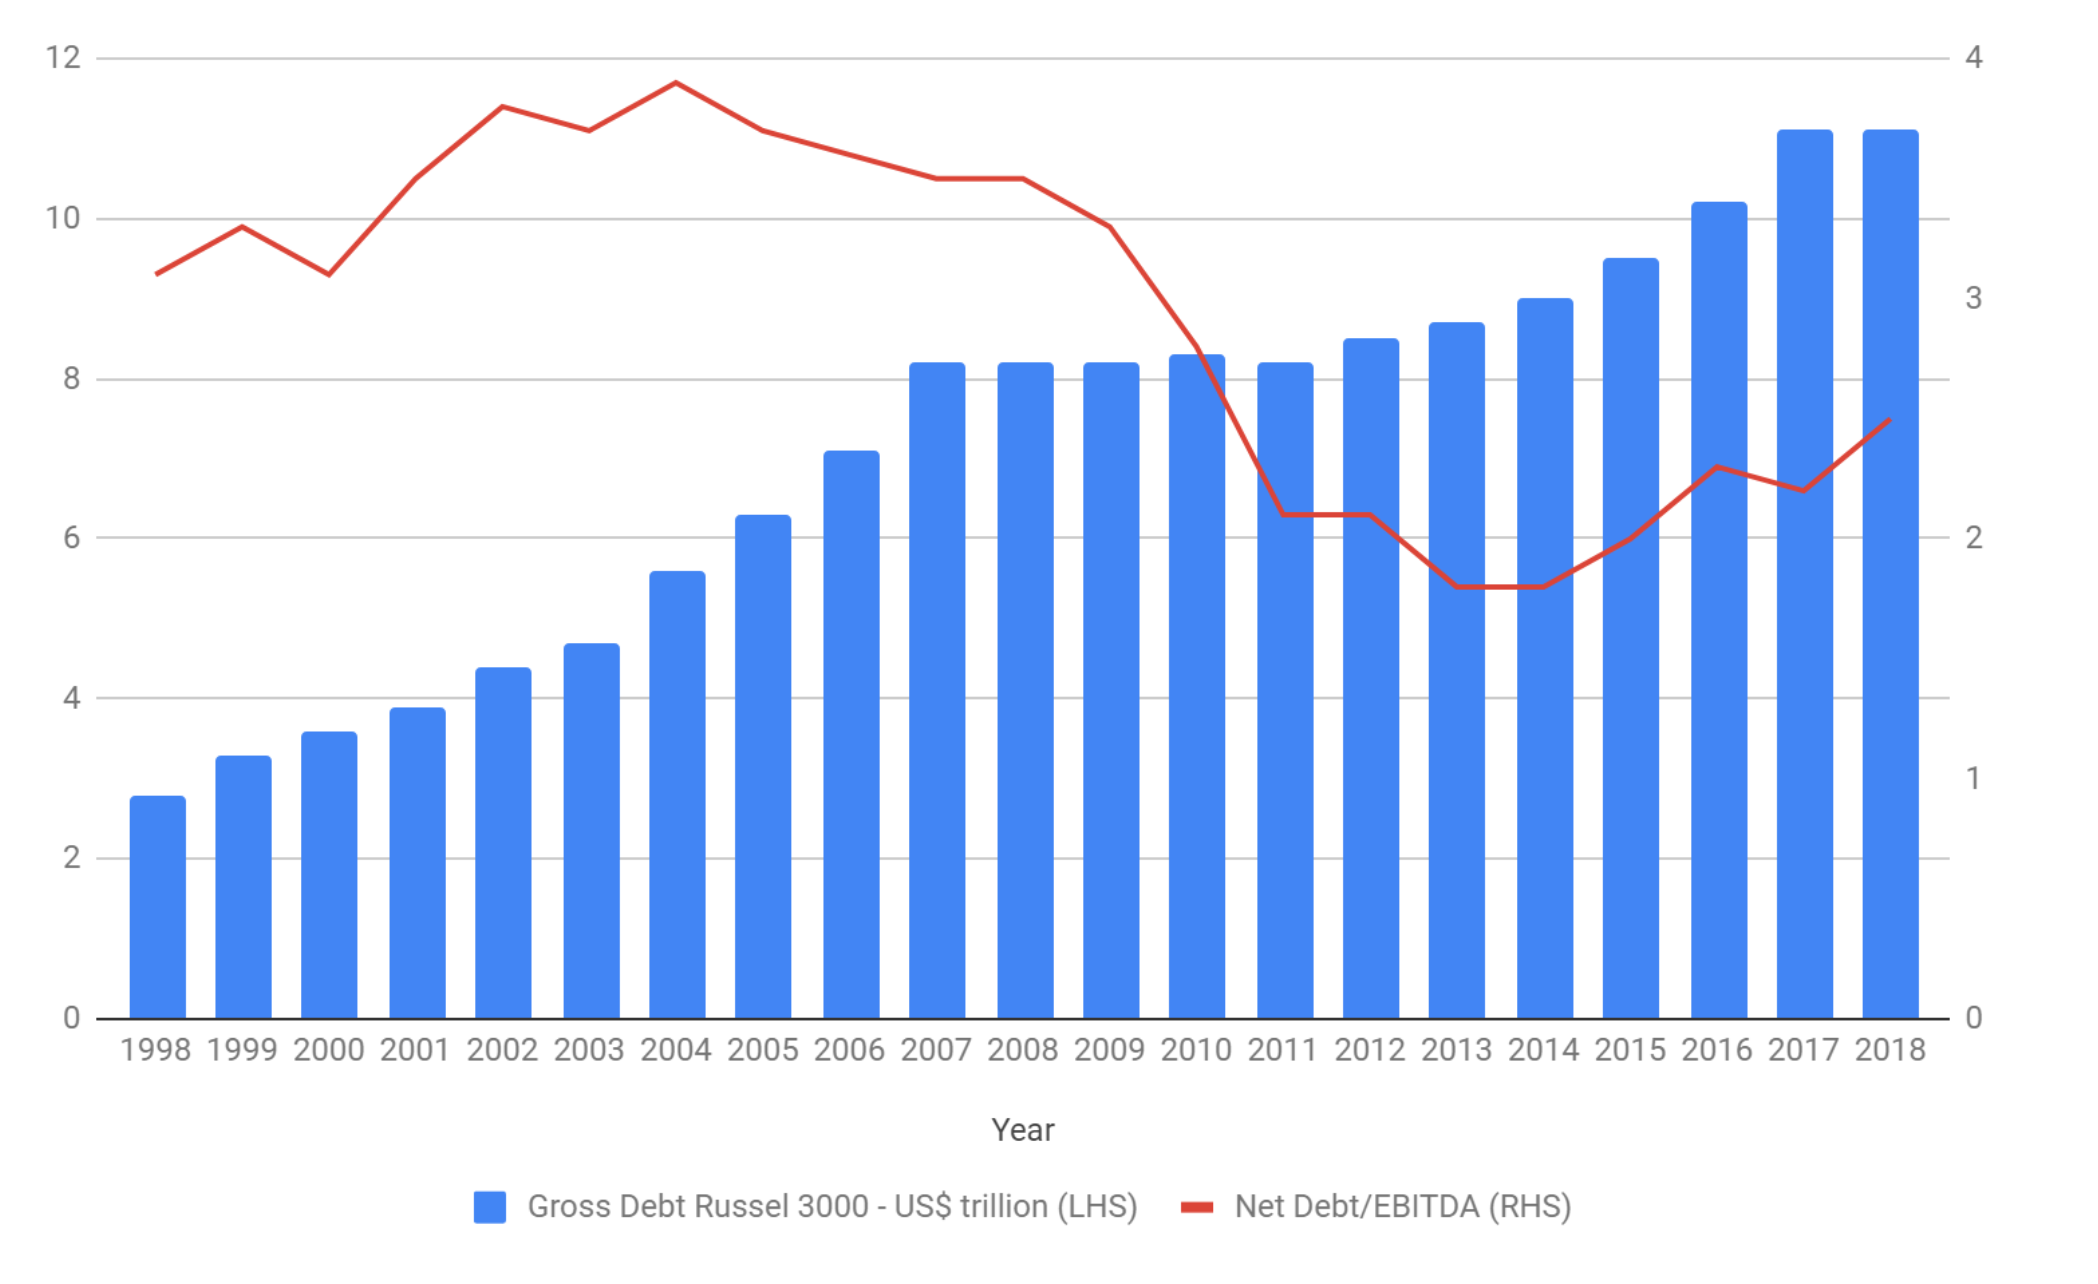
(Source: BitMEX Research, Corporate Data, Bloomberg)
(Note: The figures consist of aggregate data for all the Russell 3000 companies.)
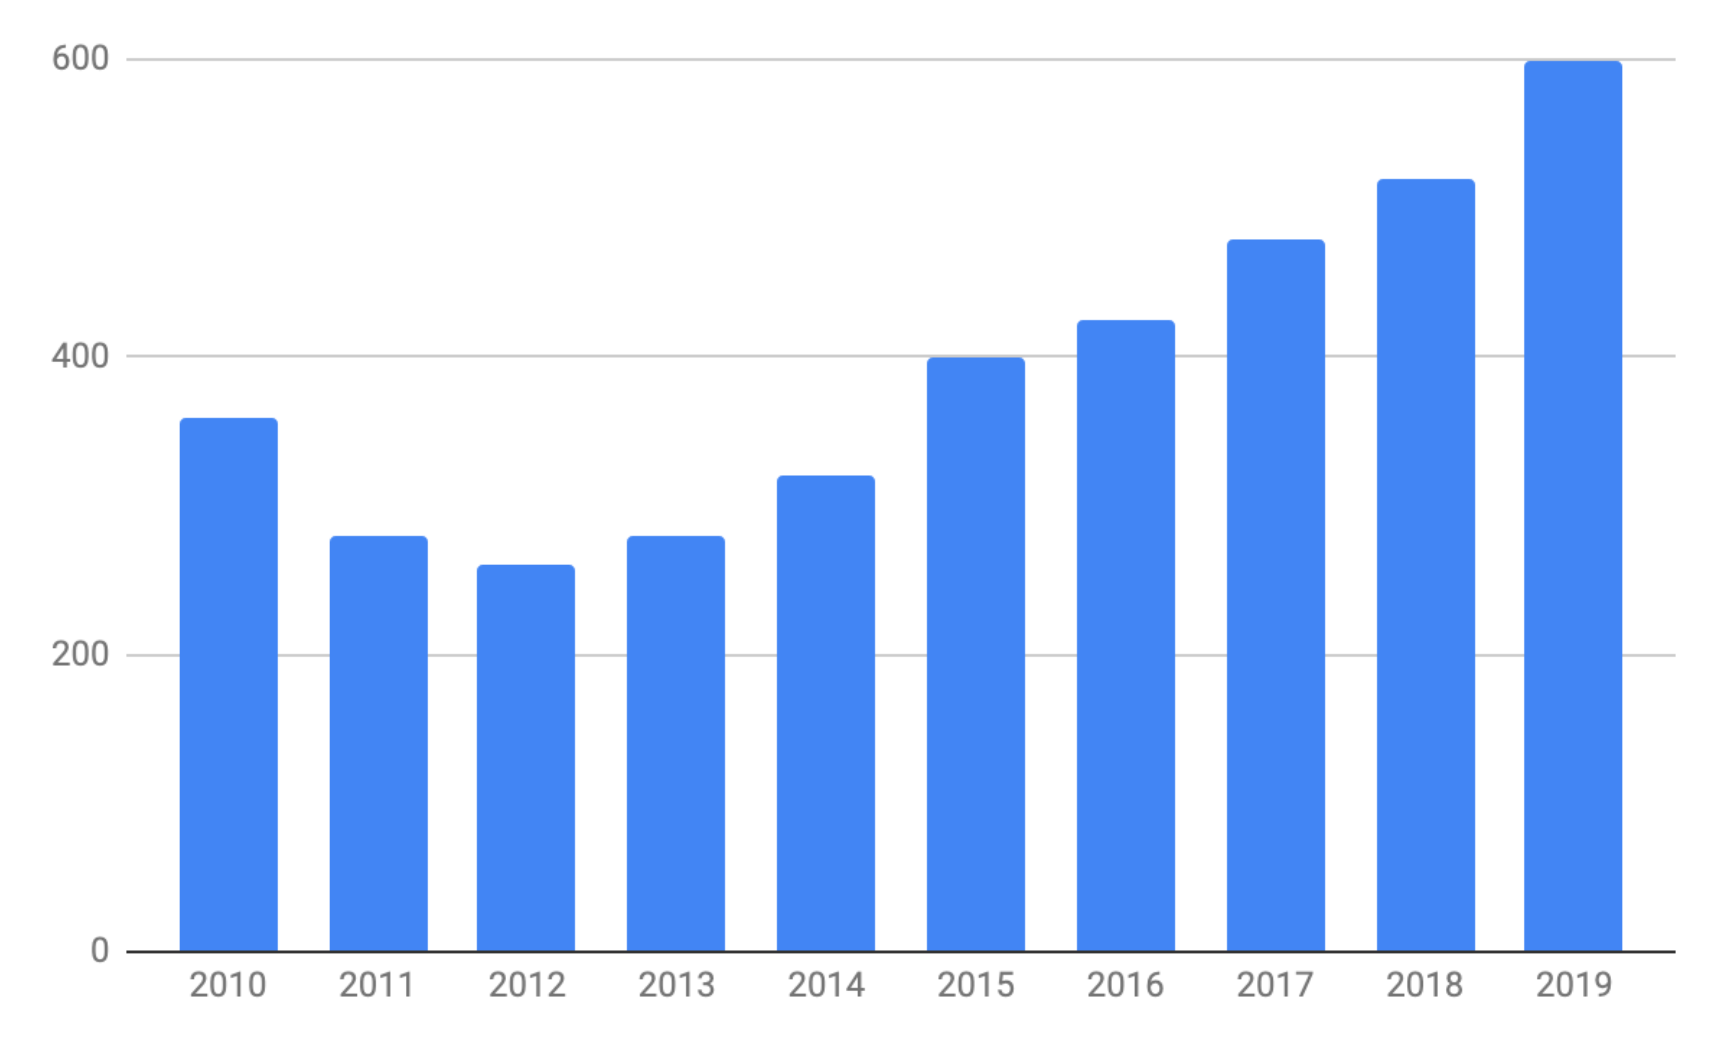
There is a considerable volume of corporate bonds set to mature in the coming years. This could exacerbate the impact of any liquidity crisis or stress in the fixed income sector. As our analysis shows (Figure 12), US$ 880 billion of corporate debt in the US will mature in 2019.
Figure 12 – Corporate Bond Maturity Wall – US$ billion
(Source: BitMEX Research, Bloomberg)
(Note: Figures are based on a database of around 6,400 US corporate bonds with an aggregate amount outstanding of US$5.7 trillion.)
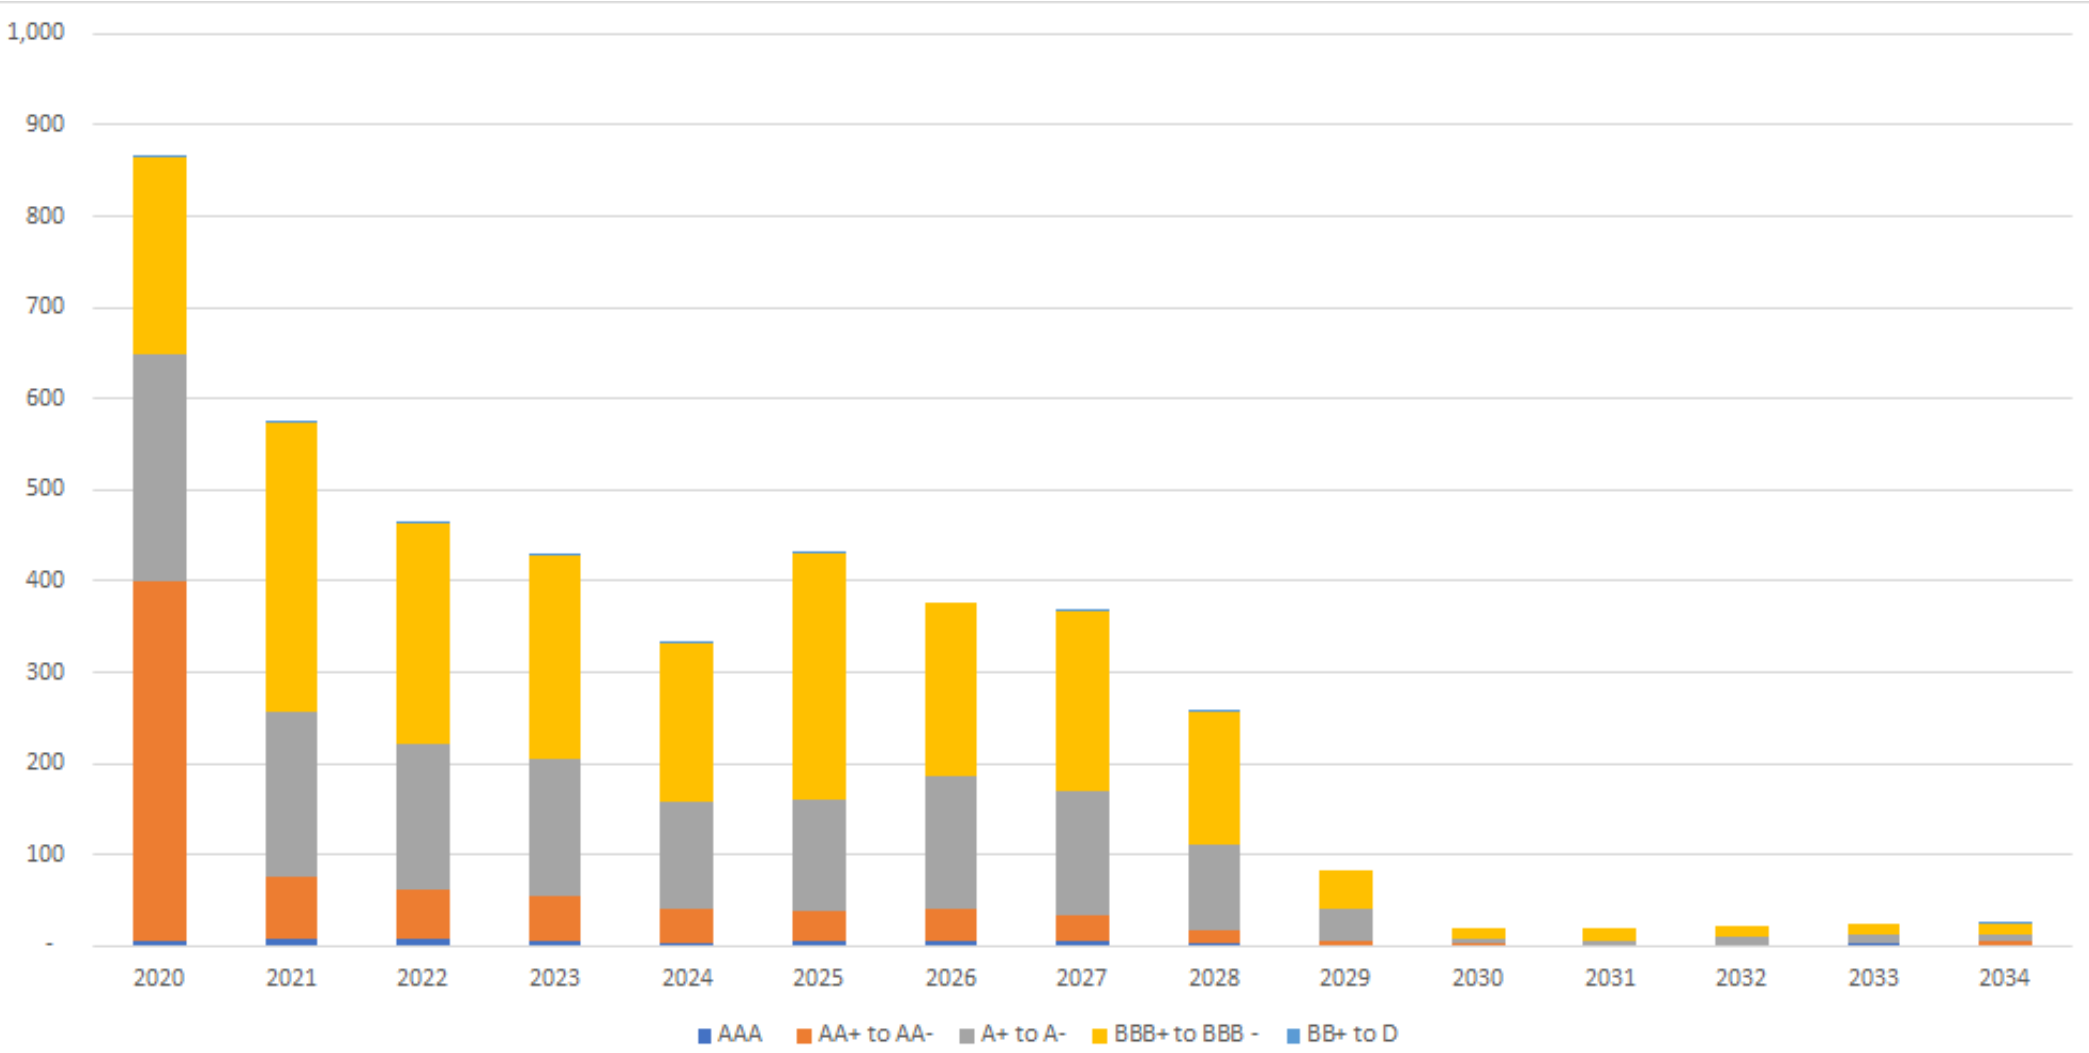
Perhaps the most alarming indicator is the quality of the corporate debt. Figure 13 shows the credit rating distribution of the outstanding investment grade corporate debt over time. At the end of 2018, almost 50% of the bonds had been rated at the lowest possible rating for investment grade securities, a far higher proportion than any time in the past 30 years. Figure 14 indicates that the situation from 2021 will get even worse, when the overwhelming majority of corporate debt maturing will be at the lowest investment grade rating.
Figure 13 – S&P Credit Rating Distribution of US Corporate Bonds Over History
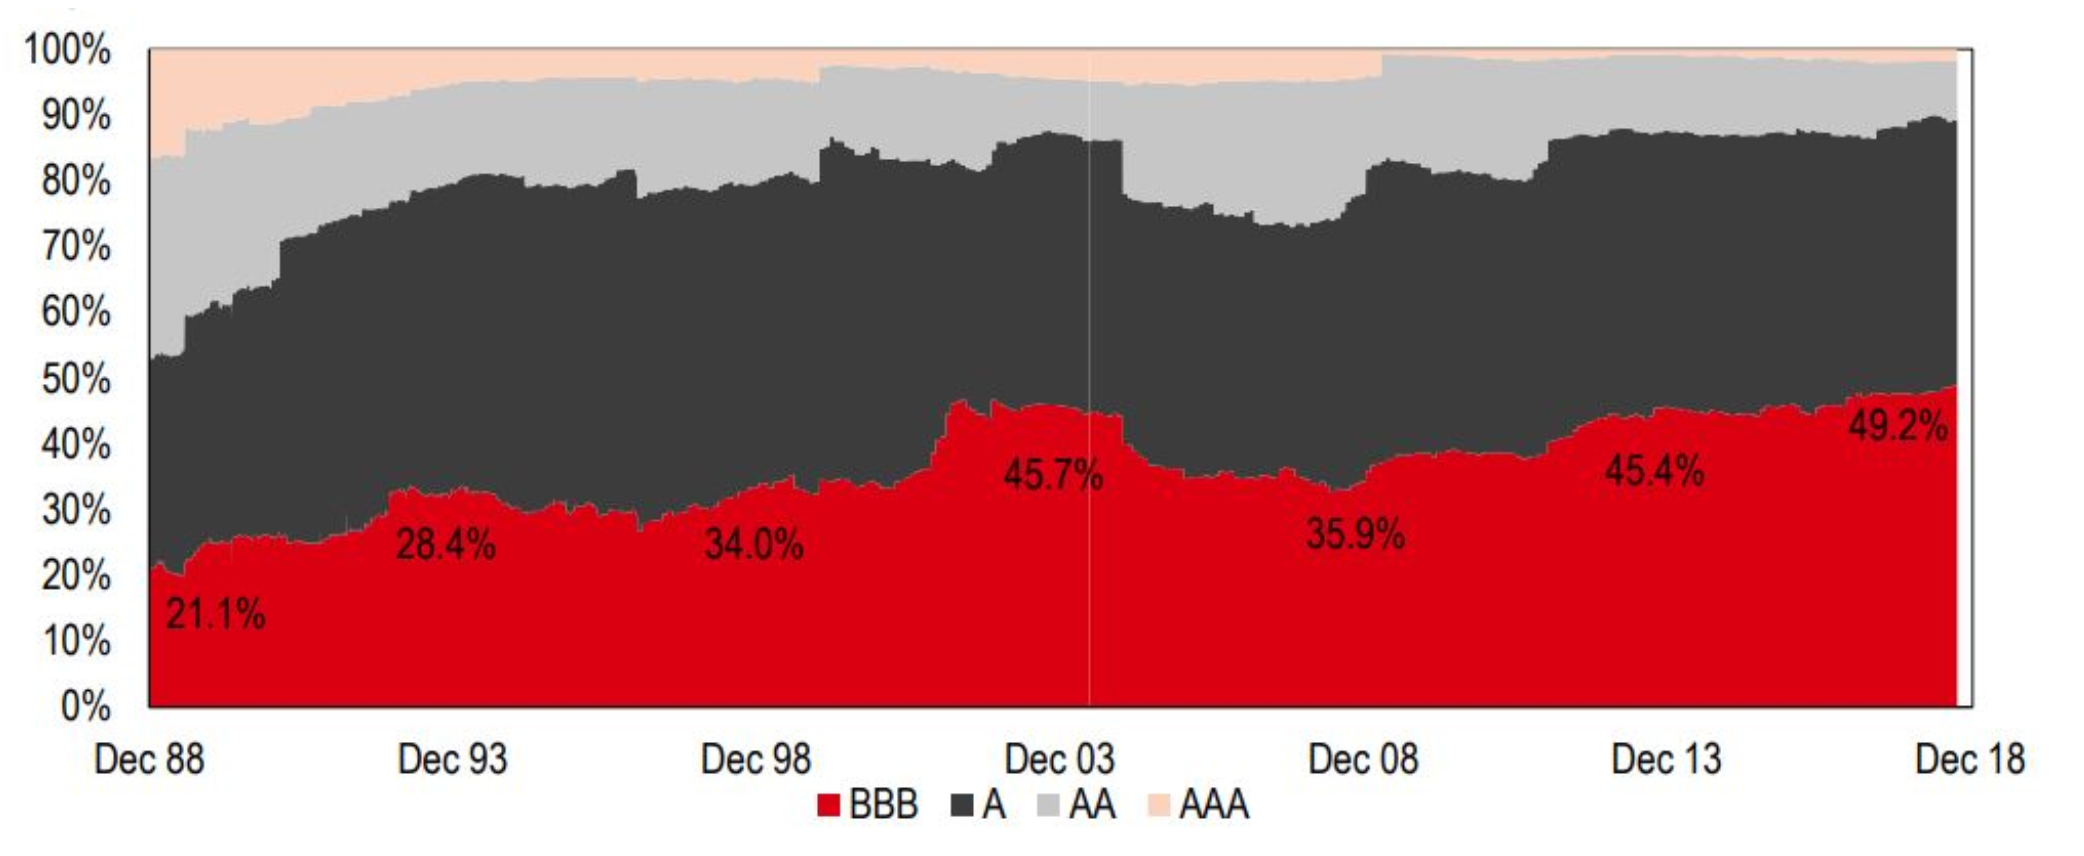
(Source: Bloomberg, HSBC USD IG index constituents, including financial and non financial companies)
Figure 14 – S&P Credit Rating Distribution of US Corporate Bonds Outstanding By Maturity
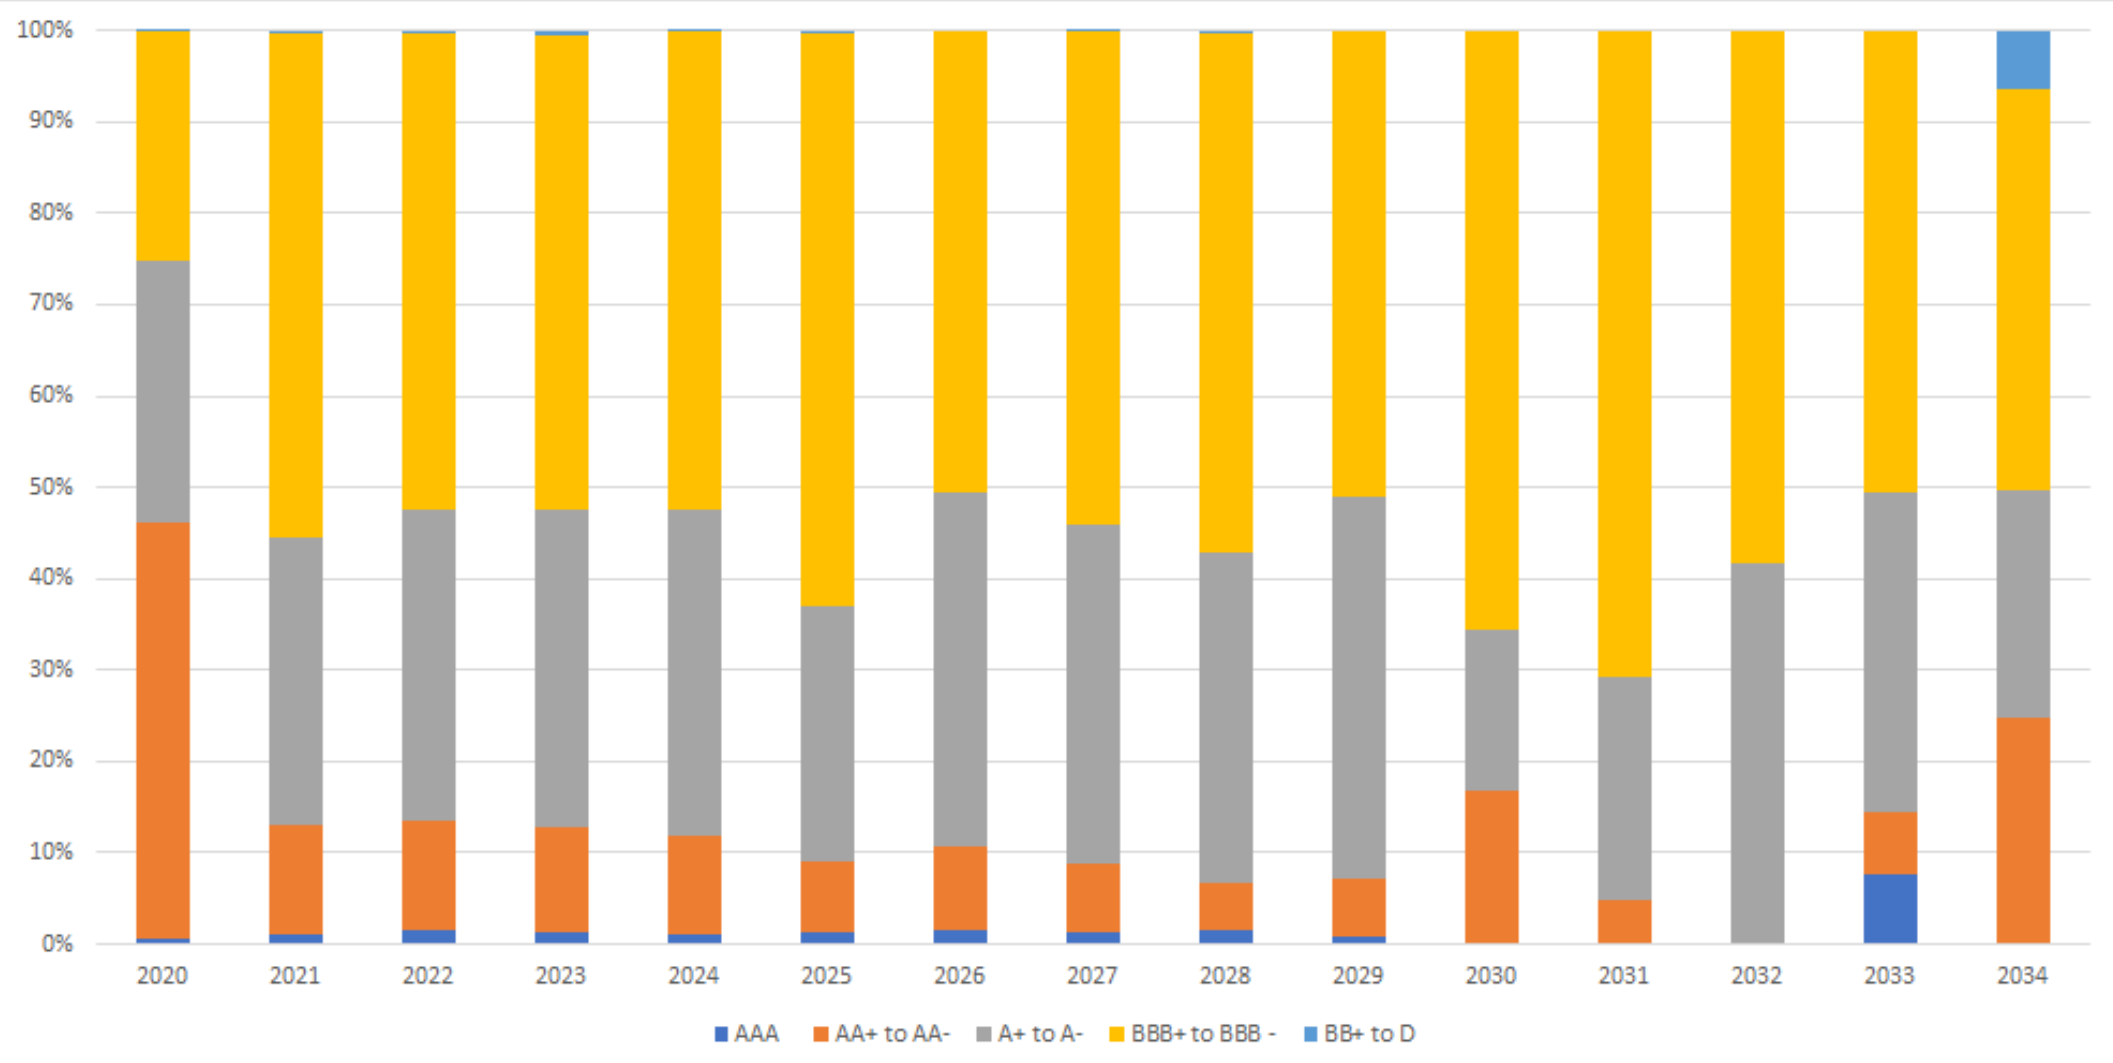
(Source: BitMEX Research, Bloomberg)
(Note: Figures are based on a database of around 6,400 US corporate bonds with an aggregate amount outstanding of US$5.7 trillion.)
Evaluating the credit quality of some of the less conventional debt vehicles mentioned above, is more challenging. However, a recent report from Moody’s indicated that there has been a significant deterioration in the level of protection for investors in the leveraged loans market, as Figure 15 below illustrates.
Figure 15 – Moody’s Assessment Of The Covenant Quality For Leveraged Loans (US & Canada)
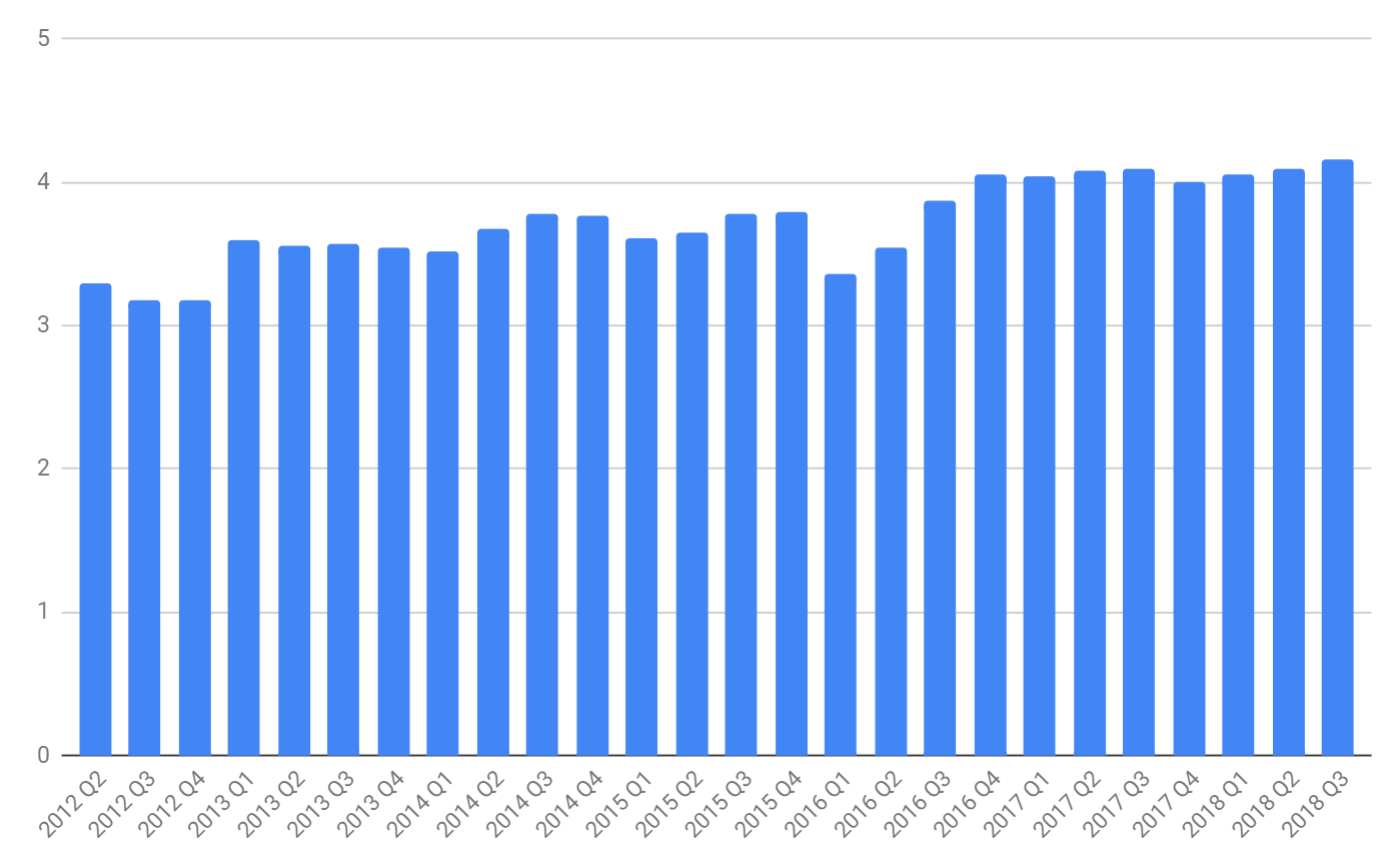
(Source: Moody’s, Bloomberg)
(Note: 5.0 is the weakest score, 1.0 is the strongest.)
Figure 16 – Average Total Debt To EBITDA Multiple Of Private Equity Deals
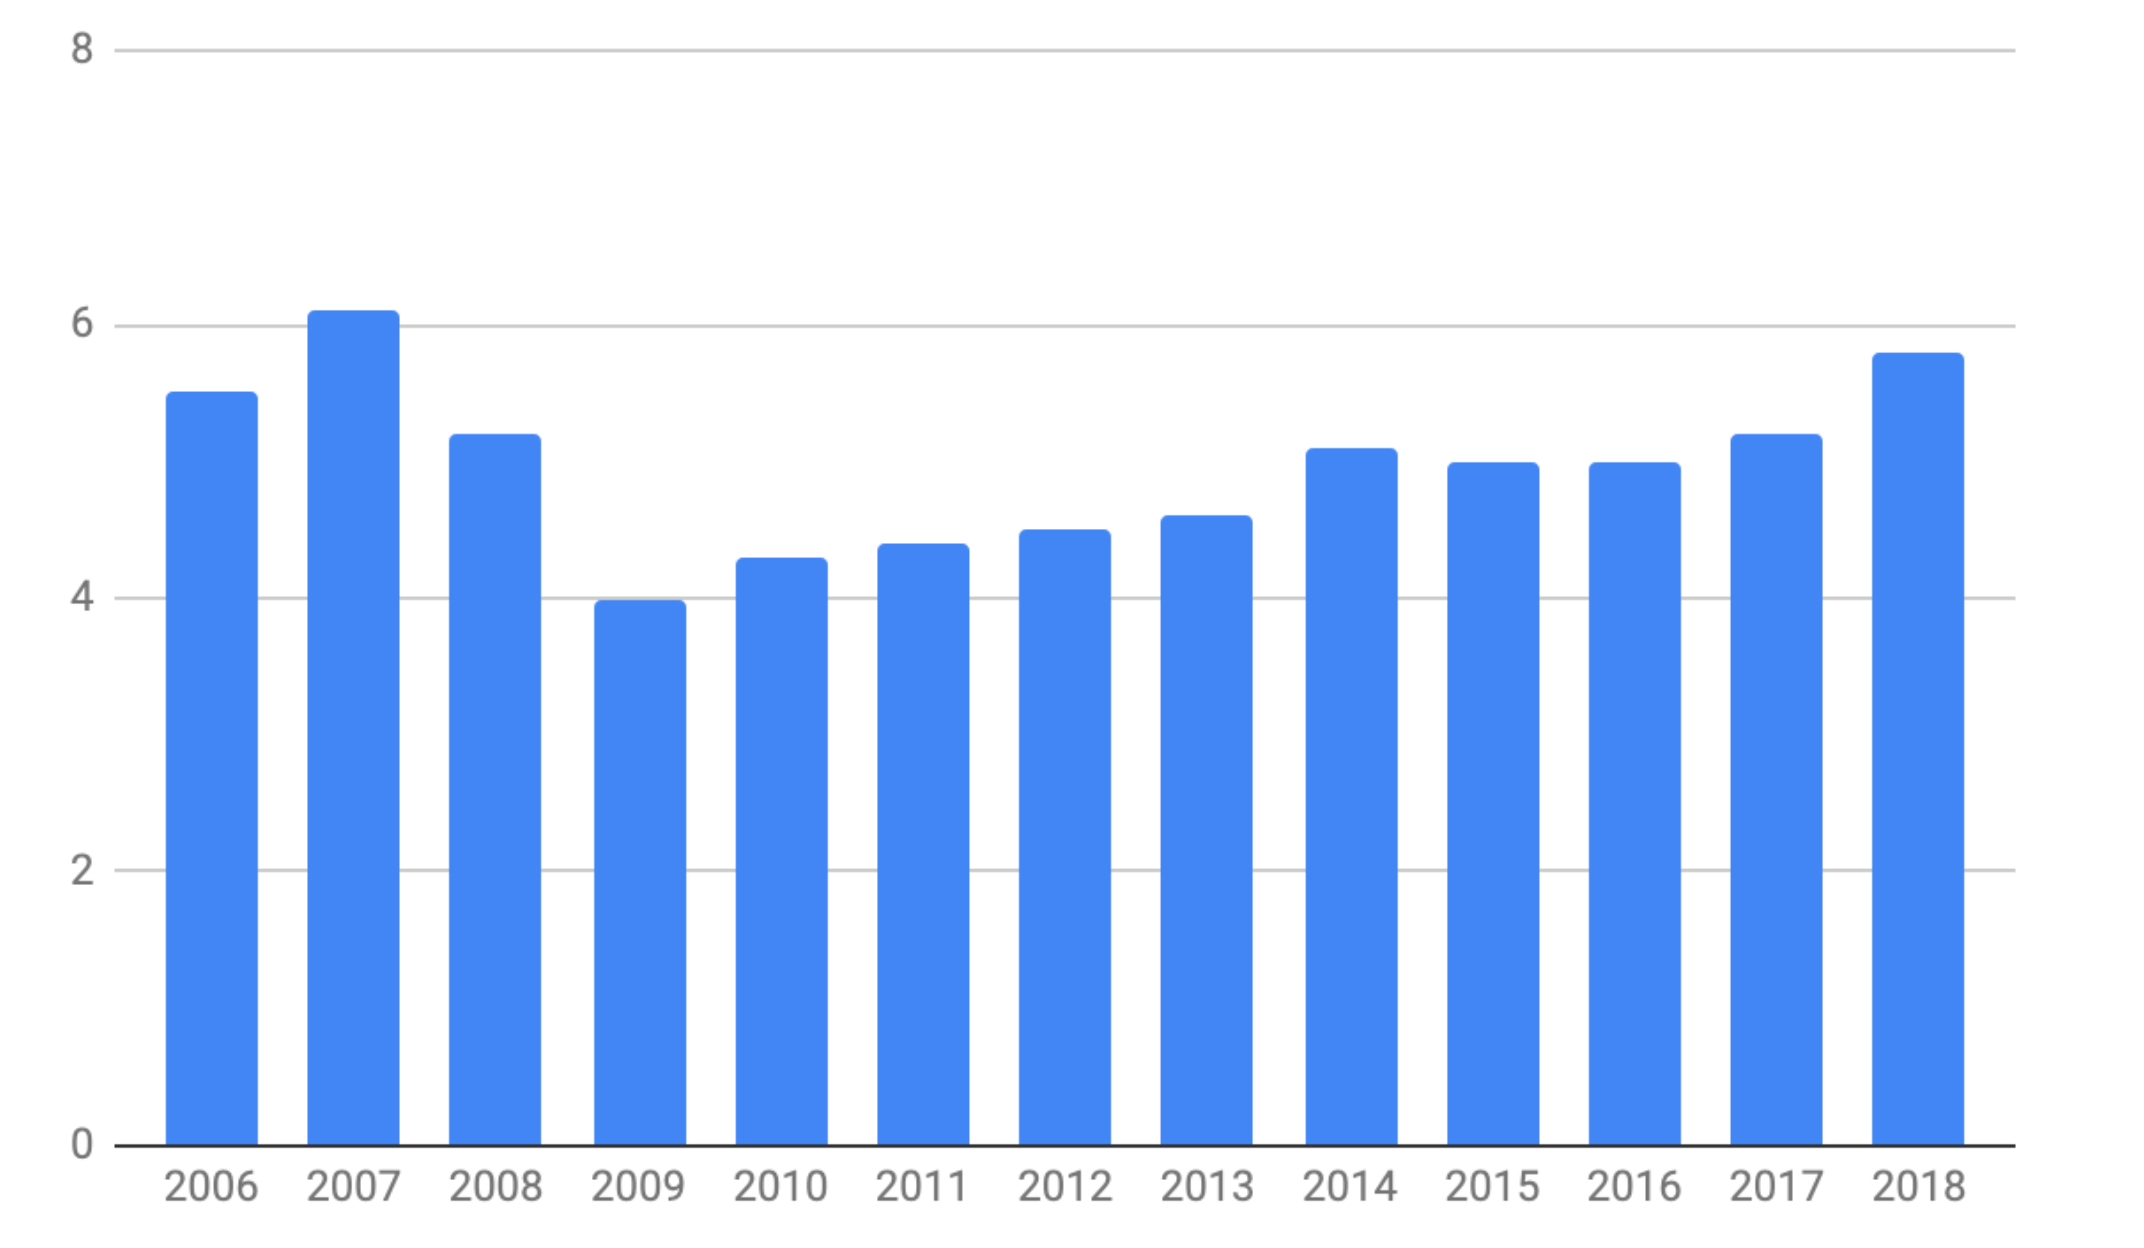
(Source: S&P, FT)
Low Volatility Environment
In our view, the unconventional monetary policies in advanced economies have squeezed investment returns and volatility, all while reducing borrowing costs; this has created an incentive for asset managers to use more leverage and take on more risk. At the same time the same policies have encouraged corporates to take on more debt. It is the fixed income sector, more than any other, which has been impacted by this low volatility. “Risk Parity” type investment strategies have become increasingly popular, where funds manage risk by constructing portfolios according to the risk (volatility) of each asset class and then using leverage to increase returns. The leverage mitigates the impact of lower returns from the higher weighting to the lower risk assets. This typically involves a larger weighting to fixed income, rather than equities, while incorporating more leverage to offset the low returns of these supposedly lower risk assets.
In February 2018, there was a sharp increase in volatility as the VIX skyrocketed and investment strategies focused on shorting the VIX, such as the Velocity Shares Daily Inverse VIX ETN, plummeted in value to almost zero. This was discussed in the March 2018 edition of the BitMEX Crypto Trader Digest. The victims of this were a small number of opportunistic investors looking for easy returns and the impact of the “volocaust” was limited on the rest of the financial system. However, in a way, the February 2018 event was a microcosm for what is happening more generally in fixed income markets. This time the more mainstream investors, are taking advantage of artificially low volatility and cheap borrowing costs. At some point the market will correct, and the impact of this will be far greater than in February 2018, when a multi-trillion dollar asset class unwinds, rather than one only worth several hundred million dollars.
The sequence of events can be described as follows, with various different factors contributing to exacerbate risk:
- Some catalyst occurs, causing a sharp increase in volatility.
- Investors will need to de-risk their portfolios, concentrating first in the most liquid markets, fixed income.
- In the most liquid markets, machines dominate trading and machines are likely to all withdraw liquidity at the same time.
- Fixed income markets become volatile, illiquid and dysfunctional, as investors rush for the exit.
- Securitised bond-based assets, such as CLOs and Bond ETFs, trade at a significant discount to their net asset values.
- The contagion spreads across other liquid asset classes, such as equities.
- Over the coming years the newly-established components of the debt machine begin to dry up; corporates struggle to refinance and the economy suffers.
Of course we do not know what will be the main catalyst leading to increased volatility. It could be a geopolitical event, excessive levels of emerging market US Dollar-based debt, high levels of leverage in the Chinese asset management industry, passive ETFs, high frequency traders, the contraction of central bank balance sheets too quickly, a large unexpected corporate bankruptcy, the Eurozone debt crisis, even a catastrophic consensus bug in Bitcoin causing volatility ect ect…
The point is, that whatever the particular event is, it doesn’t really matter. What does matter is the inherent instability and fragility of the financial system, driven by artificially low volatility and excessive leverage. Many may point their fingers at the particular catalyst after the event and blame it for the crisis, but that could be somewhat intellectually dishonest.
Conclusion
Banks are more crucial to the financial system and society than asset managers. If asset managers come under pressure, whilst some high net worth individuals may experience a write down in their assets; retail and corporate deposits should be safe; and therefore the coming crisis could be less intense than 2008. However, critically, the potential for government intervention to mitigate the impacts of the crisis may be more limited than in 2008.
Firstly and most obviously, the toolkit available to central bankers has been greatly diminished, with interest rates already low and their balance sheets already large. Secondly, and perhaps more importantly, is the political side of things. One cannot know for sure, but the typical people behind the Trump, Brexit, or the Yellow Vest movement may not be supportive of certain kinds of government intervention in financial markets.
In today’s more “populist” political climate, it may be more challenging to justify programs such as quantitative easing or other programs designed to increase asset prices at the relative expense of those earning median type salaries, who don’t own a large pool of financial assets. Therefore, in the next crisis, managing the perceived risk of a “political uprising” could significantly reduce the scope of action central bankers may be willing to take.
Keep in mind, there was also political opposition to central bank policy in the aftermath of 2008, with the rebellion peaking in around 2011. Another key difference this time is that available tools to those leading the rebellion then, such as social media, are now more developed. Political uncertainty in the West seems to have increased since 2008. If this uncertainty begins to interact with financial volatility, risks could be exacerbated.
As for when such a crisis will occur, we obviously do not know. In our view, the charts in this report identify a problem, but they do not seem to suggest that we are necessarily right on the precipice of a major crisis; it could be several years away. As for how to profit from such events, this is perhaps even more challenging than predicting their timing. Maybe one could construct a portfolio of VIX calls, long dated corporate bond ETF puts, index-linked government bonds, hedge funds specializing in volatility, gold and maybe to a lesser extent, even Bitcoin. Again, although one cannot know when these events will occur, perhaps now is a time to adjust one’s investment portfolio.