Abstract: This piece explores why China appears to dominate the Bitcoin mining industry. Chinese Bitcoin mining could be the inadvertent beneficiary of a massive boom and over-investment in hydro power, linked to aluminium production, in remote regions in the last 10 years.
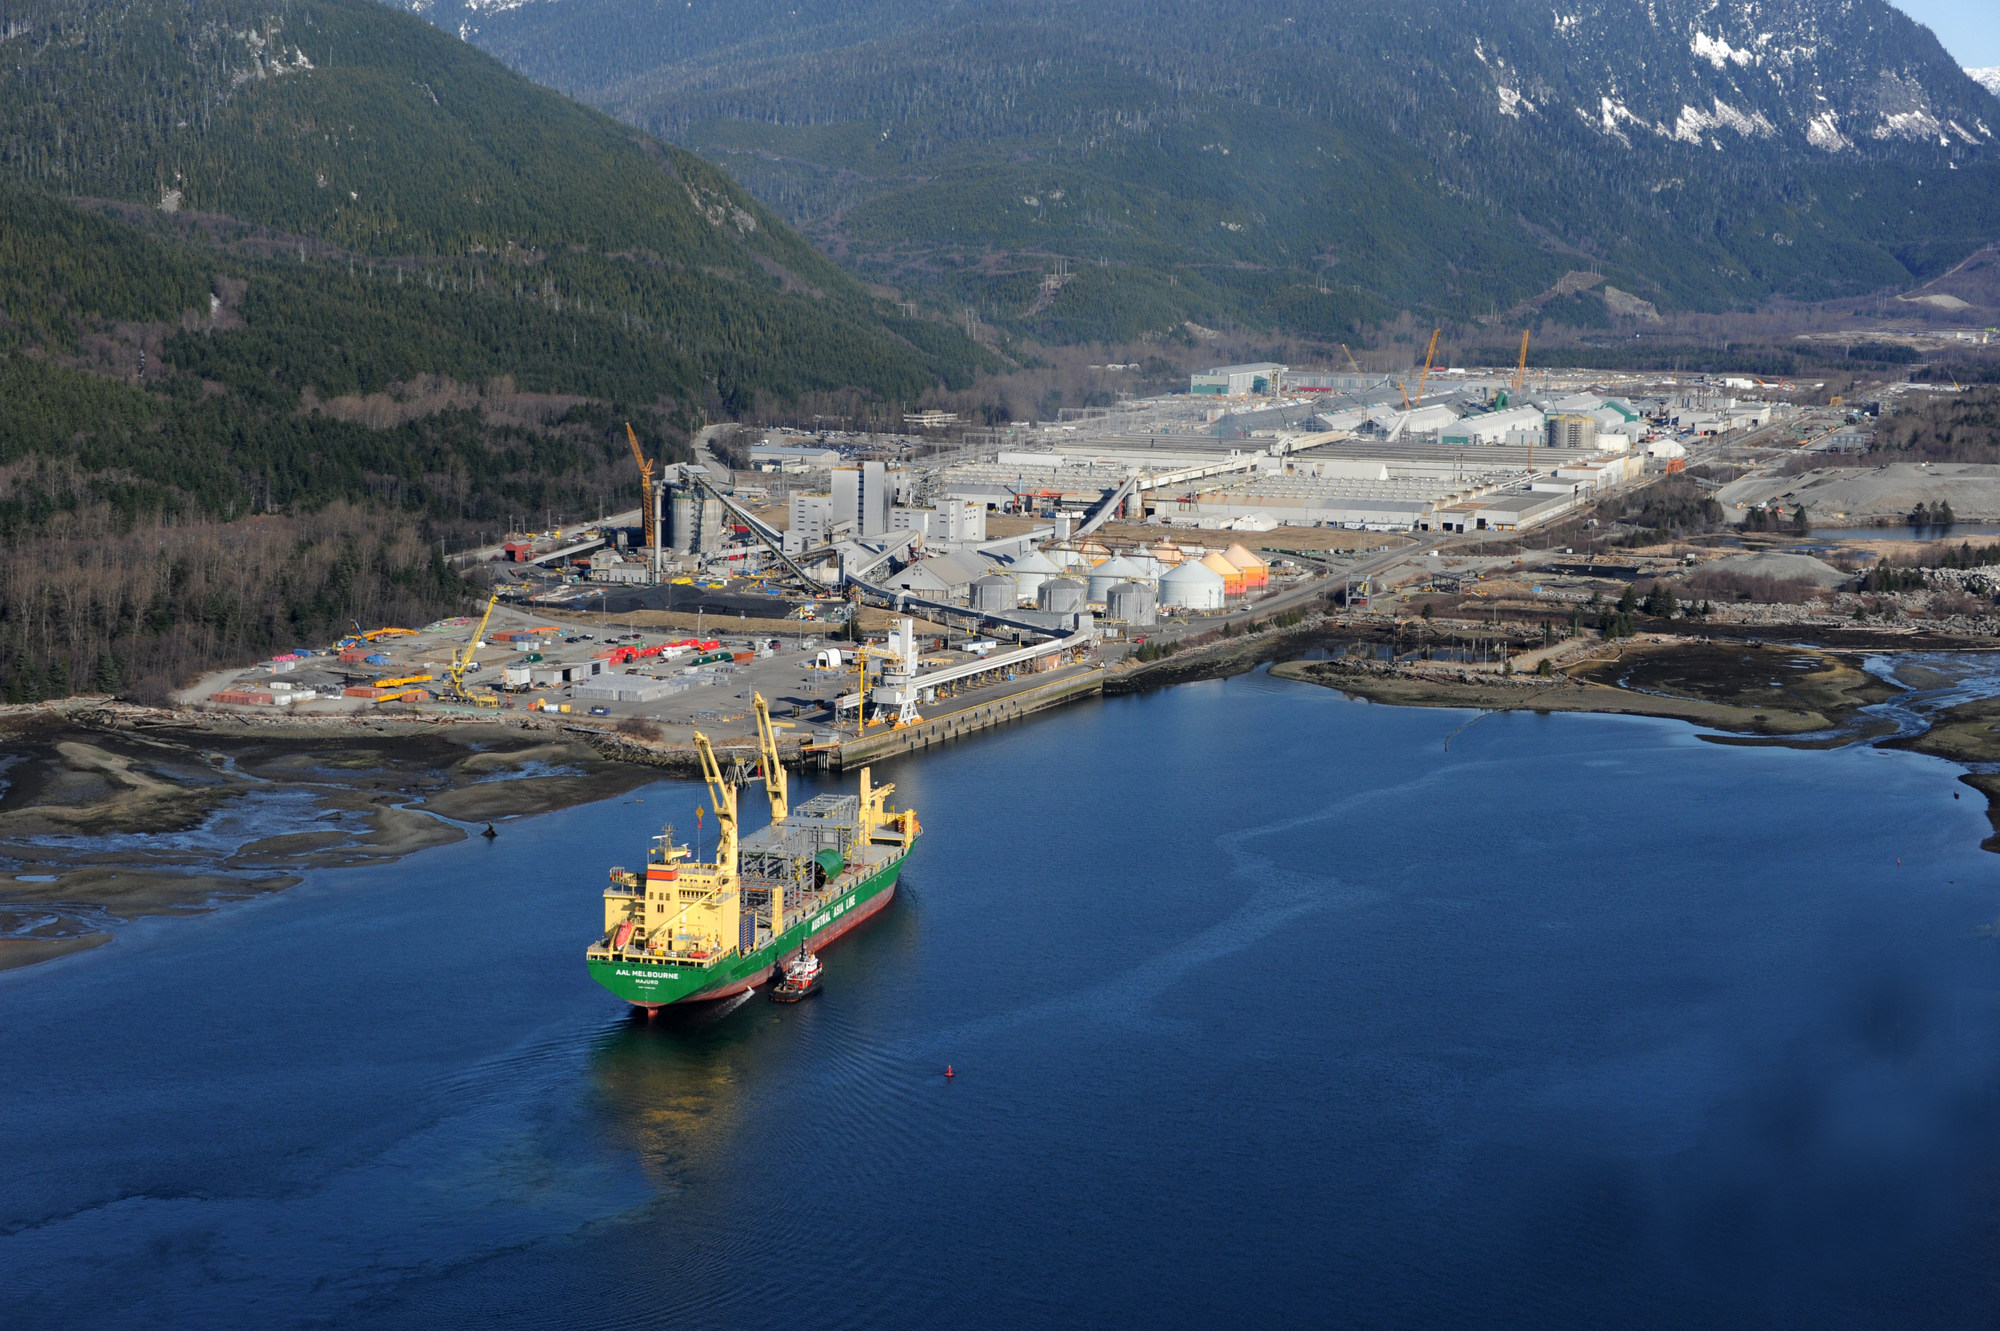
Rio Tinto’s modernised Kitimat hydro-powered aluminium smelter in Canada. (Source: Rio Tinto)
Please click here to download the pdf version of this report
China globally dominates most energy related fields
One question often asked by some in the Bitcoin community is Why are so many mining pools and miners based in China?
The most basic response to this question is: why not? China is not just some random country. It is a global economic powerhouse, dominant in most industrial and energy sectors. For instance:
- China accounts for roughly 68% of the world’s imports of iron ore.1
- China produces roughly 54% of the world’s aluminium.2
- China consumes roughly 50% of the world’s coal.3
- Of the 60 nuclear plants under construction across the world, 22 are in China, and China has accounted for about 183% of the world’s growth in nuclear-power consumption in the last 10 years (this number exceeds 100% because Japan shut down its reactors following the Great East Japan earthquake of 2011).4
- China consumes about 30% of the world’s hydro power and accounts for 76% of the world’s growth in hydro-power consumption in the last 10 years3
China is unquestionably already the dominant driver of the global energy industry, and perhaps it is no surprise that China is dominant in Bitcoin mining, an industry that is strongly related to energy generation. Indeed, new, efficient power plants, particularly in the field of hydro power, may partially explain China’s dominance in Bitcoin mining.
Reasons typically cited for Chinese dominance
One of the largest and most discussed advantages for China is the local infrastructure and expertise that enables mining farms to quickly set up as soon as the mining chips are available. This setup process is said to be much slower in other regions. Being able to quickly set up can be crucial, as new more efficient chips are developed all the time. China also has geographical proximity to where the specialist chips are manufactured.
Another alleged advantage is corruption in the power industry in China, with some Bitcoin miners perhaps able to pay power-plant owners for the right to place mining equipment inside or near to the power facilities.
Other factors may also contribute to China’s dominance, but these are not widely discussed within the Bitcoin community. Most notable is China’s surplus captive hydro-power capacity, constructed for the loss-making aluminium industry.
China’s hydro boom
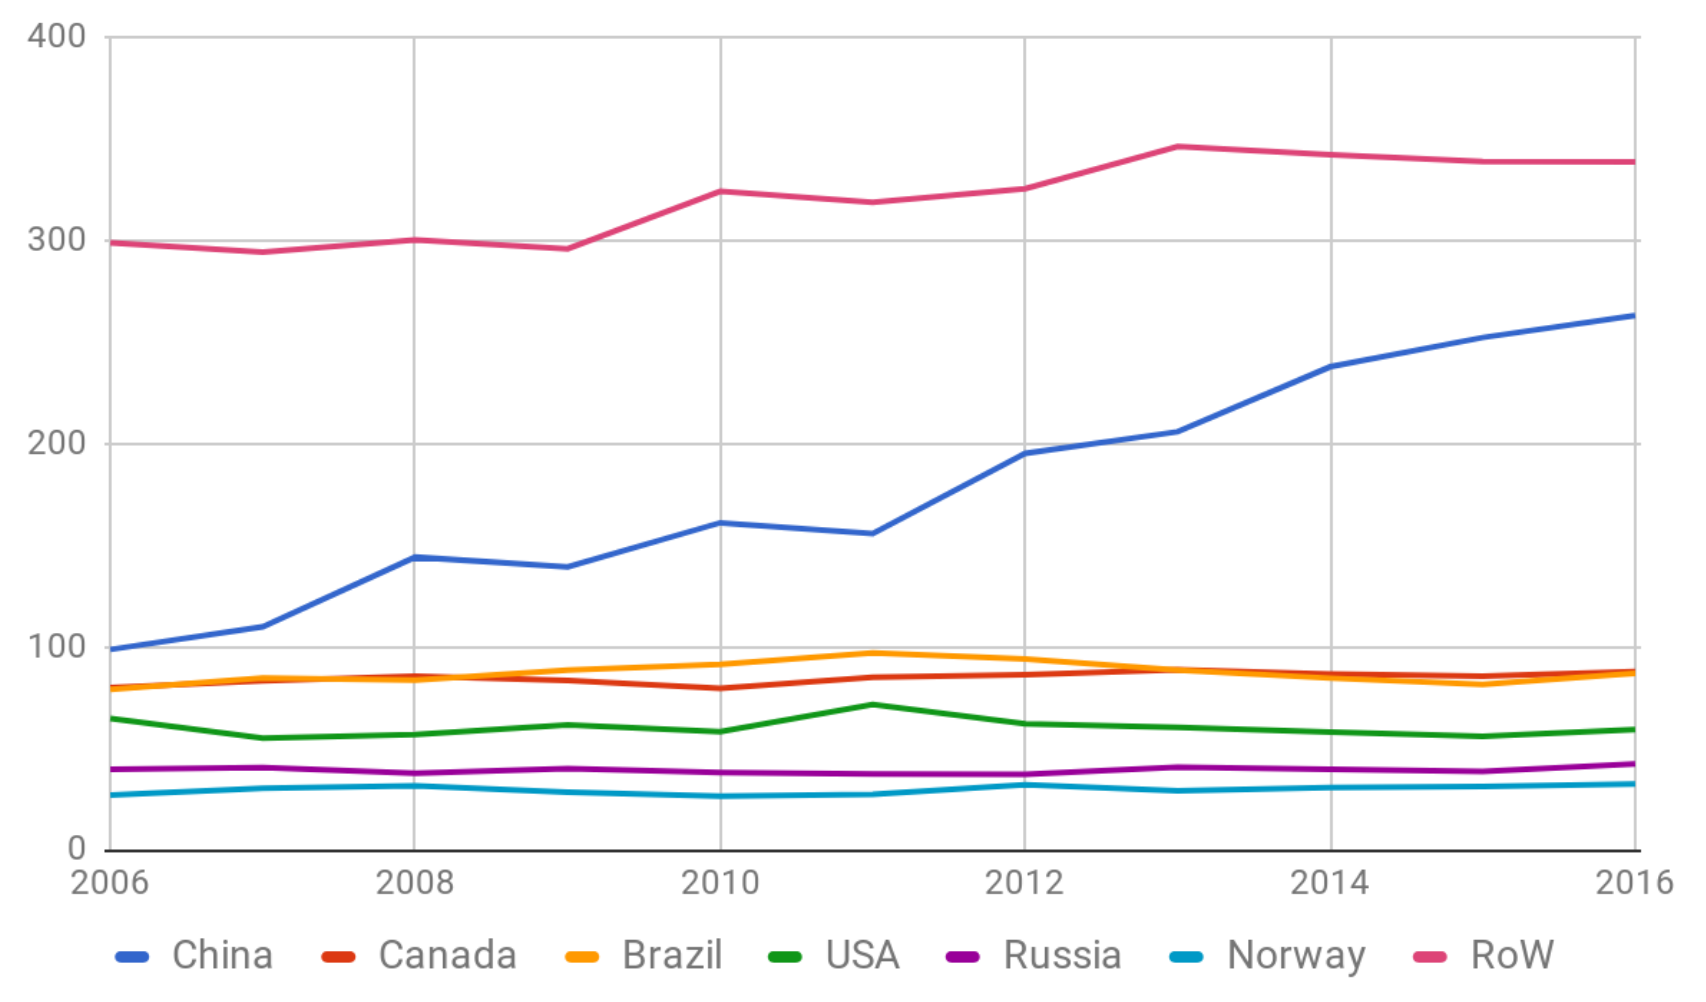 Global hydro-power consumption by region in units of million tonnes of oil equivalent from 2006 to 2016. (Source: BP Statistical Review of World Energy June 2017)
As the chart above shows, China has been the dominant driver in world hydro-power growth in the last 10 years. Hydro power is a good energy source for Bitcoin mining, since the marginal cost of power generation is very low, with most of the costs related to the initial investment. In addition, hydro power is reliable and stable.
The largest of China’s hydro-power facilities under construction is the Baihetan project on the Jinsha River. The facility will have 16 turbines of 3.6 TWh each, producing a total of 57.6 TWh. The project began in 2008 and is expected to be complete in 2021. The Wudongde project on the Jinsha River in the southwest is the most recent large project and will provide 36.7 TWh of capacity. It began construction in 2014, and the first generator is scheduled to be complete in 2018. The whole Wudongde project is expected to be complete in 2020. It will be the sixth-largest hydro-power facility in the world.
As a point of comparison, the Three Gorges Dam, the world’s largest hydro-power project (with the possible exception of the Itaipu Dam in South America), produces around 100 TWh.
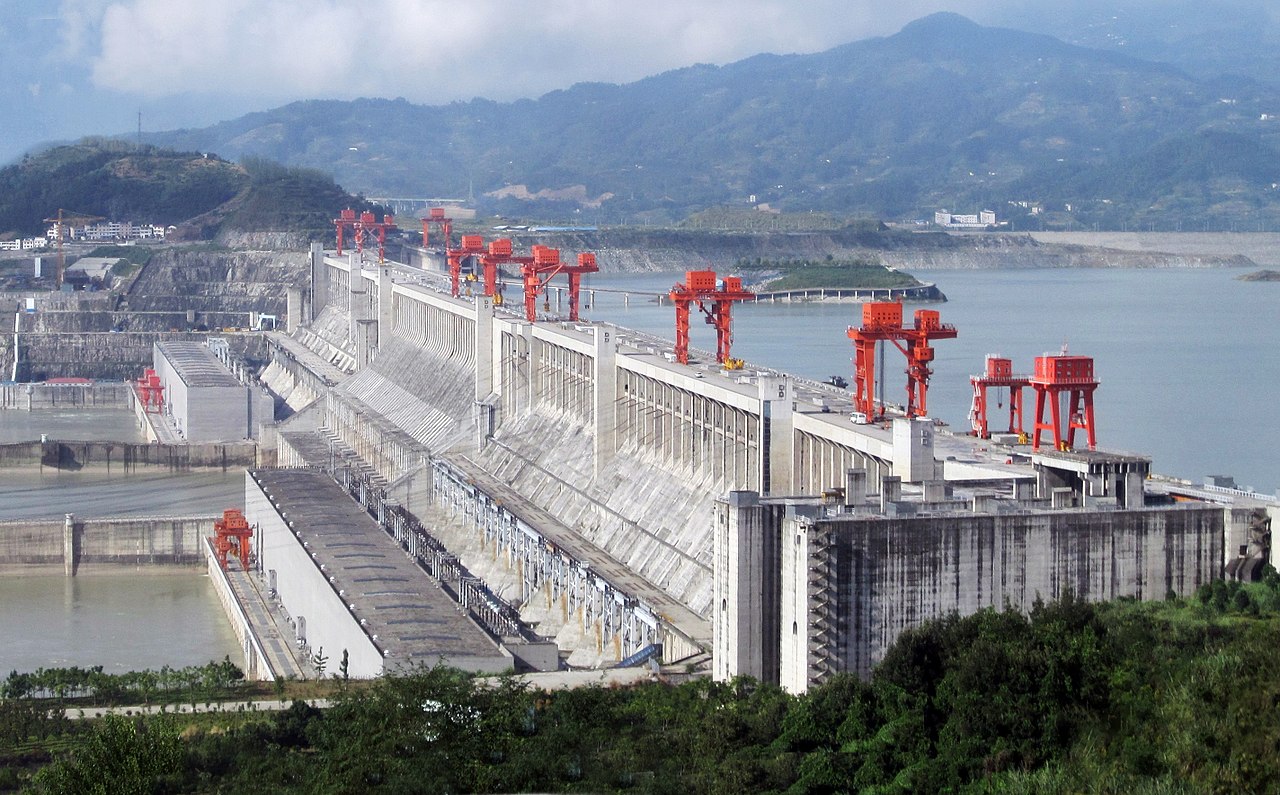
The Three Gorges Dam on the Yangtze River in 2009. (Source: Wikipedia)
The projects mentioned above are far too large for Bitcoin mining. Bitcoin’s total electricity consumption is believed to be around 15 TWh.
In January 2017, China’s ministry of water resources issued guidelines on promoting the development of small hydro-power plants. The guidelines outlined plans to develop and grow the small-scale hydro-power industry in China by 2030. Because smaller facilities are more likely to power Bitcoin mines, this could be an interesting development.
Aluminium production
Typically, hydro power is associated with aluminium production. The Bayer process and the Hall-Héroult process, the principal industrial means of refining bauxite to produce aluminium, involve electrolysis and require a massive amount of electrical power. Steel making does not require electrical energy to the same extent.
Energy costs make up a significant proportion of the cost of producing aluminium, perhaps around 30% to 65% of the total, depending on the producer and market conditions.
In the competitive aluminium industry, it’s vital to keep costs as low as possible to remain competitive throughout the economic cycle. Canada is the number-two hydro-power producer in the world, behind China, and much of that country’s hydro power supports Rio Tinto’s (previously known as Alcan) aluminium refining.5 Similar to Bitcoin mining, aluminium smelting will follow the cheapest, most reliable energy source, which is often hydro power.
According to the International Aluminium Institute (IAI), about 80% of Canadian aluminium smelting uses hydro power. In China, only 10% of smelting relies on hydro power, with the remaining 90% powered by coal.6 Yet due to China’s massive scale, China’s 10% consumes roughly the same 50 TWh of hydro power as Canada’s 80%. Power plants constructed specifically for aluminium smelting are often called “captive plants”.
Over-investment in hydro power and the aluminium market cycle
One could argue that China has over-invested in the development of hydro power. In recent years, this investment has slowed down, as most major sites have been identified and explored. Despite this, China still commissioned more new capacity in 2016 than any other country.
Although aluminium is less vital for China’s hydro power infrastructure than it is elsewhere, it is still significant. China invested considerably in aluminium-related hydro power in 2011 to 2013, a period that was followed by significant weakening in the price of aluminium in 2014 and 2015, as the chart below shows. As a result of this price drop, many aluminium smelters became uneconomical and stopped production — and the associated captive hydro-power facilities often suffered from limited local demand for their electricity. Many of the facilities often had been constructed in remote rural regions whose infrastructure may have been unable to send the power to a major city, due to long distances and a lack of ultra-high-voltage (UHV) electricity transmission infrastructure in China.
Bitcoin mining may be one of the only suitable consumers of the energy in such circumstances. Without UHV lines, much energy is lost to resistance during electrical transmission. Bitcoin mining can, in theory, transfer the equivalent value of the energy to the main cities in the east of China, avoiding loss due to resistance in the lines. Bitcoin miners with access to this cheap electricity from captive plants may demand and receive lower prices of power than they could find in urban areas. Of course, this process only works if there is demand for Bitcoin in the cities, which in the last few years appears to have been true.
As the chart below shows, the price of aluminium has recently recovered, although this is partially due to China’s reduction of aluminium production by shutting down loss-making smelters.7 The Chinese government’s strategy is to reduce subsidies to loss-making heavy industries in order to shift the economy towards technology and consumer areas. This is also part of a wider push to protect the environment and improve the air quality in China.
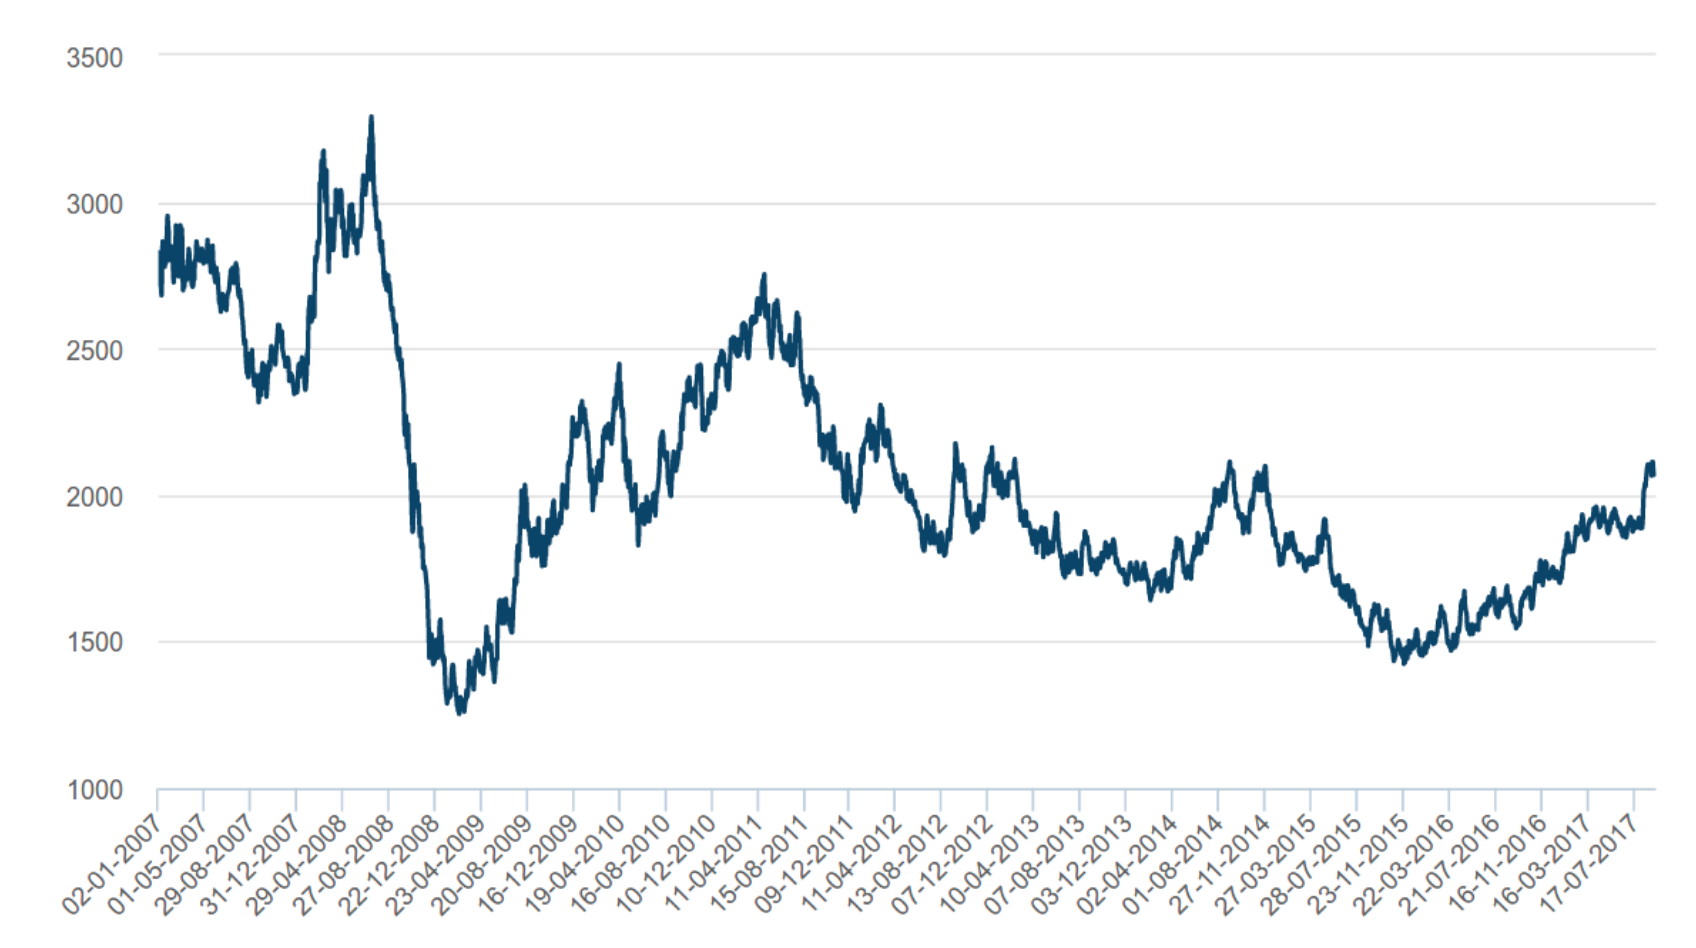
Aluminium spot price. (Source: London Metal Exchange)
Capacity utilization of aluminium producers
The chart below indicates that China has undergone a massive boom in aluminium production, from almost none of the global market 20 years ago to being globally dominant. Although production growth has slowed in recent years as a result of massive over-investment and significant under-utilisation, as the second chart illustrates. The third chart indicates the scale of the overcapacity in China, with China having the least utilisation apart from the United States, which is also reducing production.
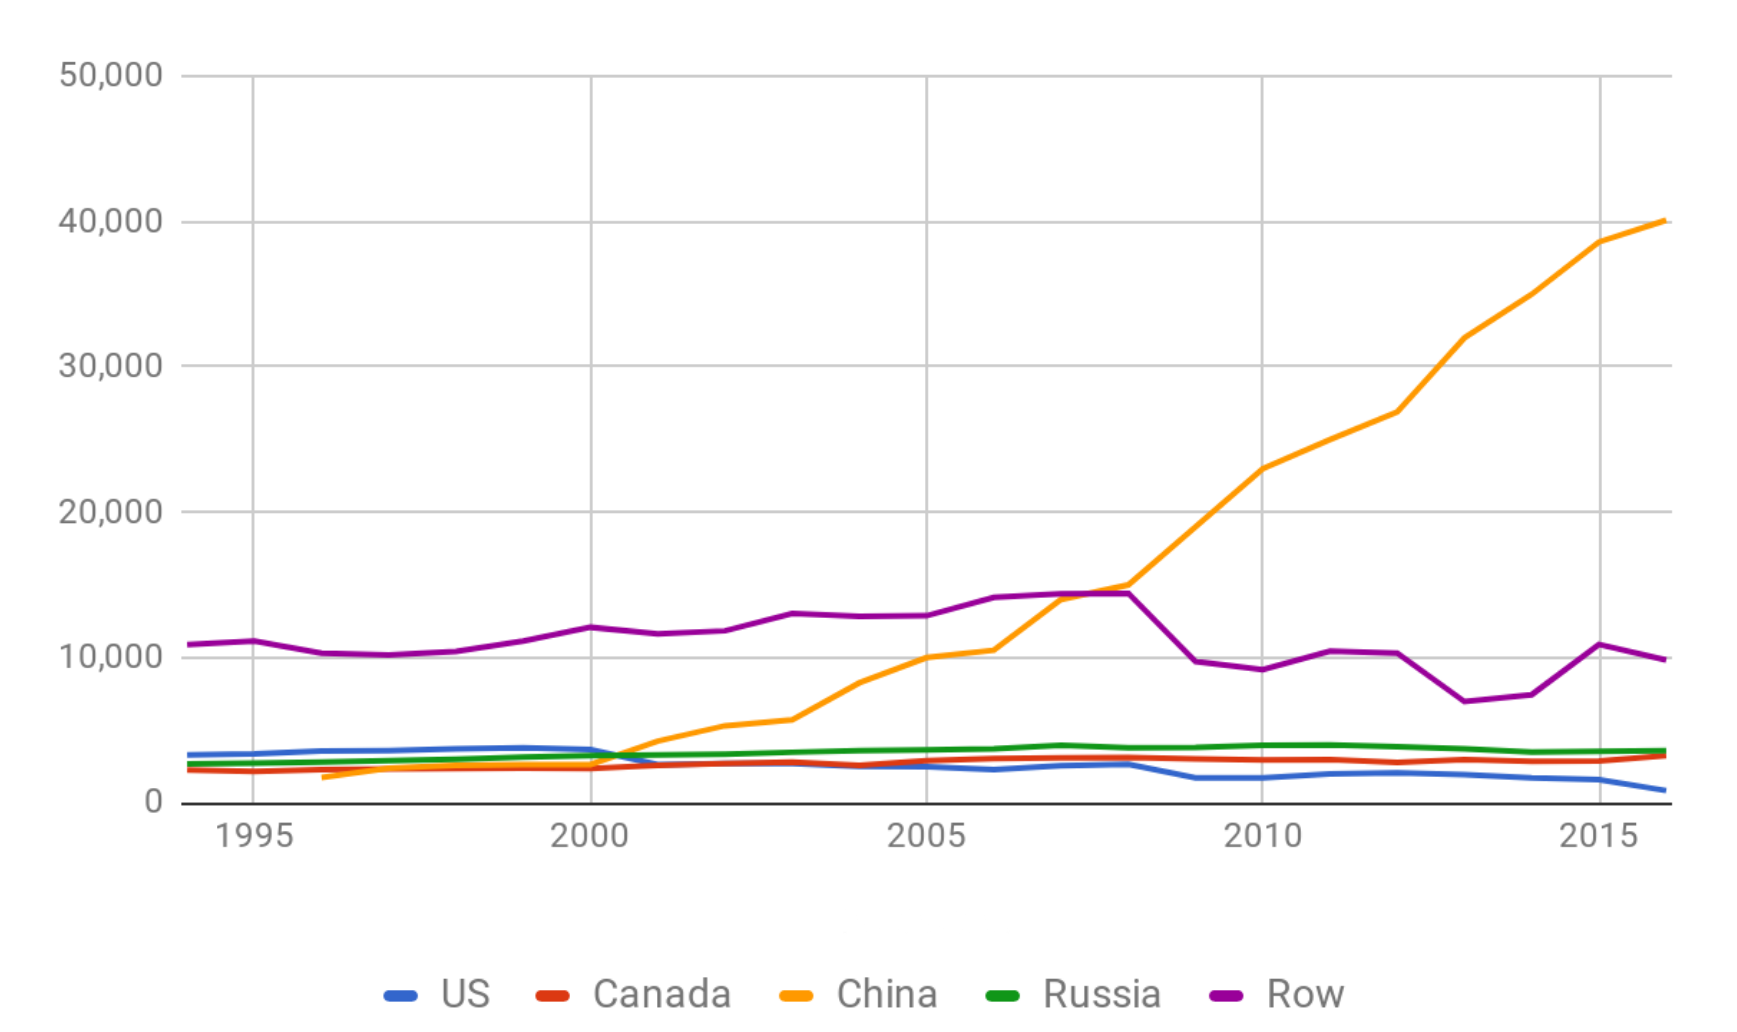
Global aluminium production by country from 1995 to 2016 in million tonnes of aluminium. (Source: BitMEX Research, US Geological Survey)
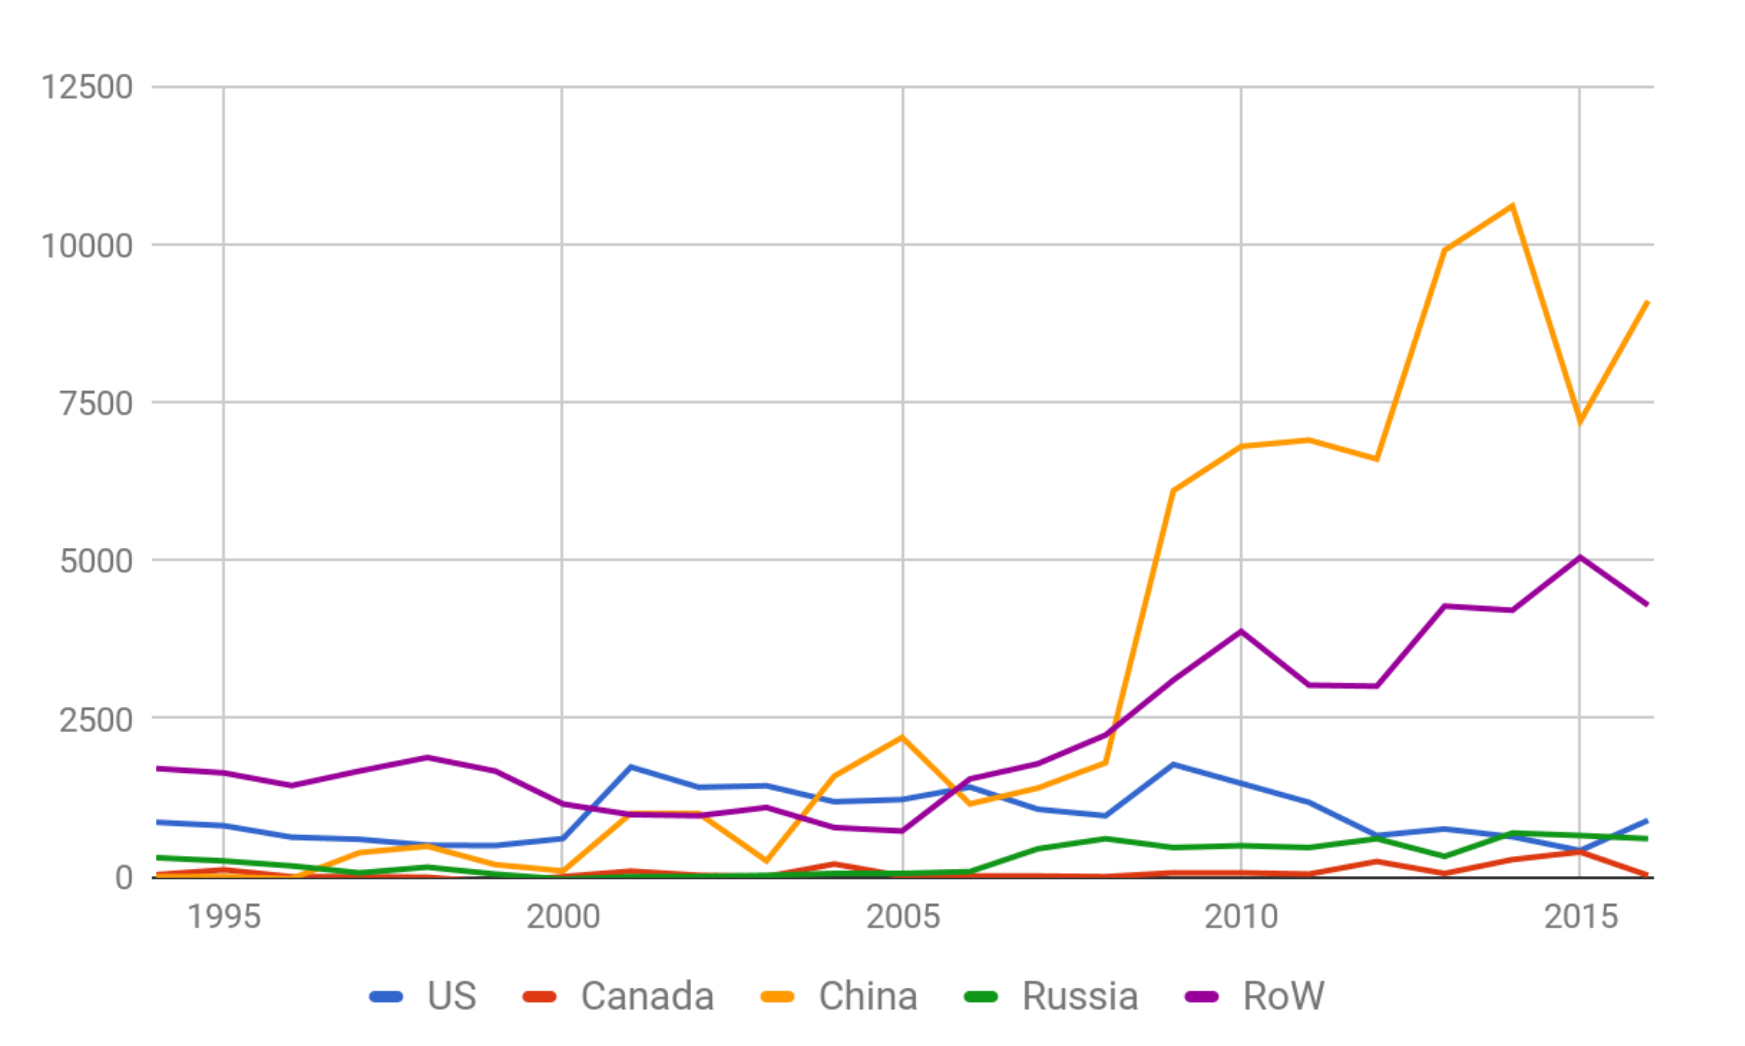
Surplus aluminium production capacity by region from 1995 to 2016 in million tonnes. (Source: BitMEX Research, US Geological Survey)
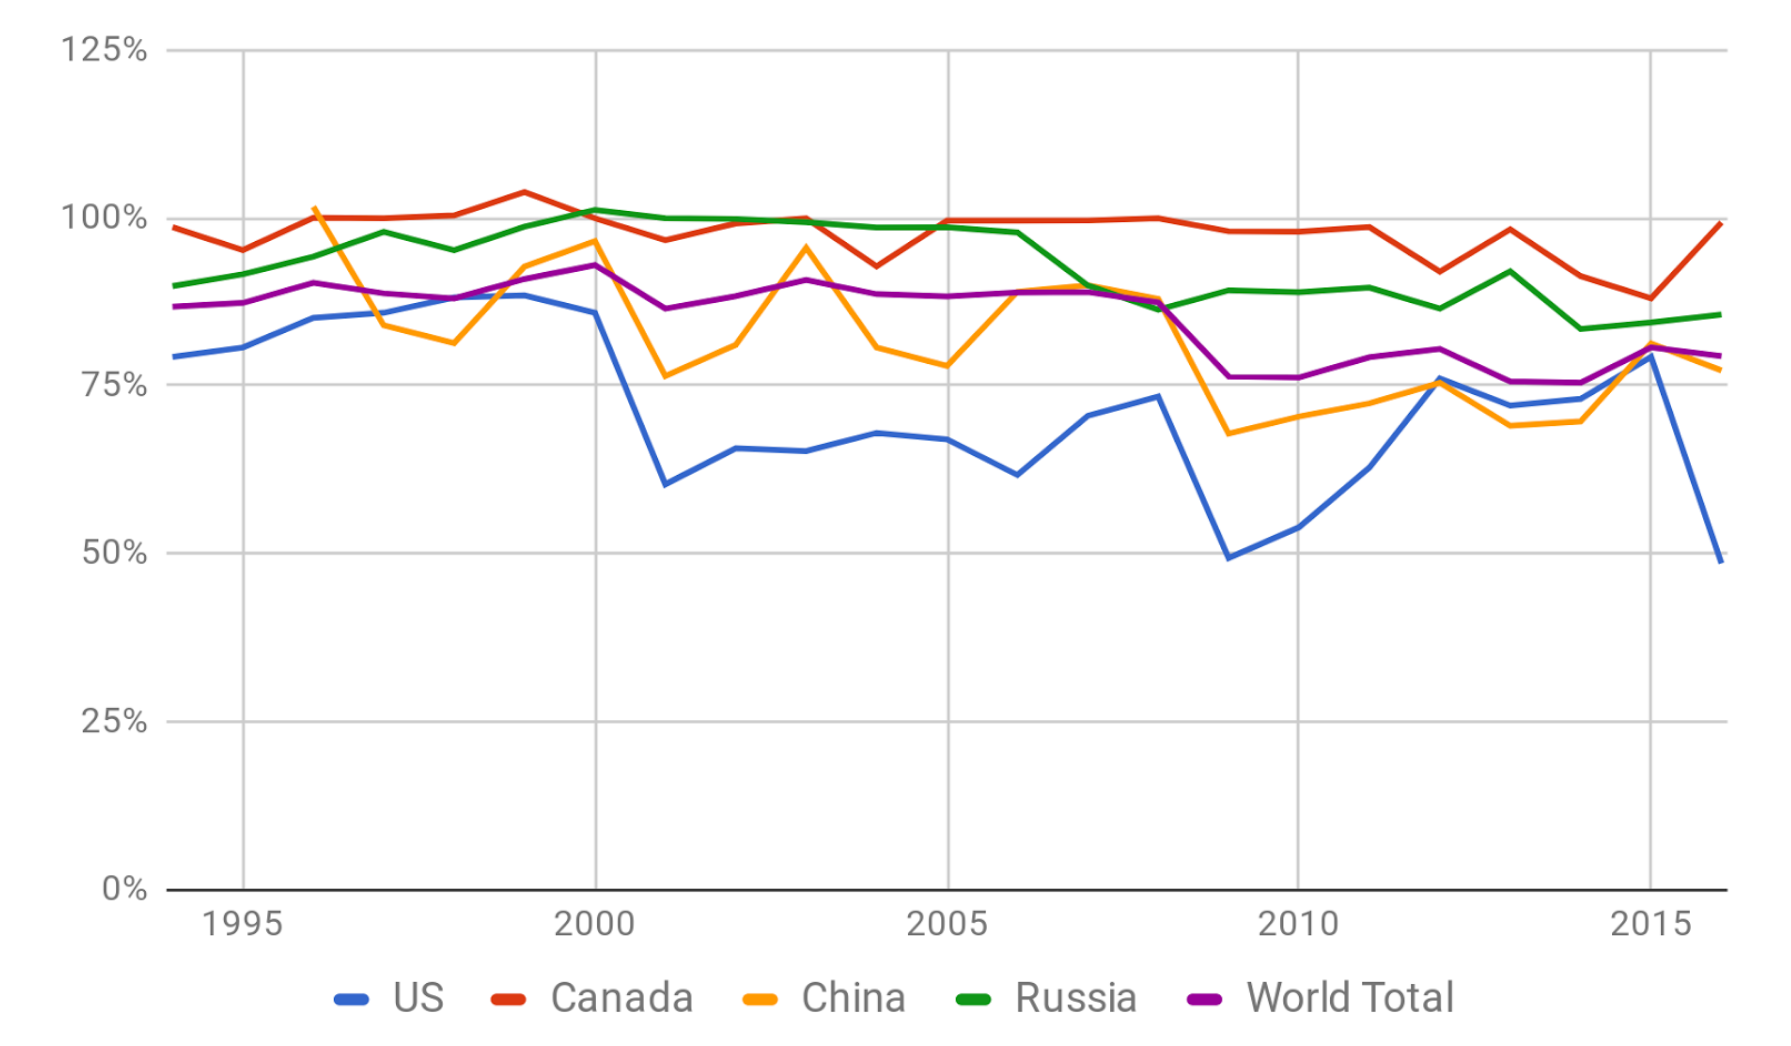
Aluminium production capacity utilisation. (Source: BitMEX Research, US Geological Survey)
Canada’s lower structural costs have allowed Rio Tinto to achieve strong aluminium-related net profit margins of around 10%8 in the last three years despite the lower aluminium price, which explains Canada’s high capacity utilisation, approaching 100% in 2016.
The implied hydro-power over-capacity
After analyzing the aluminium production overcapacity data, we multiplied this by the percentage of aluminium smelting powered by hydro power in each region to calculate an approximation of the surplus hydro-power capacity related to aluminium. This may be an overestimate, as the coal-powered smelters may have been disproportionately shut down.
The results, in the chart below, show that China has a huge surplus, despite the fact that only some 10% of its aluminium smelting is powered by hydro power.
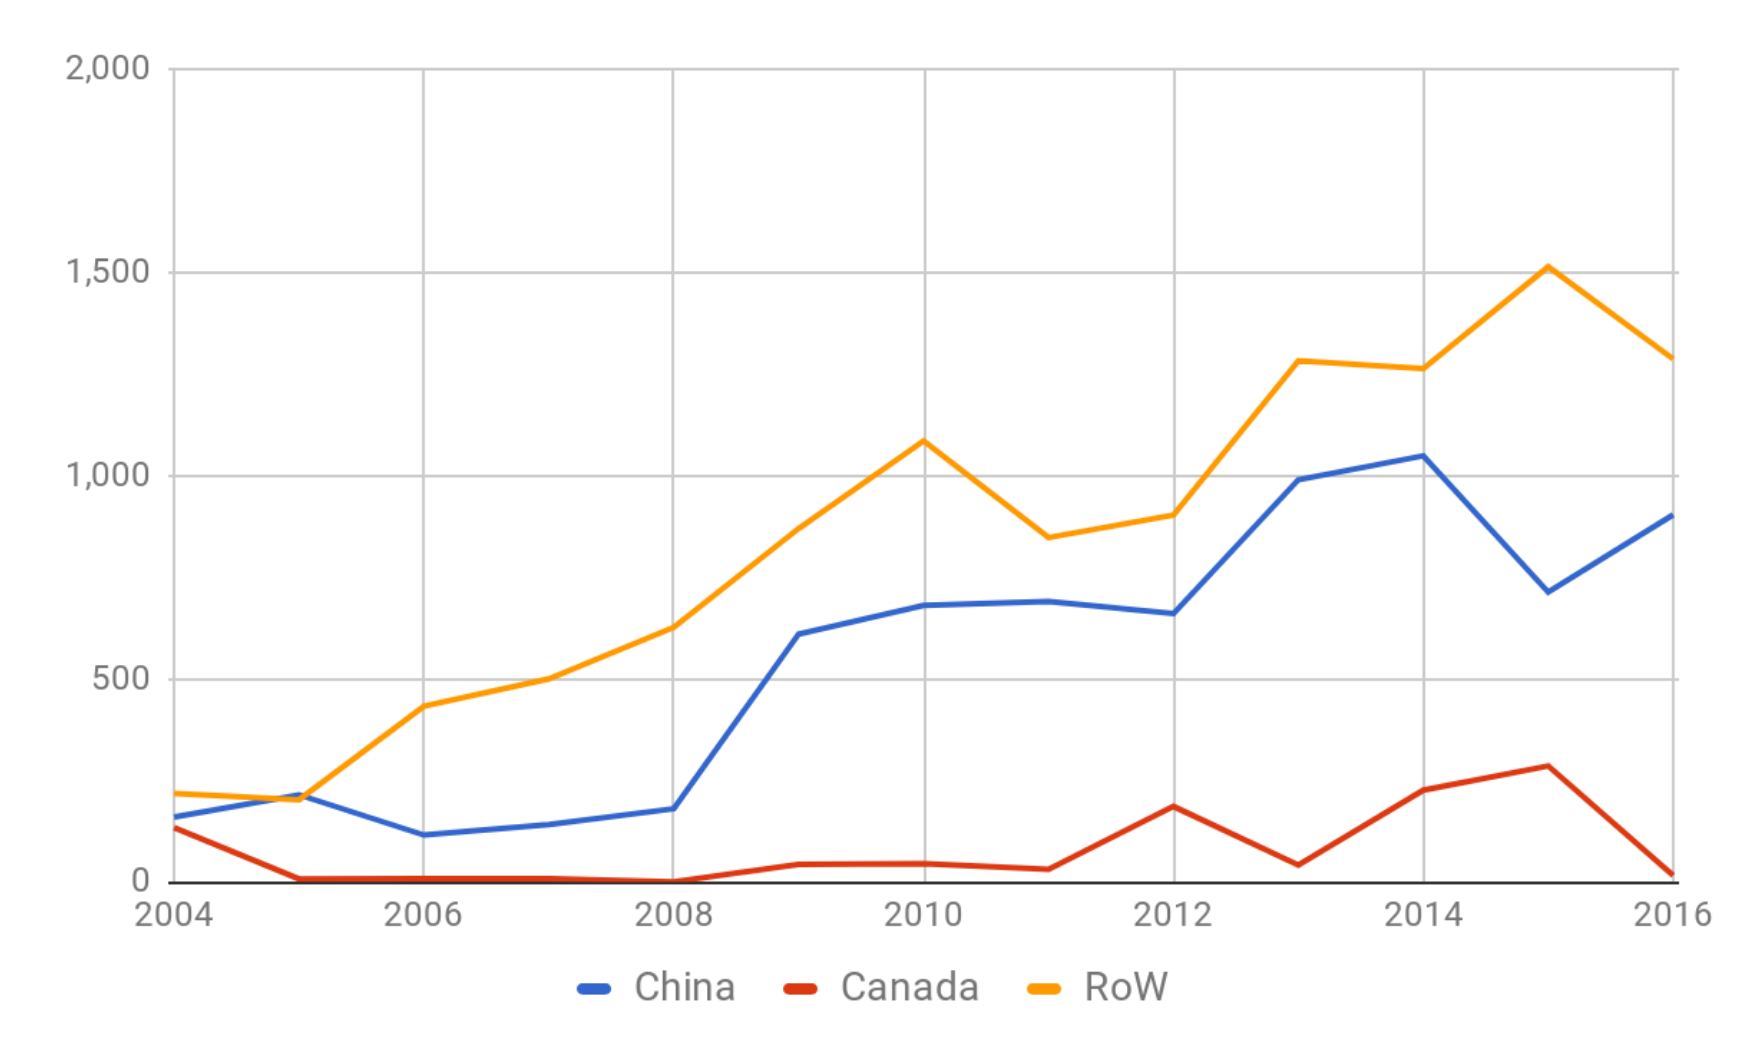
Implied under-utilized hydro-power facilities from 2004 to 2016 in million tonnes of aluminium equivalent. (Source: BitMEX Research, US Geological Survey, IAI)
Although the chart shows China has by far the largest surplus of hydro-power capacity related to aluminium, this doesn’t paint the full picture. Much of the non-Chinese surplus capacity is concentrated in North America and Europe near regions of higher population density with stronger UHV transmission-line infrastructure.
A significant amount of China’s energy sources are located in the west of the country while most of China’s population, and resultant energy demand, resides in the east.
China has several UHV transmission-line projects underway, which will deliver energy from rural regions to cities in the east. The State Grid Corporation of China aims to invest US$88 billion on UHV lines between 2009 and 2020. Many lines are due to be complete in the coming years and it will be interesting to see if this has any impact on Bitcoin mining.
Global electricity consumption
Global aluminium production consumes about 804 TWh of electricity, around 3.2% of the total global consumption. Based on the latest estimates, Bitcoin mining consumes around 2.1% of the electricity used in aluminium production.
However, because of its greater flexibility with respect to where it needs the electricity, aluminium electricity is expected to cost far less than 3.2% of the global cost. Similarly, Bitcoin mining is expected to cost even less than 2.1% of what aluminium producers spend on electricity.
| Global electricity consumption (TWh) | 2016 | % |
| Bitcoin mining* | 16.7 | 0.07% |
| Aluminium production | 804.0 | 3.22% |
| Other | 24,179.0 | 96.72% |
| Total | 25,000.0 | 100% |
*Bitcoin annualised projection based on latest figures. (Source: BitMEX Research, BP, IAI, Digiconomist)
Conclusion
The confluence of under-utilised hydro power due to over-investment in subsidized loss-making aluminium production, the construction of these facilities in the remote west of the country, and a lack of UHV transmission infrastructure have contributed to China’s Bitcoin-mining success.
We appreciate that the situation can be looked at from many angles and perhaps other explanations have more direct relevance to Bitcoin mining.
Citations
1 – World’s Top Exports
2 – US Geological Survey
3 – BP Statistical Review of World Energy June 2017
4 – Nuclear Energy Institute
5 – Rio Tinto
6 – International Aluminium Institute
7 – Bloomberg: “China’s Metals Curb Plan Seen Risking Shortages in Biggest User”
8 – Rio Tinto Annual Report (p. 199)
9 – Chalco 2015 Annual Report (p. 11)
10 – Reuters: “Chinalco plans shutdown of biggest aluminium smelter”