Abstract: We present an in depth report into the cryptocurrency exchange ecosystem. The market is broken down by almost all the possible characteristics (Exchange type, exchange region and trading pairs). The robustness and authenticity of exchanges are evaluated using metrics such as web traffic, average trade sizes, order book depth, security polices and price reliability. The report was produced by CryptoCompare and uses the CryptoCompare’s Aggregate Pricing Index (the CCCAGG), for much of the analysis.
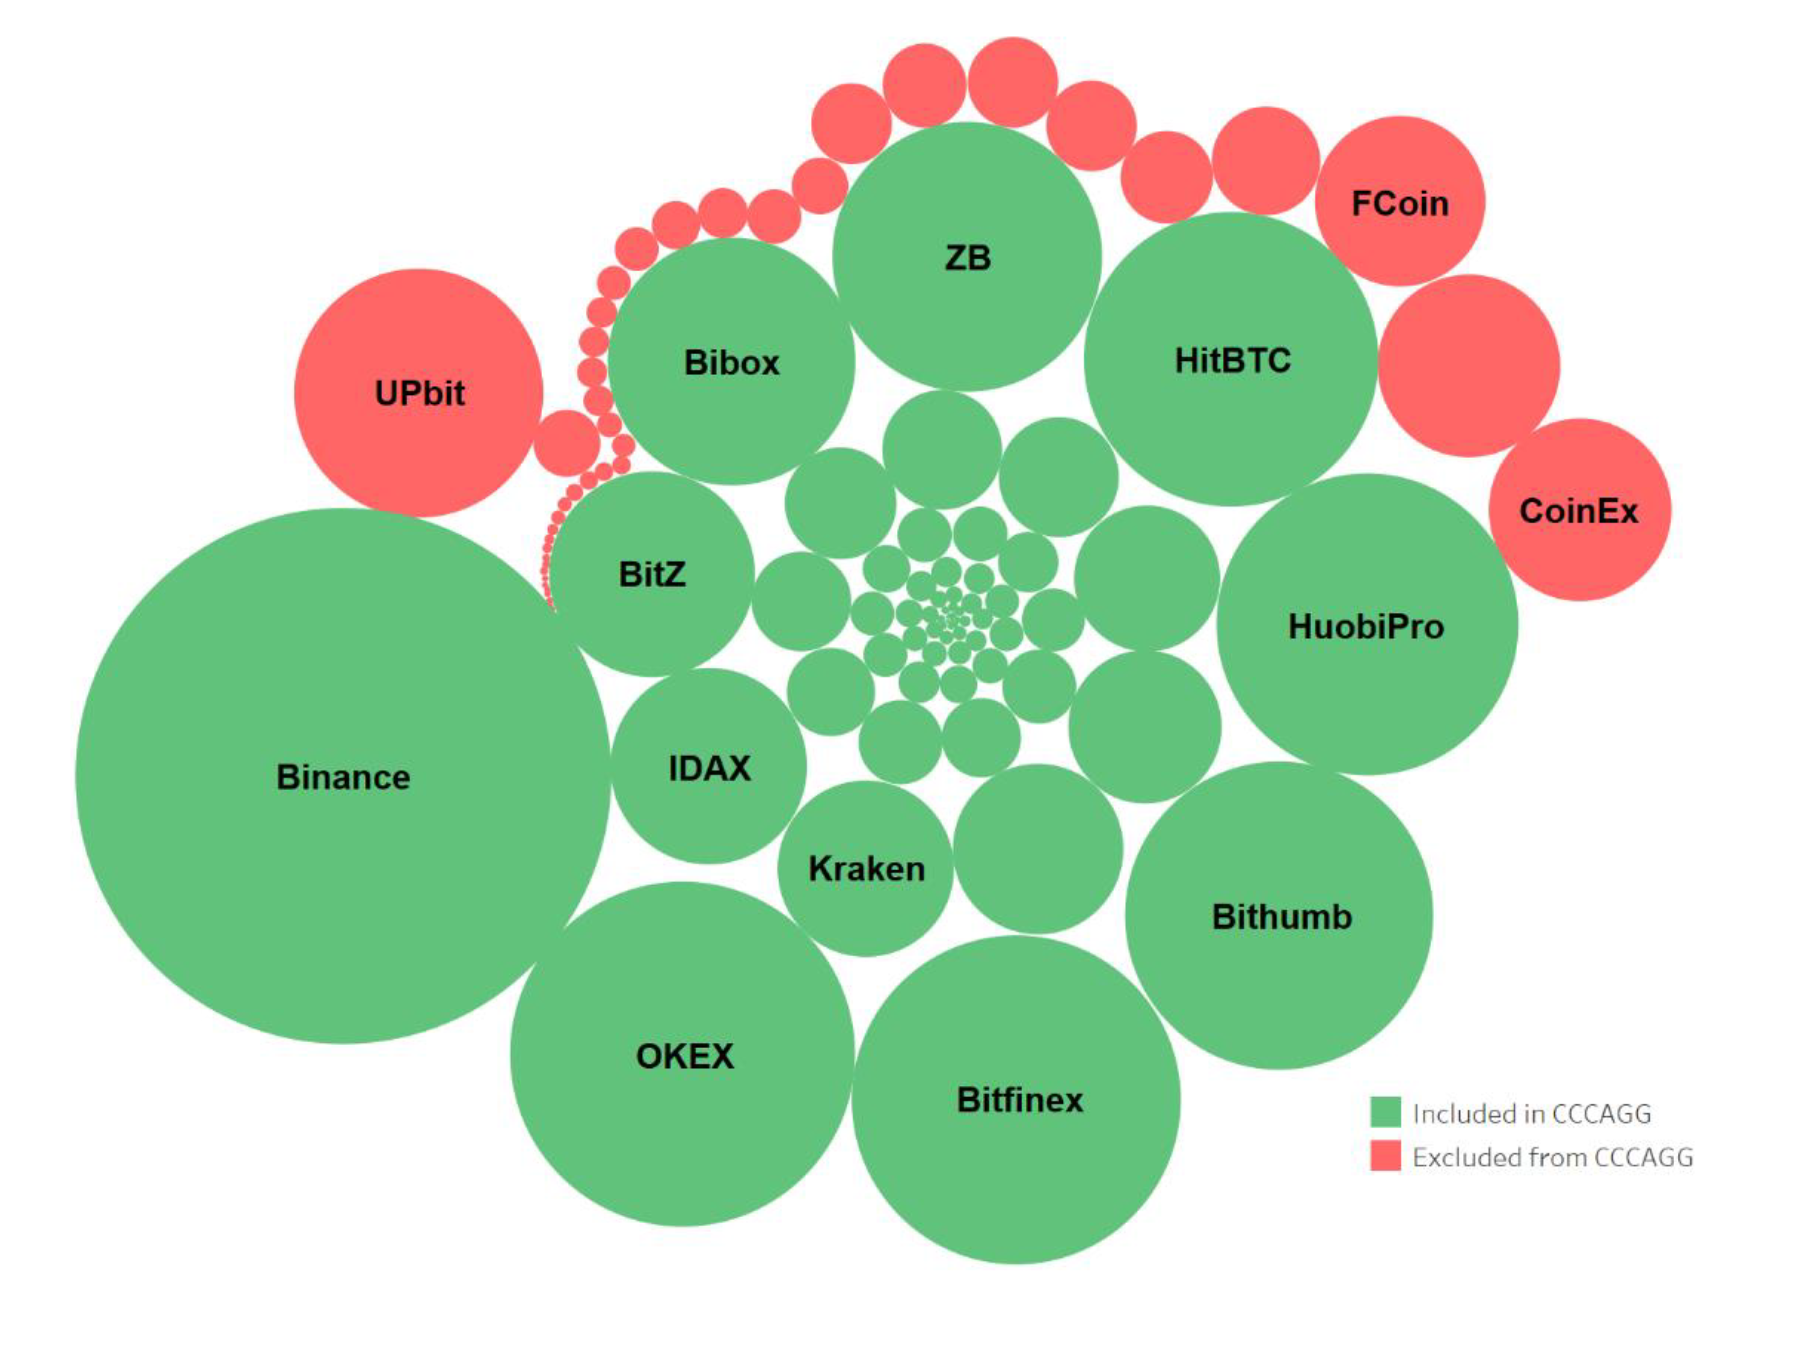
(Note: Current CCCAGG Constituent Exchanges, Sized by 24H Volume)
Please click here to download a PDF version of CryptoCompare’s report
Executive Summary
Major Exchange News in October
- Bitstamp was acquired by Belgium-based Investment Firm NXMH for ~400 million USD according to reports.
- Cryptoassets on Gemini are now fully insured with Aon.
- Coinbase adds 0x to its trading platform as well as USDC after announcing its collaboration with Circle on the CENTRE Consortium.
- Korean exchange Bithumb starts a new DEX, while Huobi and OKEX list stablecoins GUSD, TUSD, PAX and USDC.
- Chainalysis will help Binance comply with anti-money laundering (AML) regulations around the globe, and
- Coinfloor becomes the first exchange to obtain a Gibraltar license.
Exchange Market Segmentation
Spot volumes constitute less than three quarters of total market volumes on average (less than 7 billion USD) compared to futures volumes (3.2 billion USD). BitMEX and BitflyerFX average more than one quarter of total volumes while traditional exchanges such as CME and CBOE constitute just under 1%.
Within total spot volumes, exchanges with taker fees represent approximately 90% of the exchange spot market volumes, while transaction-fee based and no-fee exchanges represent the remaining 10%.
Exchanges that offer fiat to crypto pairs constitute just under a quarter of spot market volumes on average (~2 billion USD) while exchanges that offer only crypto to crypto pairs constitute approximately three quarters (~4.7 billion USD). In terms of exchange count however, approximately half of all exchanges offer fiat to crypto pairs.
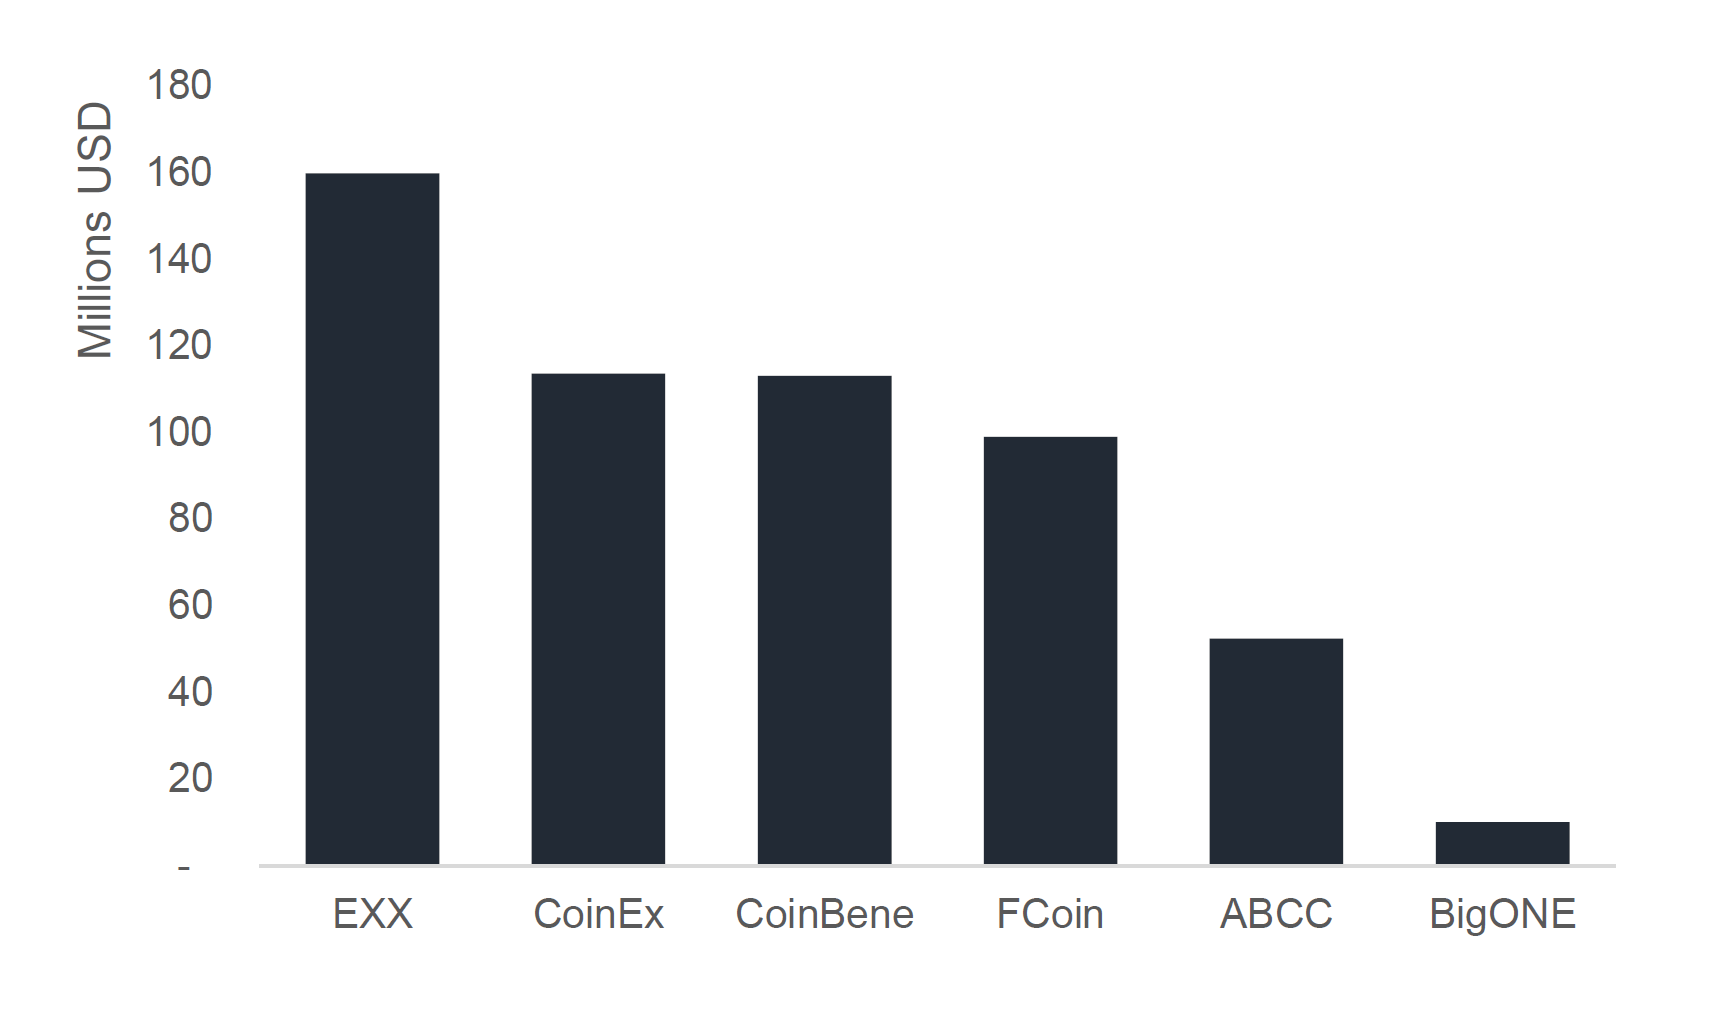
Transaction-Fee Mining Volumes
The top trans-fee mining exchange by average 24h volume was EXX (160 million USD), followed by Coinex (114 million USD) and Coinbene (113 million USD). The total average 24h-volume produced by trans-fee mining associated exchanges on CryptoCompare totals just over 550 million USD. This constitutes approximately 10% of total exchange volume over the last 30 days.
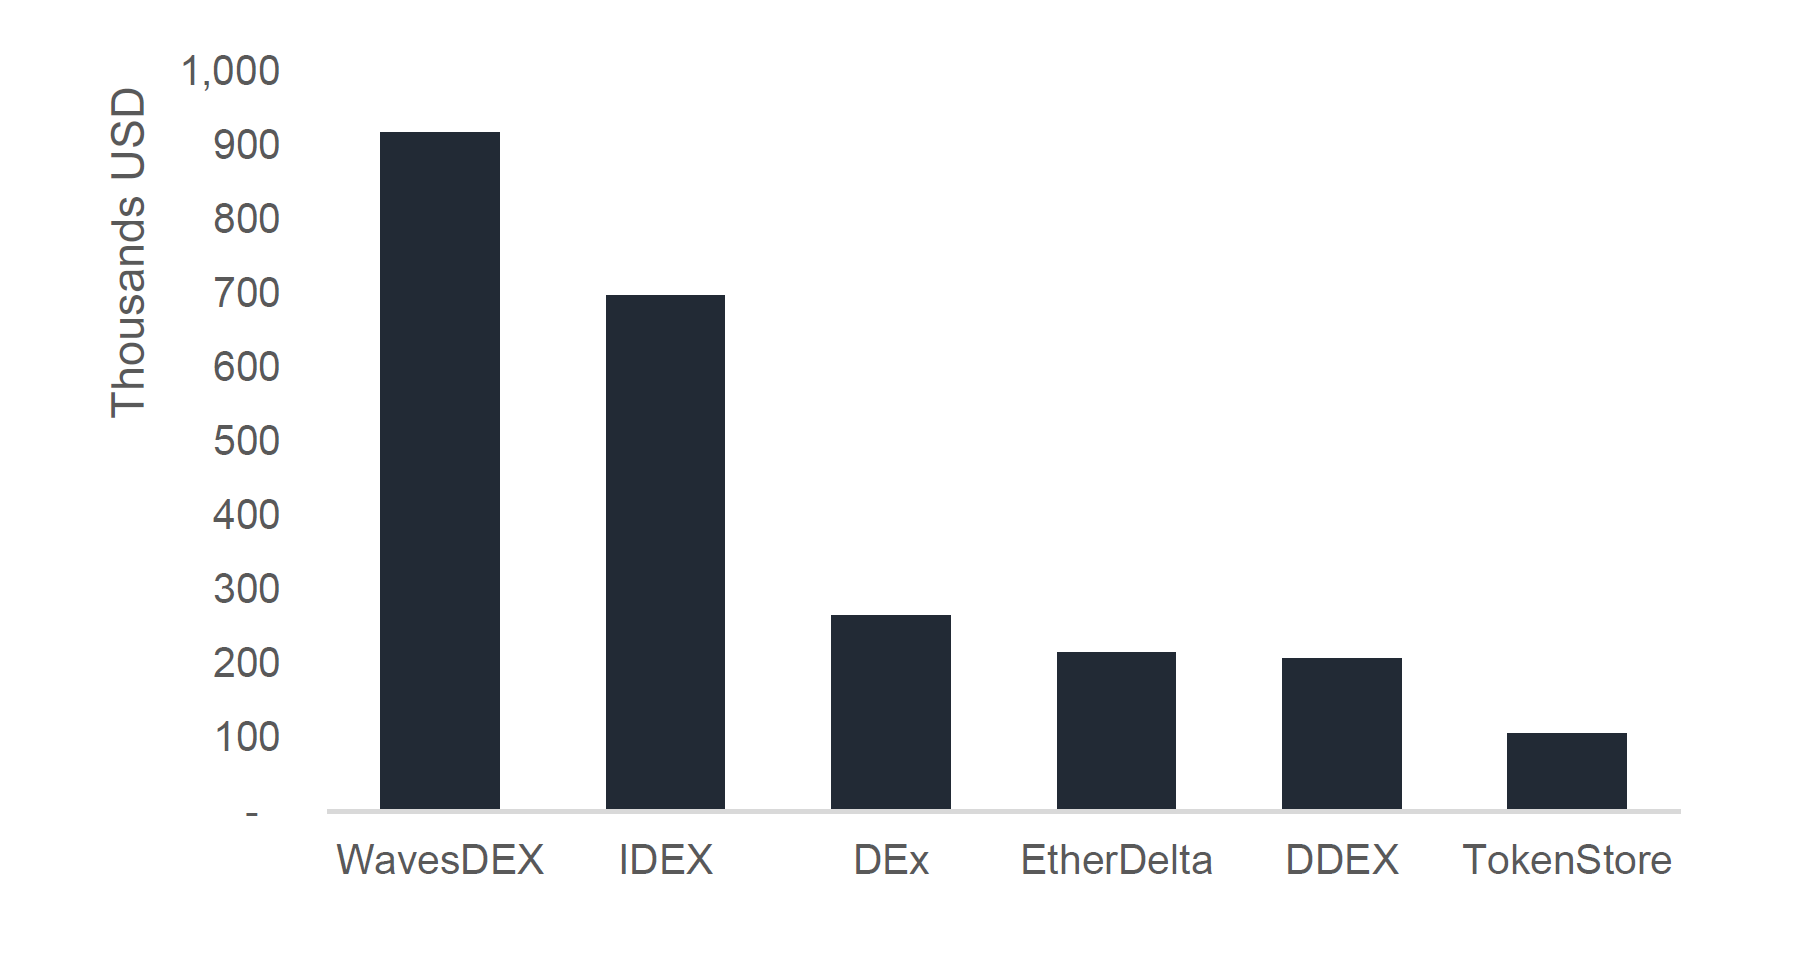
Decentralized Exchanges
The total average 24h-volume produced by the top 5 decentralized exchanges on CryptoCompare totals just under 2.4 million USD. This constitutes just 0.4% of total exchange volume. The top 3 on CryptoCompare by 24h volume include Waves Dex, IDEX and Dex.
Volume, Pairs and Coins
Binance remains the top exchange in terms of 24h volume with an average of 977 million USD. This is followed by OKEX (405 million USD) and Bitfinex (368 million USD). Yobit offers the highest number of pairs at 7,032, followed by Cryptopia (4,321) and CCEX (2,140).
Bitcoin to Fiat Volumes
The US Dollar represented half of BTC fiat trading on average over the past 30 days, followed by JPY (21%) and KRW (16%). Bitcoin trading to Korean Won (KRW) increased sharply after the 7th of October. The pair previously represented a tenth of bitcoin trading among the top 5 fiats on average. Between the 7th and 15th of October it represented a third on average, a 230% increase stemming from Korean exchange Bithumb’s spike in trading volumes.
Country Analysis
Maltese-registered exchanges produce the highest total daily volume at just under 1.4 billion USD, followed by those based legally in South-Korea (~840 million USD) and Hong Kong (~560 million USD). Among the top 10 volume-producing countries, the highest number of large exchanges (with significant volume) are based legally in the USA, the UK and Hong Kong. Binance and OKEX represent the vast majority of Malta’s volumes, while Bithumb and Upbit dominate in South Korea.
Trade Data Analysis
CoinEx, a well-known trans-fee mining exchange, has a significantly higher trade frequency and lower trade size than other exchanges in the top 25. This may point to algorithmic trading, given its almost 176 thousand trades a day at an average trade size of 125 USD. In contrast, Bithumb and HuobiPro had an average trade size of just under 3,000 and 1,500 USD respectively and significantly lower trades per day (12-18 thousand).
Web User Analysis
IDAX and CoinBene appear to have lower average daily visitors compared to similarly sized exchanges by daily volume. Binance has the highest average daily visitor count, in line with its high trading volumes. Meanwhile, exchanges such as Coinbase, Cex.io and Bittrex have significantly greater numbers of daily visitors than other exchanges with similar daily volumes. ZB and EXX attract significantly lower daily visitors than similarly-sized exchanges.
Order Book Analysis
ItBit, Kraken and Bitstamp have relatively more stable markets compared to exchanges such as CoinEx, ZB and Coinbene. These exchanges appear significantly less stable given their relatively low average order book depth values over the specified period of analysis.
Exchange Security
Out of the top 100 exchanges by 24h volume, only 86% have both a public privacy policy and a terms & conditions page. A third of top exchanges store the vast majority of users’ funds in cold wallets. Exchanges itBit, Coinfloor, Bitfinex and Coinbase are among those that store the highest proportion of users’ funds offline. As a proportion of the top 100 exchanges, 11% have been hacked in the past.
KYC
Just under half of top exchanges impose strict KYC requirements, while more than a quarter do not require KYC.
Total Exchange Volumes and Market Segmentation
This section aims to provide a macro view of the cryptocurrency exchange market as a whole. An area of interest is the proportion of spot trading vs futures trading historically. We will also assess the relative proportion of exchange volumes that represent exchanges that charge fees, as well as those that implement models with no-fees or trans-fee mining. Finally, we will take a look at exchange volumes that represent crypto-crypto exchanges versus those that represent fiat-crypto exchanges.
Historical Spot vs Futures Volumes
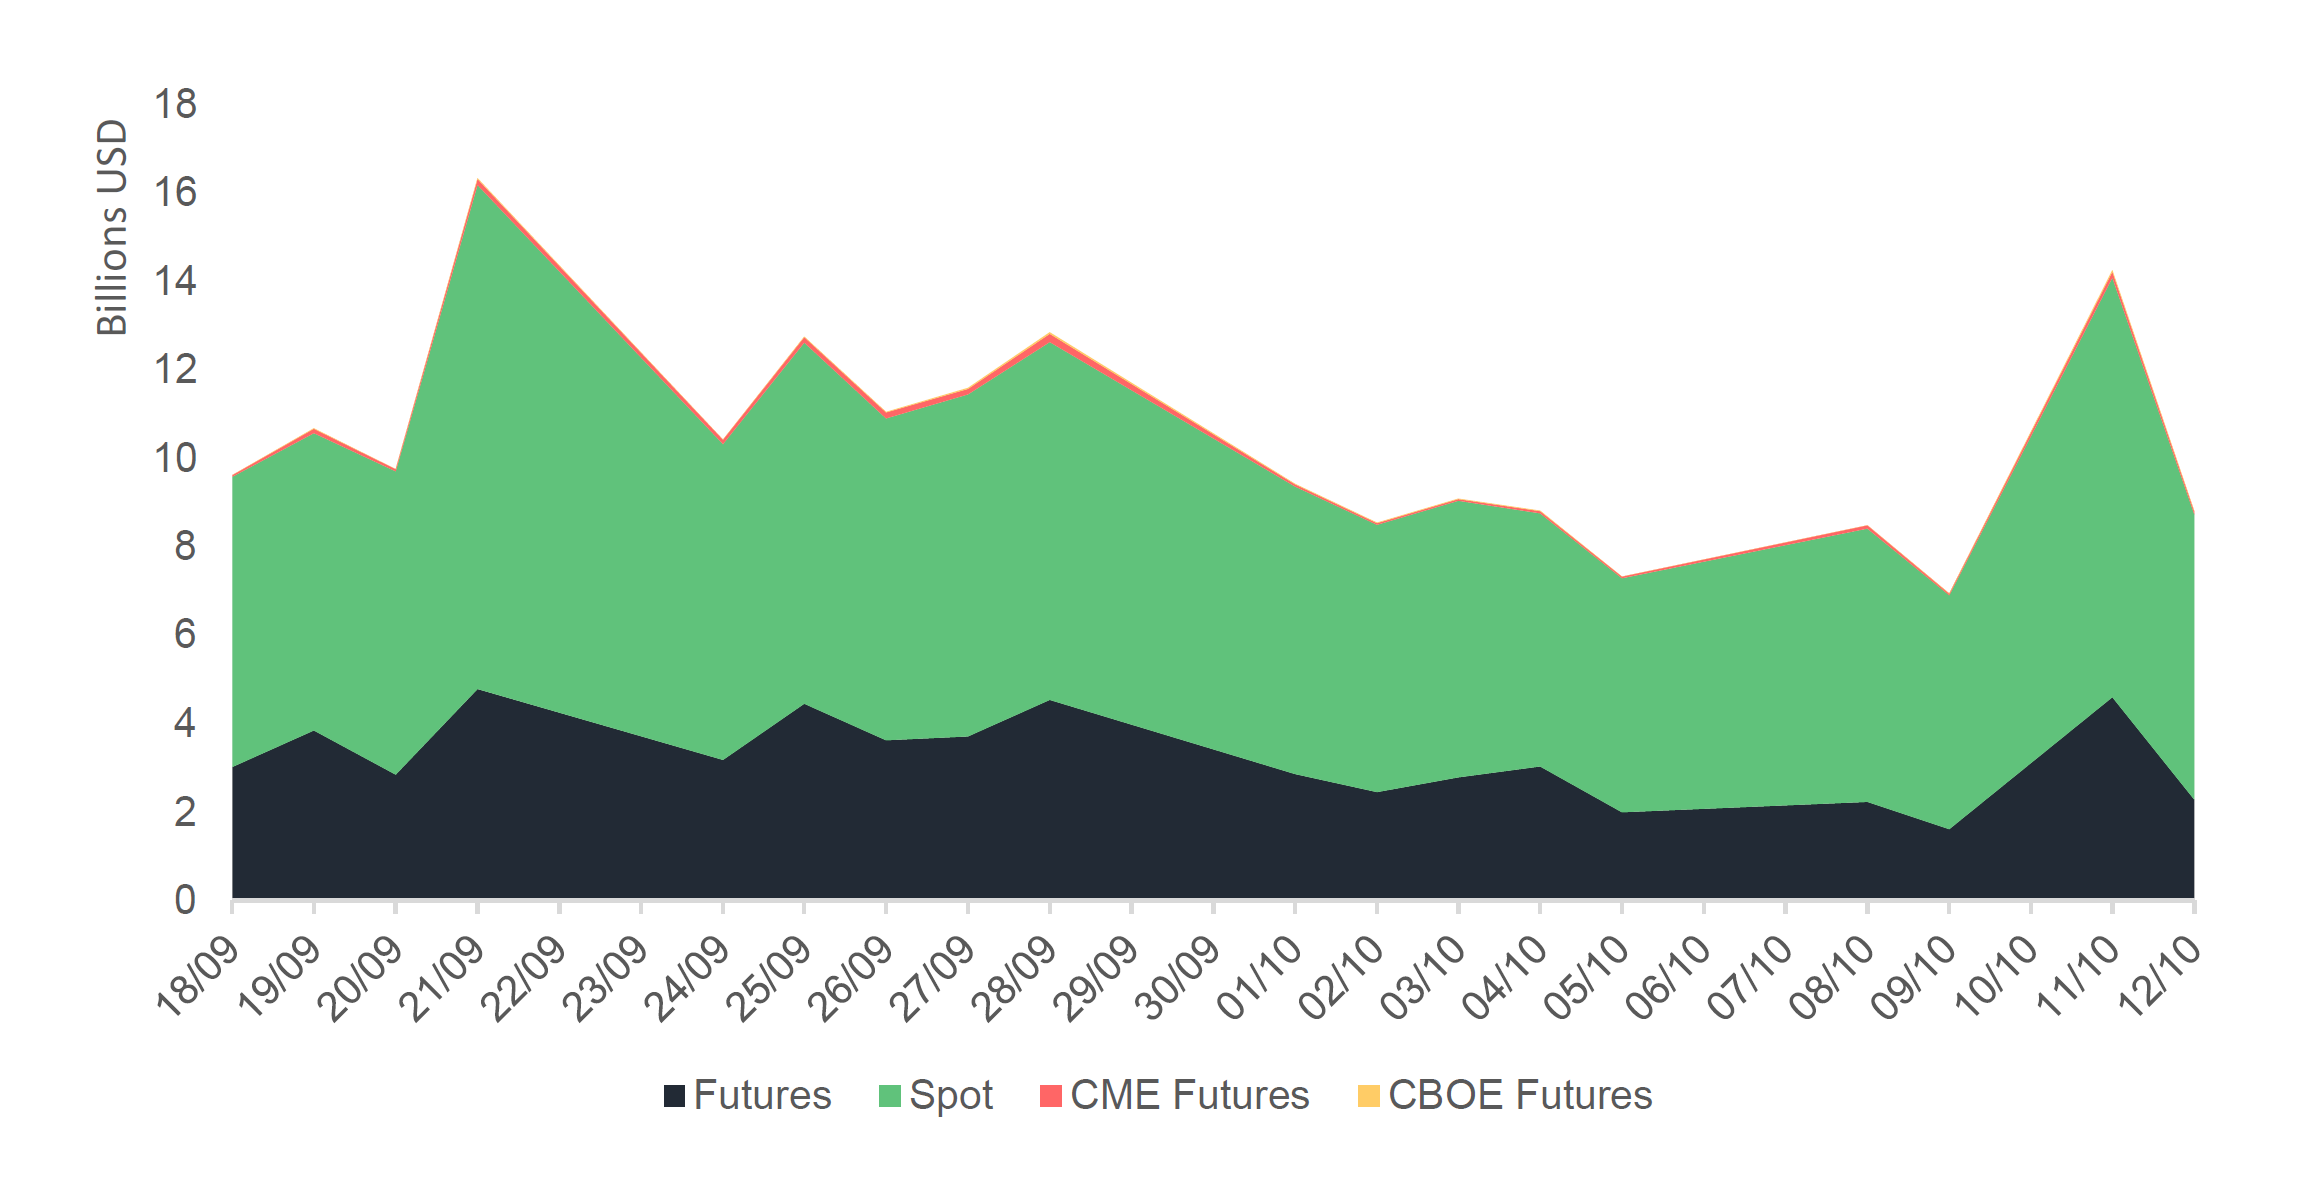
Spot volumes constitute three quarters of total market volumes on average.
Total spot volume averaged less than 7 billion USD, while futures volume averaged over 3.2 billion USD over the period of analysis.
Futures exchanges such as BitMEX (XBT to USD perpetual futures) and BitflyerFX (BTC to JPY futures) average just under a quarter of total cryptocurrency market volumes. Traditional exchanges such as CME and CBOE trading bitcoin futures, only constitute a very small proportion of the total market at just under 1% on average.
Historical BTC to USD Futures Volumes
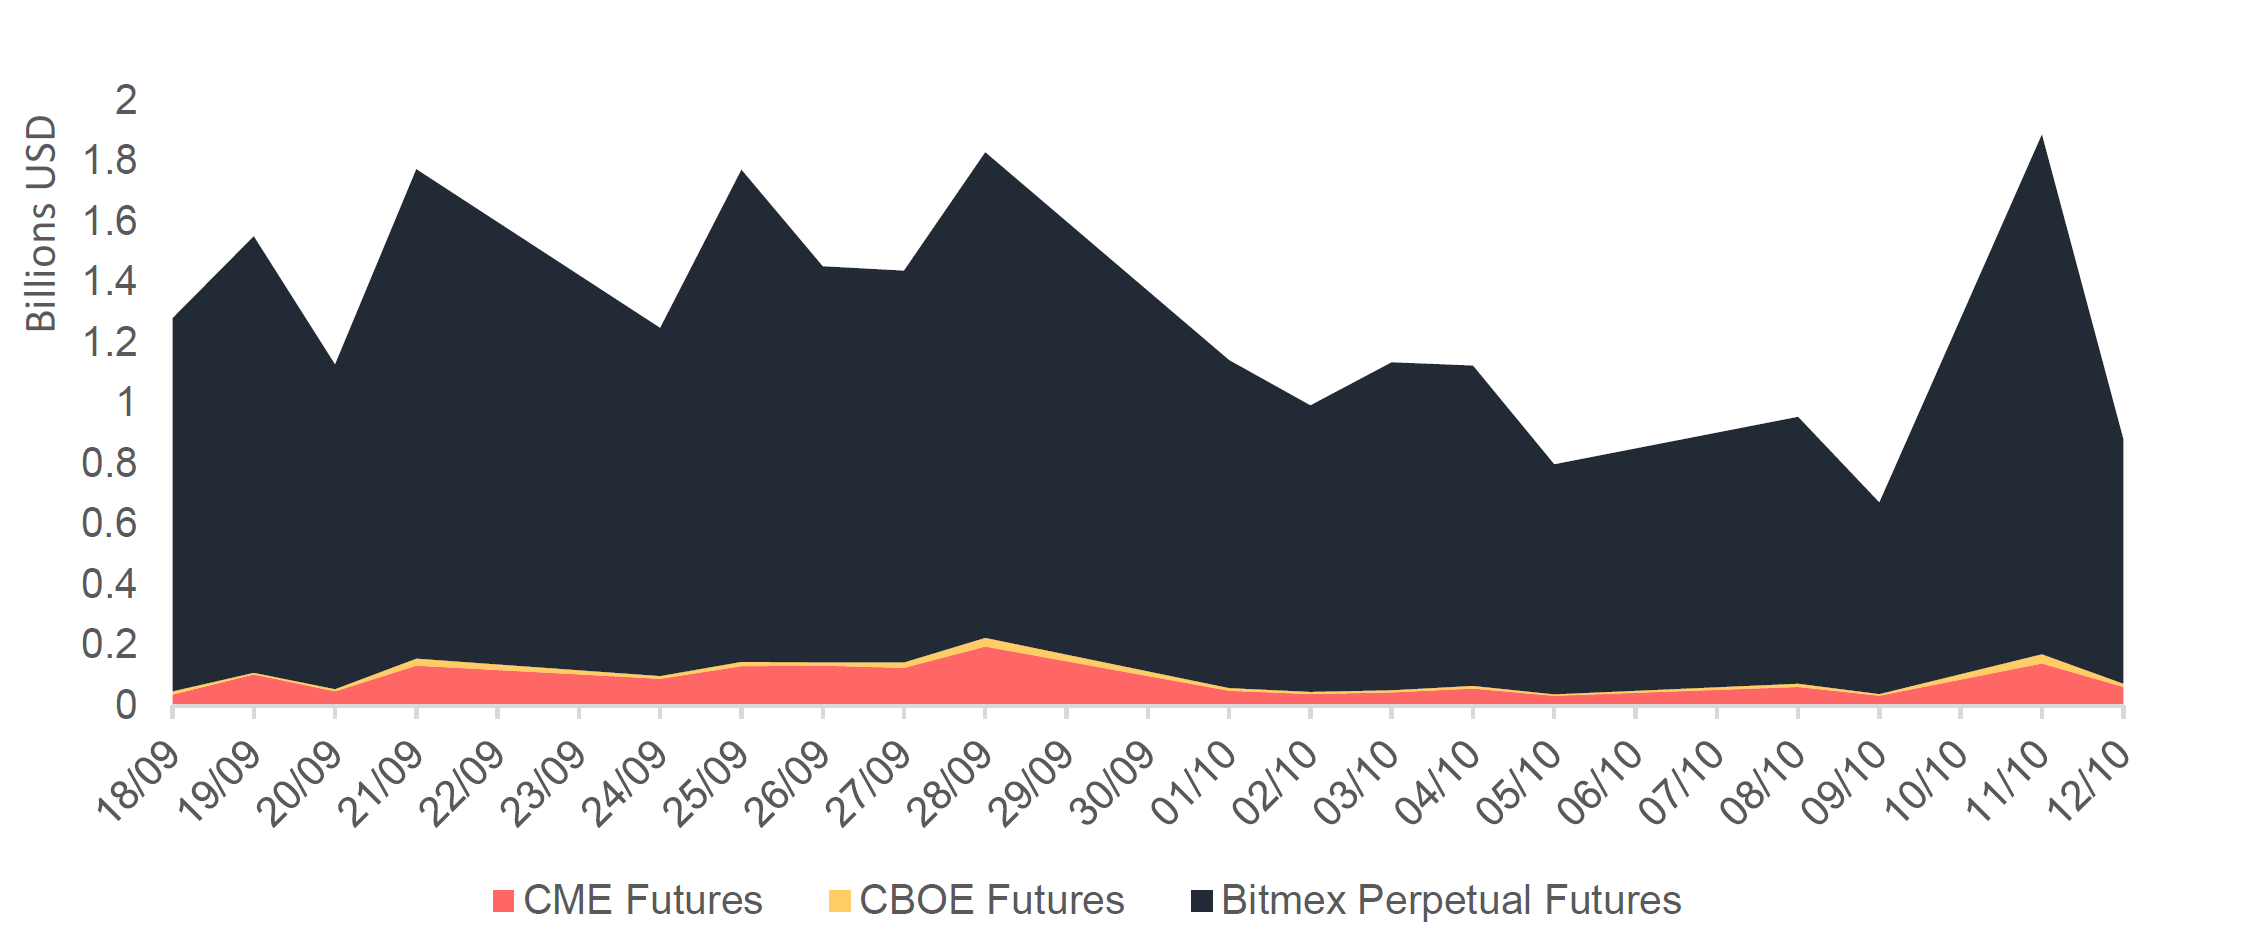
BitMEX’s Perpetual Bitcoin to USD Futures volumes continue to dominate the Bitcoin to USD futures market
When compared to CME’s and CBOE’s futures volumes, BitMEX has represented an average of just over 90% of the market over the last month.
Historical Spot Volumes Segmented by Predominant Fee Type
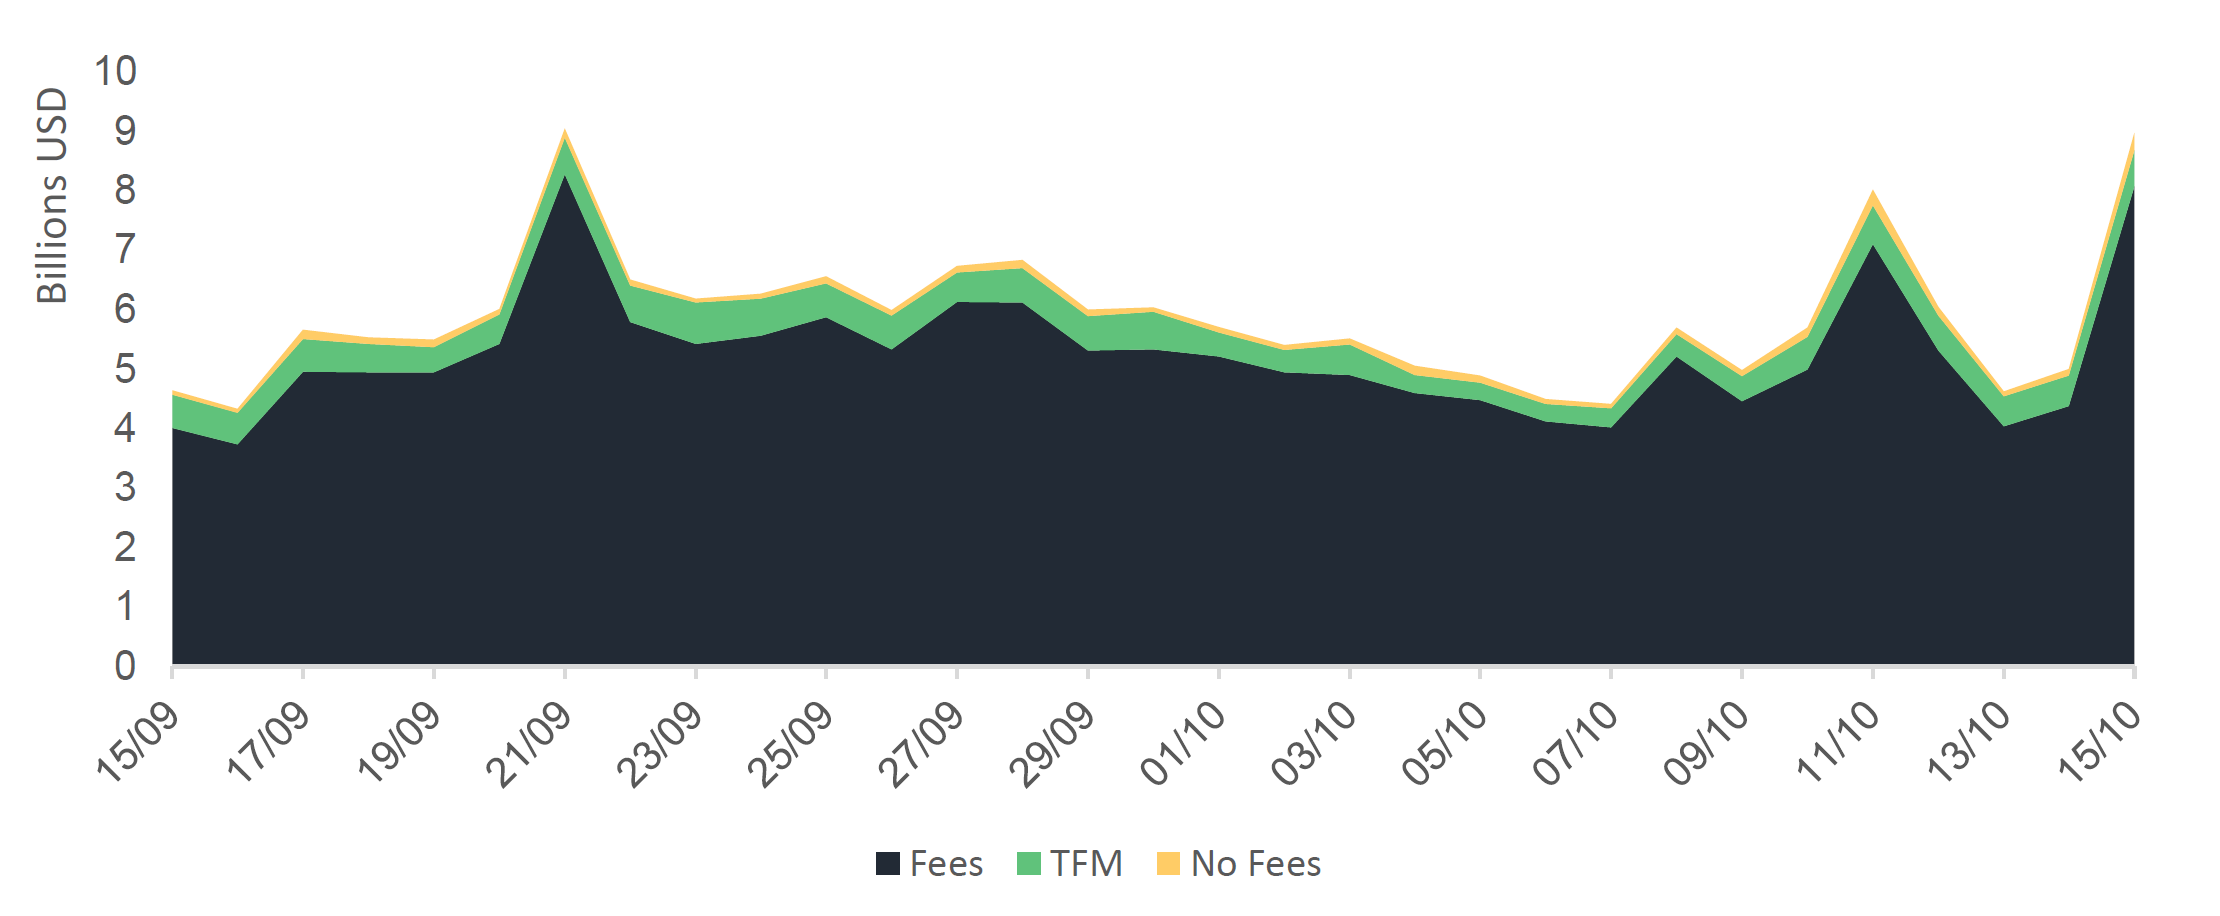
Exchanges with taker fees represent approximately 90% of the exchange spot market volumes.
On the other hand, exchanges that implement transaction-fee mining represent just over 9% of the total spot market, while those that offer no-fee spot trading represent just under 1% of the market.
Historical Crypto to Crypto versus Fiat to Crypto Exchange Spot Volumes
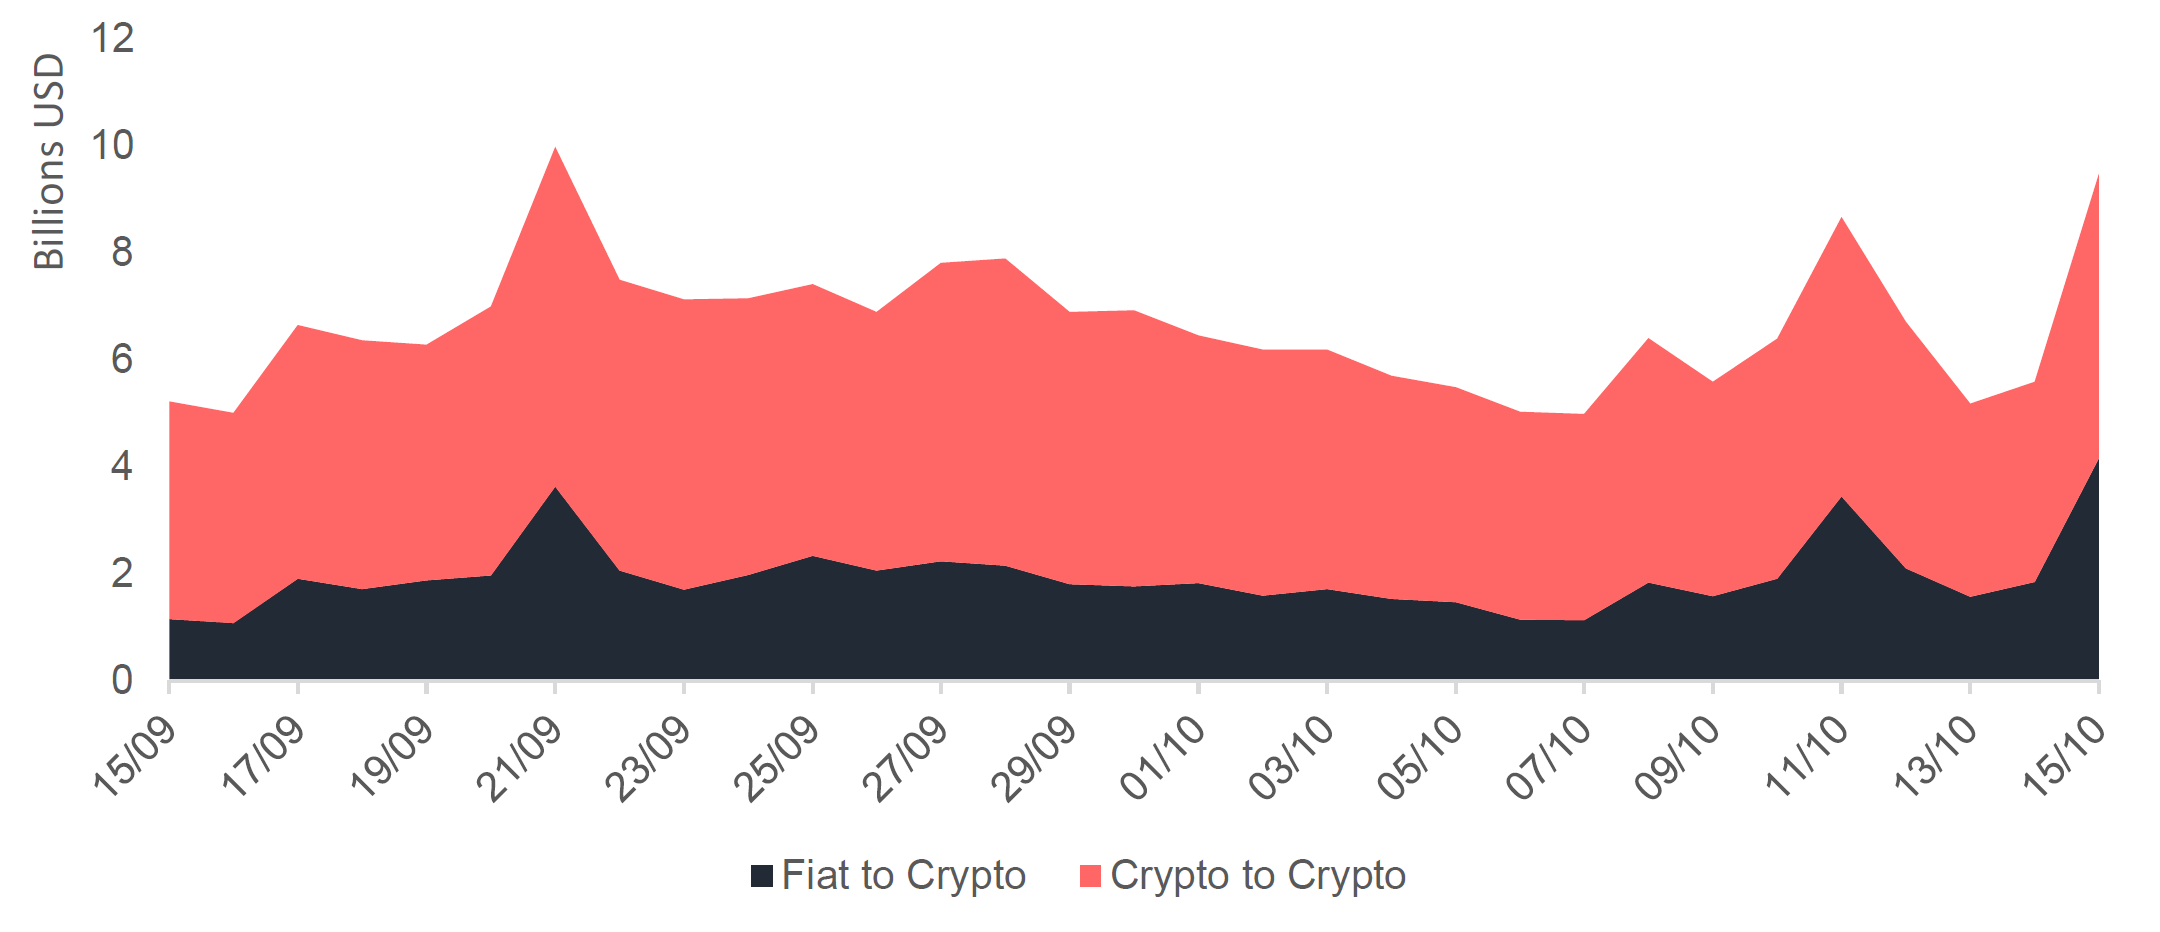
Exchanges that offer fiat to crypto pairs constitute just under a quarter of spot market volumes on average.
Adjusted Historical Spot Volumes
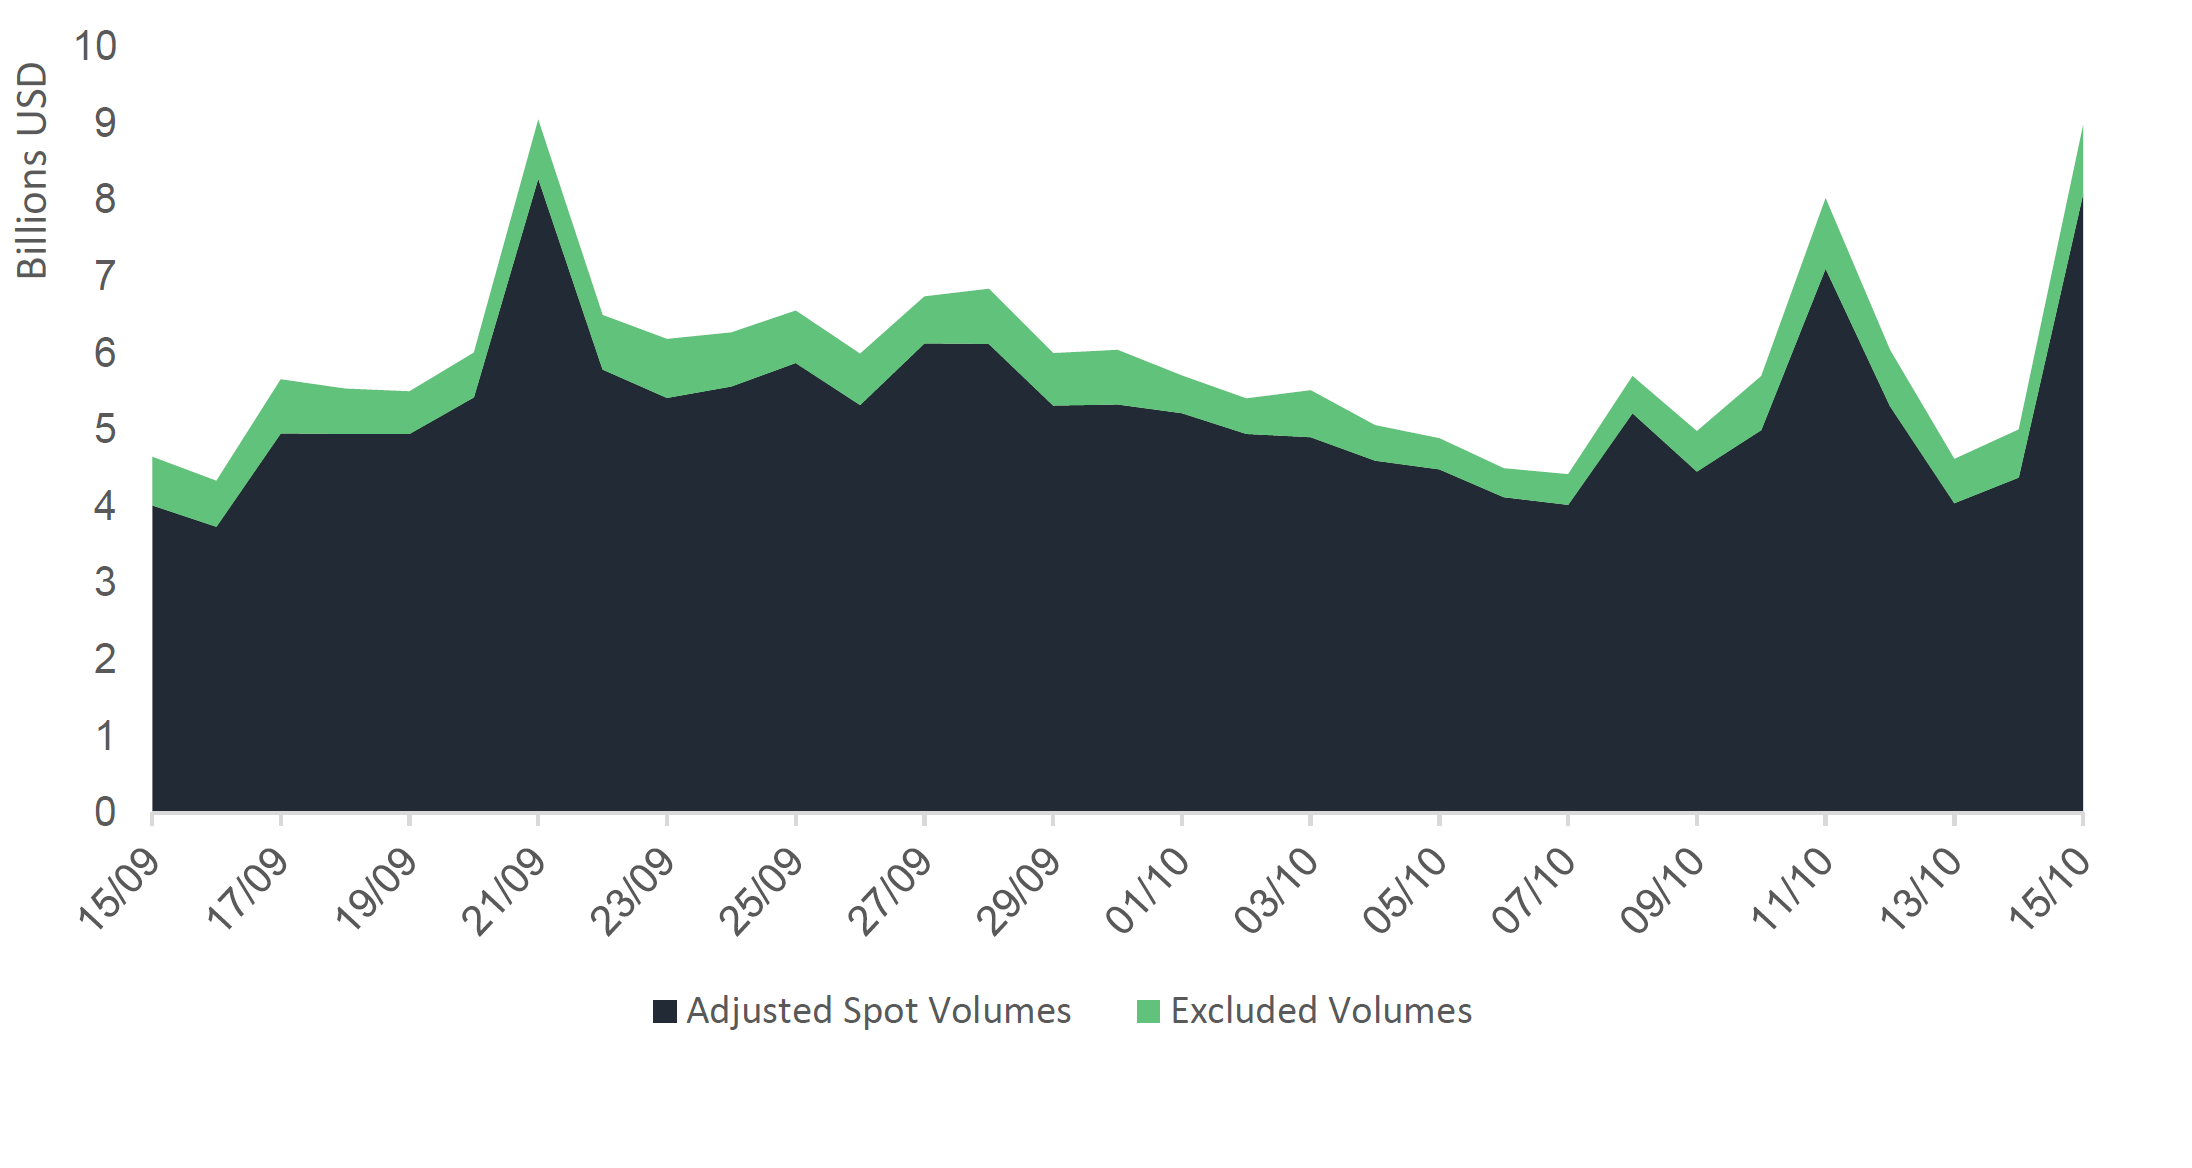
The cryptocurrency exchange market trades an average of 5.26 billion USD in adjusted volumes over the period of analysis.
Adjusted spot volumes exclude all exchanges that operate trans-fee mining or no-fee trading models.
Historical BTC to Fiat Spot Volumes – Top 5 Fiat Currencies
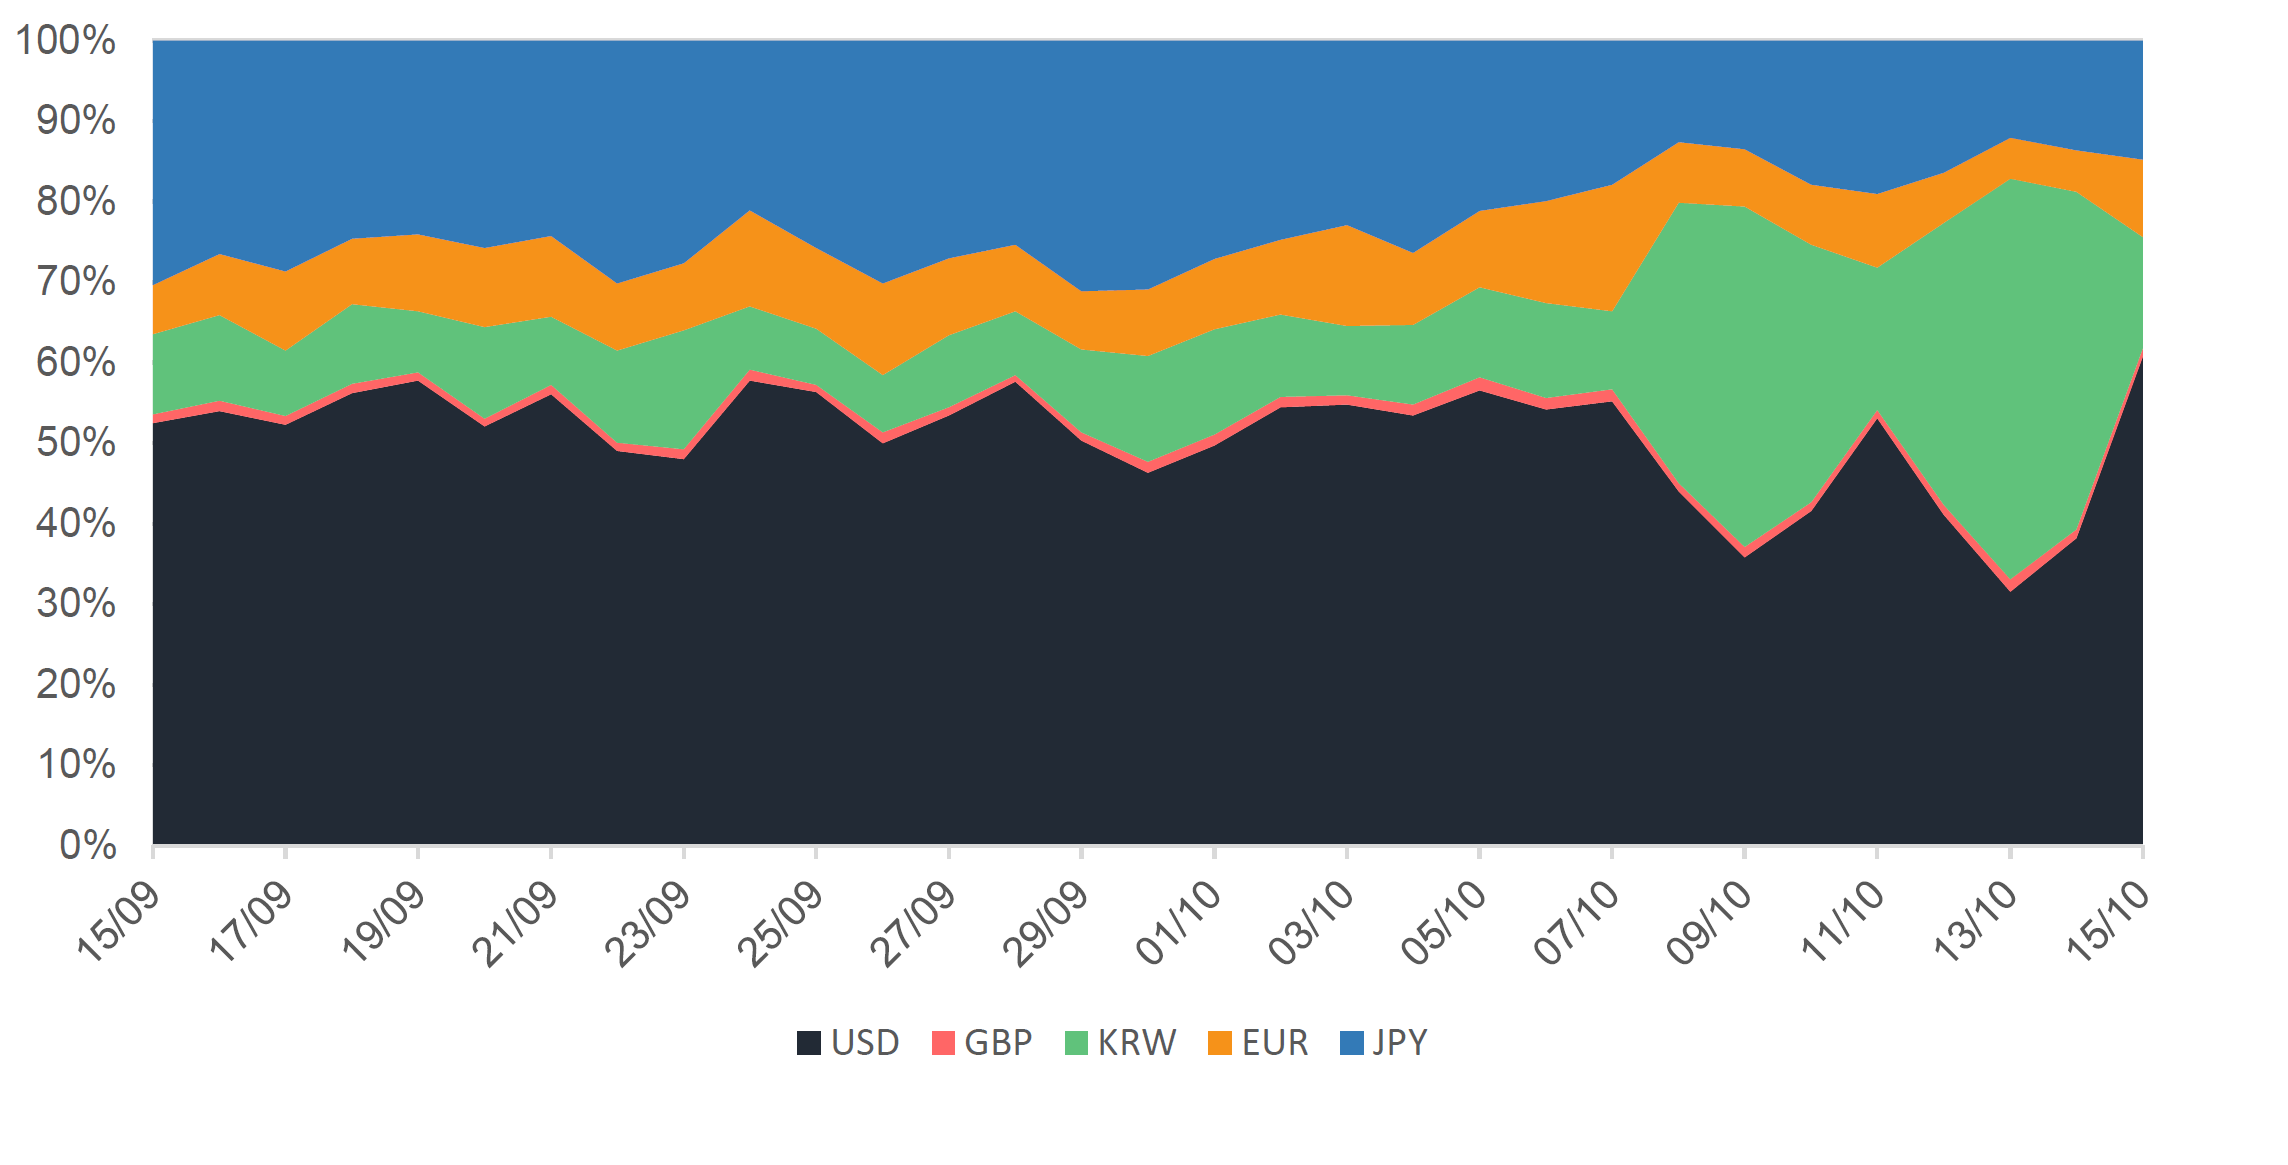
Bitcoin trading to Korean Wan (KRW) increased sharply from the 7th of October.
BTC to KRW previously represented a tenth of bitcoin trading among the top 5 fiats on average. Between the 7th and 15th of October it represented a third on average, a 230% increase. This increase stems from Korean exchange Bithumb’s spike in volumes.
Proportion BTC Trading to Various Fiat Currencies
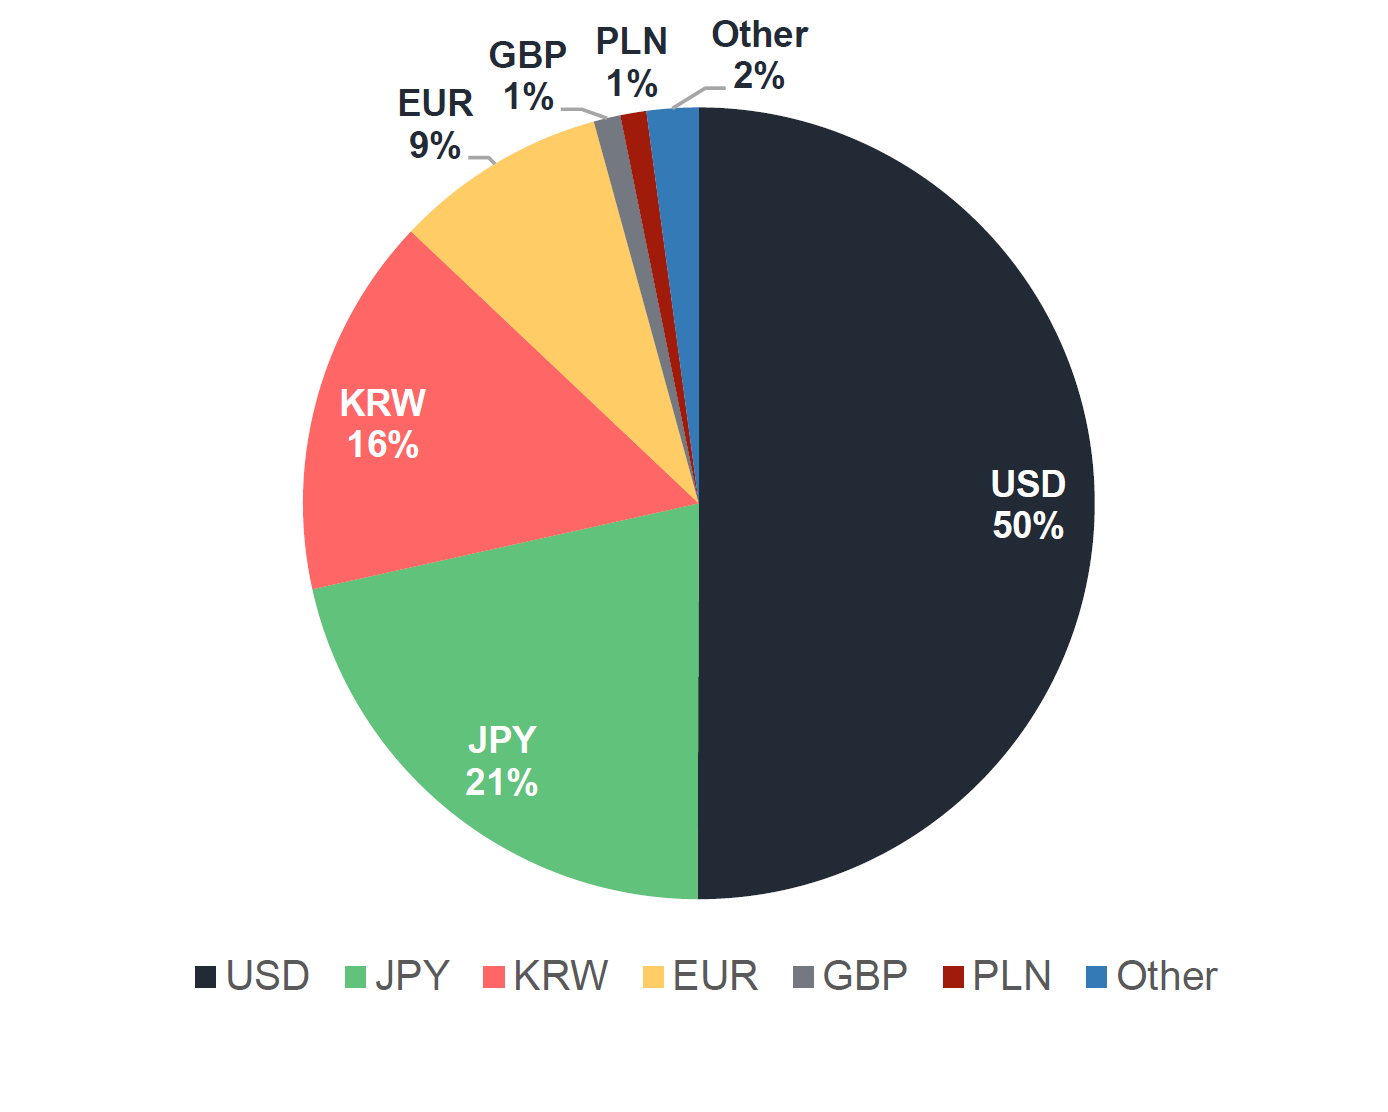
The US Dollar represented half of BTC fiat trading on average over the past 30 days, followed by JPY (21%) and KRW (16%).
Summary of Volumes, Coins and Pairs
Top Exchanges by Average 24H Volume in USD
| Exchange | 24H volume (USD million) | Coins | Pairs |
| Binance | 977.5 | 160 | 408 |
| OKEX | 405.0 | 171 | 511 |
| Bitfinex | 368.5 | 96 | 281 |
| Bithumb | 323.2 | 13 | 13 |
| HuobiPro | 310.2 | 128 | 293 |
| HitBTC | 295.2 | 427 | 889 |
| ZB | 247.6 | 58 | 167 |
| Upbit | 211.0 | 132 | 261 |
| Bibox | 208.9 | 87 | 210 |
Top Exchanges by Number of Pairs
| Exchange | 24H volume (USD million) | Coins | Pairs |
| Yobit | 27.7 | 1,180 | 7,032 |
| Cryptopia | 3.5 | 785 | 4,321 |
| CCEX | 0.1 | 628 | 2,140 |
| EtherDelta | 0.2 | 2,058 | 2,059 |
| HitBTC | 295.2 | 427 | 889 |
| TradeSatoshi | 0.1 | 200 | 840 |
| Bittrex | 49.1 | 514 | 637 |
| Livecoin | 12.5 | 249 | 595 |
| WavesDEX | 0.9 | 163 | 592 |
| IDEX | 0.7 | 563 | 563 |
| OKEX | 405.0 | 171 | 511 |
| Kucoin | 10.1 | 189 | 450 |
| Binance | 977.5 | 160 | 408 |
| Gateio | 48.8 | 172 | 358 |
| Zecoex | 1.4 | 119 | 342 |
Historical 24h Volume – Top 8 Exchanges
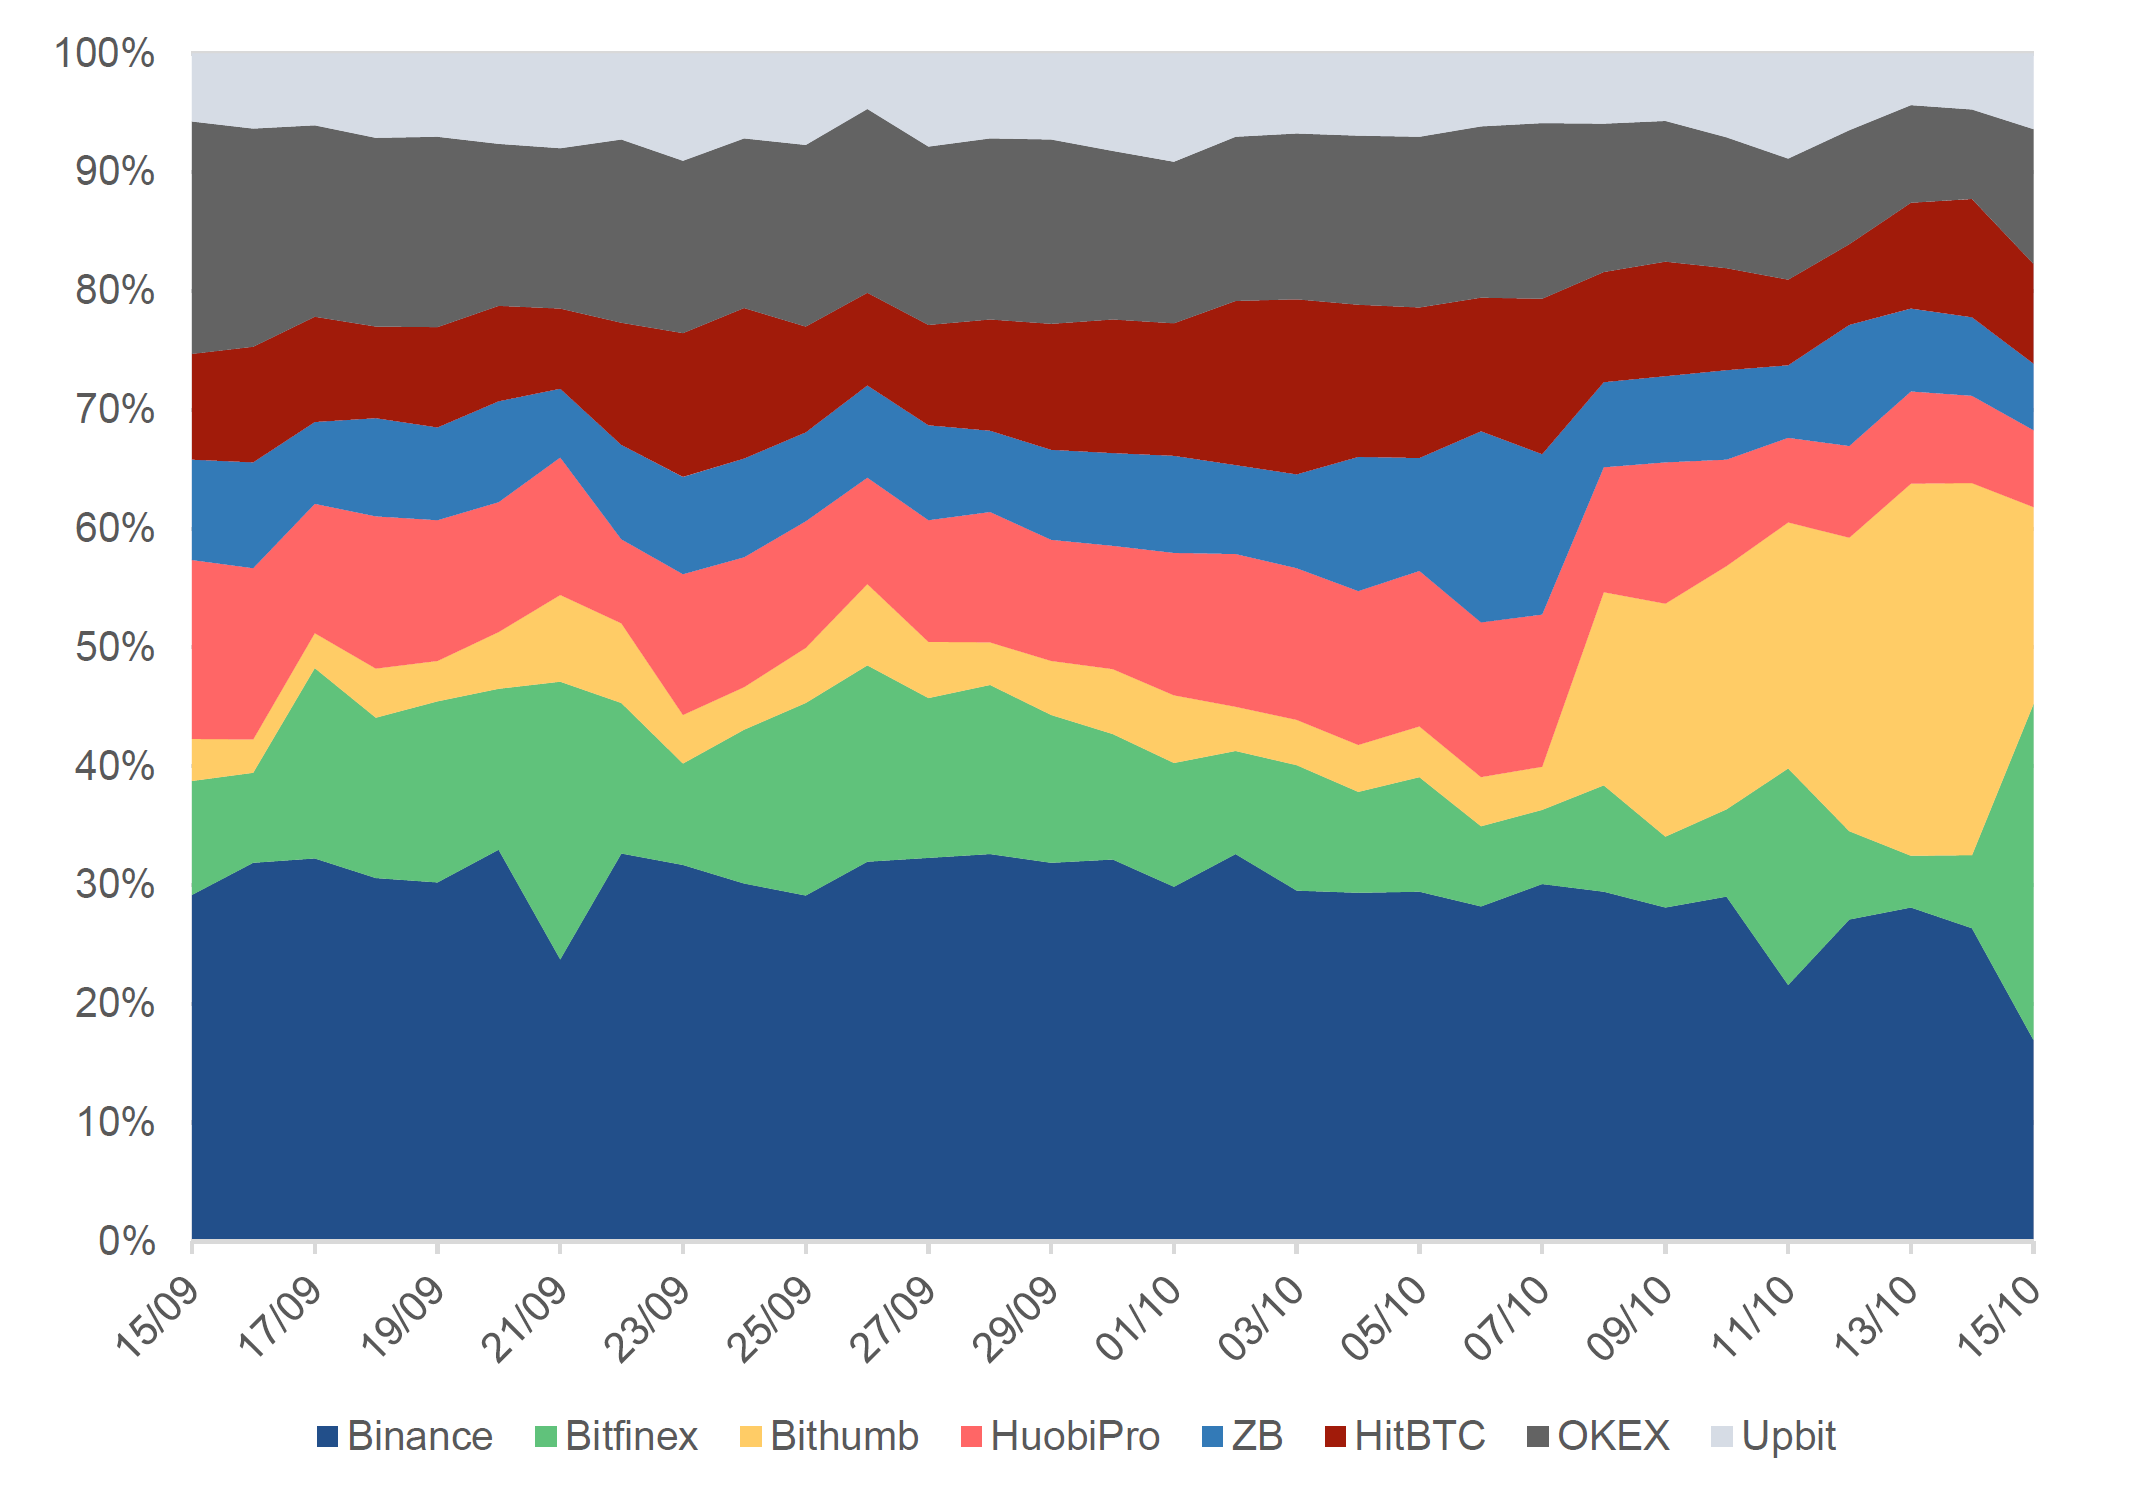
The top exchange by 24h spot trading volume was Binance with an average of just under 980 million USD.
By average 24h volumes, Binance was followed by OKEX and Bitfinex with volumes of 405 million and 368 million respectively.
Bithumb saw a 356% spike in trading volumes from an average of 140 million USD to an average of 640 million USD after the 7th of October. This follows after Singapore-based BK Global Consortium bought a controlling share in the exchange.
Bitfinex saw a spike in volumes towards the 15th of October as the Bitcoin premium on Bitfinex vs Coinbase reached an all-time high of 11.28% according to CrypoGlobe.
Month on Month Average 24H Trading Volume – Top Exchanges
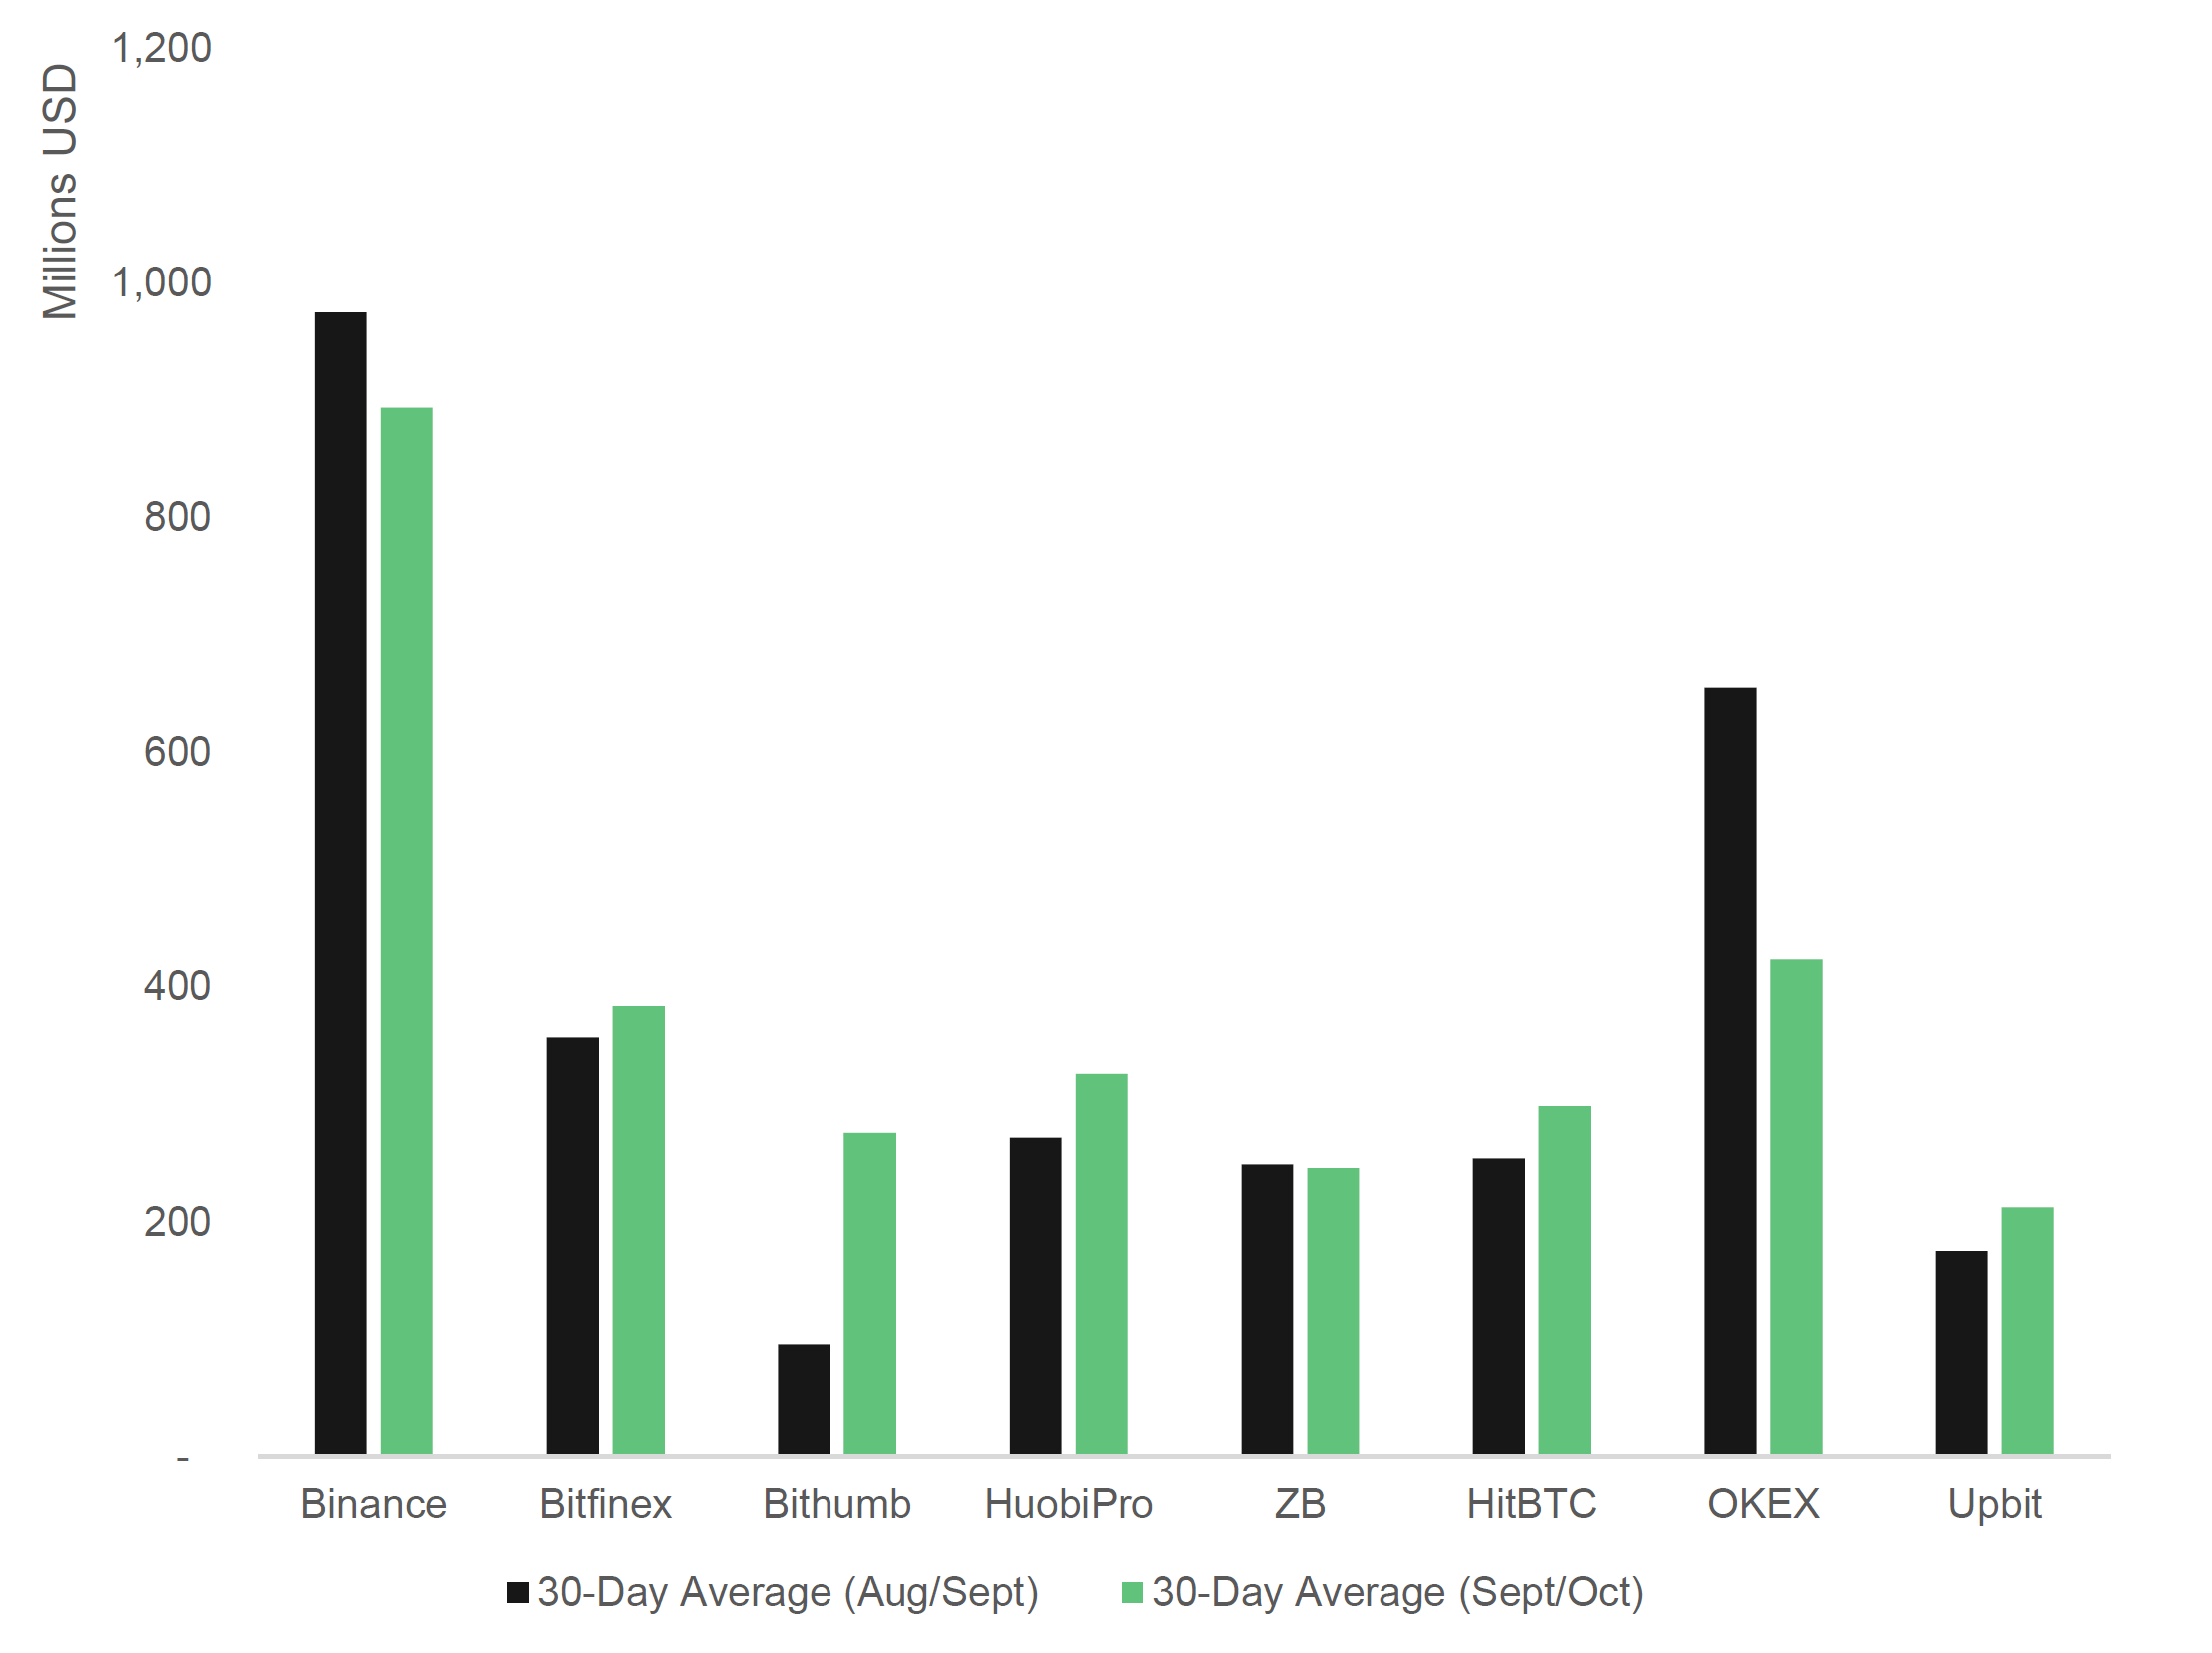
Average Bithumb volumes increased 187%, while those for Binance and OKEX dropped by 8% and 35% respectively
Korean exchange Bithumb saw a significant increase in average trading volumes from 96 million USD between August/September to 276 million between September/October. Meanwhile, Binance’s volumes over the same time period dropped from 974 million USD to 893 million USD. Finally, the 2nd largest exchange by 24h volumes, OKEX, saw trading volumes drop 655 million USD to 423 million USD.
Country Analysis
Exchanges maintain operations in a variety of countries, in order to serve the wider global community of cryptocurrency traders. They often change legal jurisdiction to avoid regulation in countries that might restrict their abilities to conduct business as they wish. The following country analysis aims to highlight the top 10 legal jurisdictions by the total 24h volume produced by the top exchanges legally based in each jurisdiction.
Top 10 Exchange Legal Jurisdictions – 24h Volume vs Exchange Count
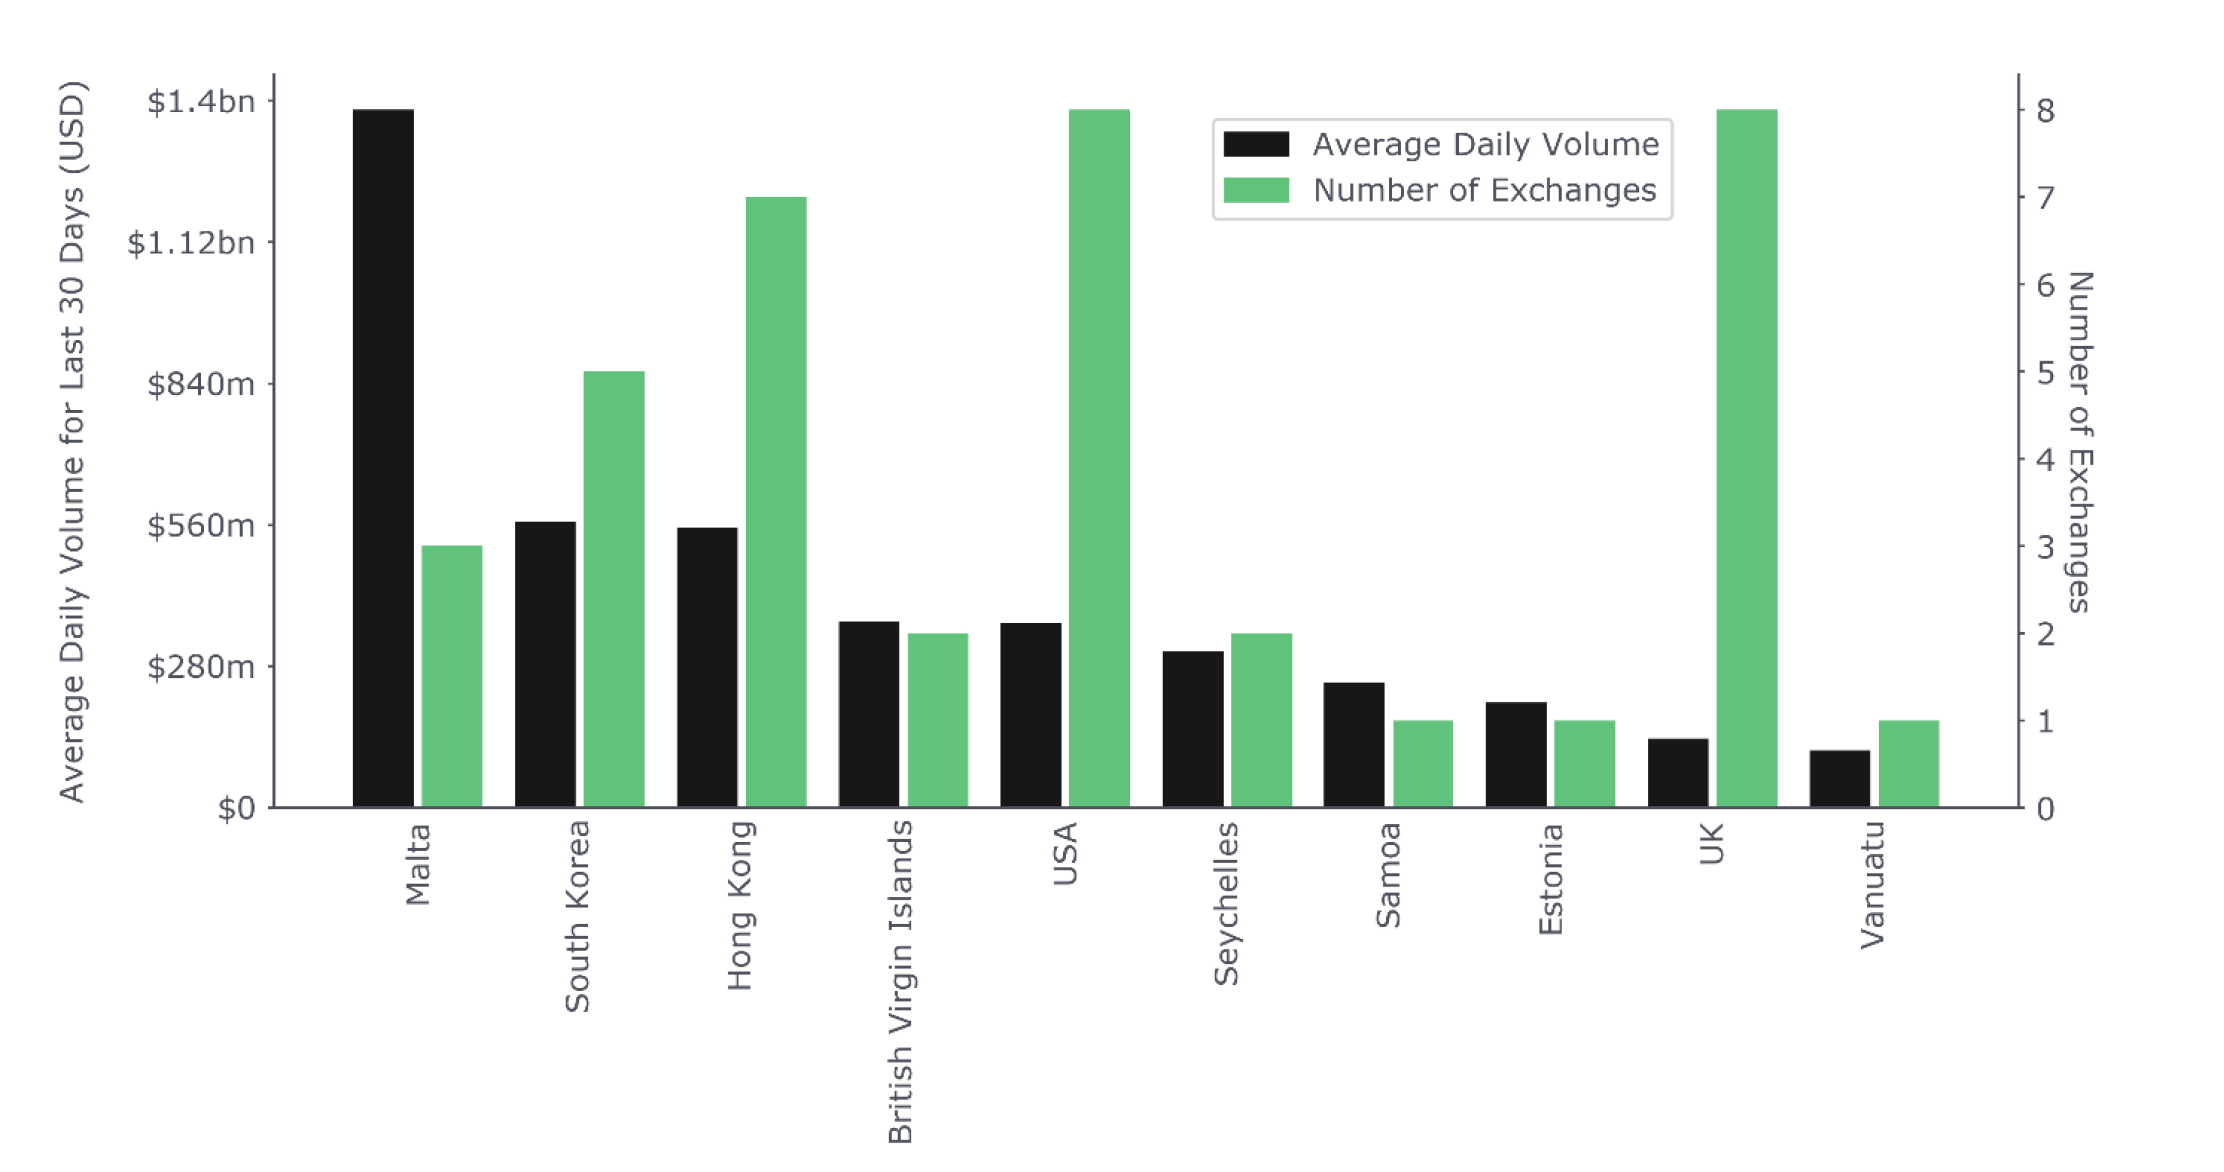
Maltese-based exchanges produced the highest total daily volumes, while the highest quantity of top exchanges are based in the USA and the UK.
Maltese exchanges produce the highest total daily volume at just under 1.4 billion USD, followed by those based legally in South-Korea (~840 million USD) and Hong Kong (~560 million USD). Among the top 10 volume-producing countries, the highest number of exchanges (with significant volume) are based legally in the USA, the UK and Hong Kong.
Top 10 Exchange Legal Jurisdictions – Constituent Exchanges by Impact on Volume
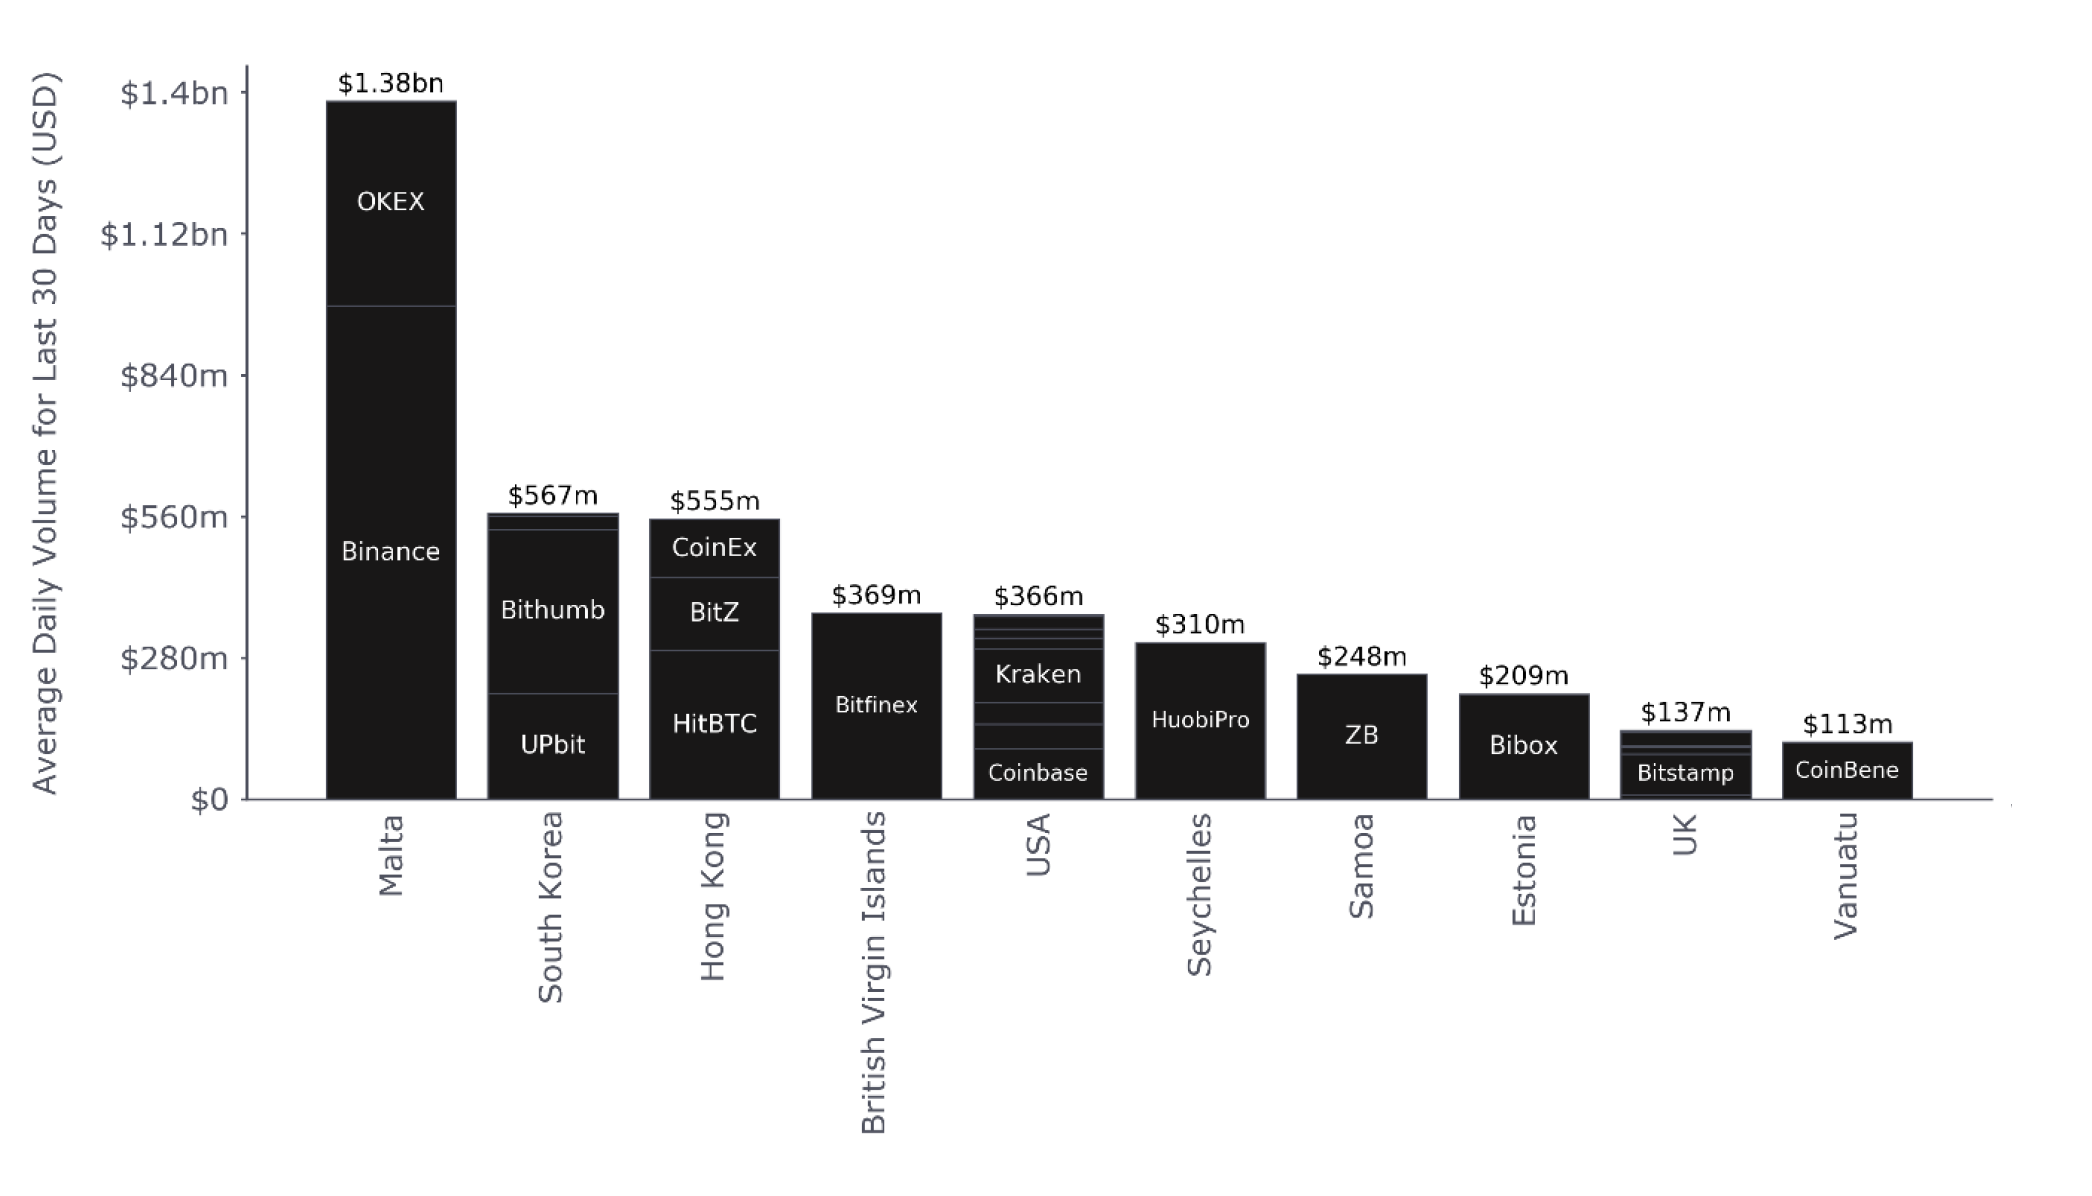
Binance and OKEX represent the vast majority of Malta’s volumes, while Bithumb and Upbit dominate in South Korea.
Top 10 Exchange Legal Jurisdictions – Constituent Exchanges and Count
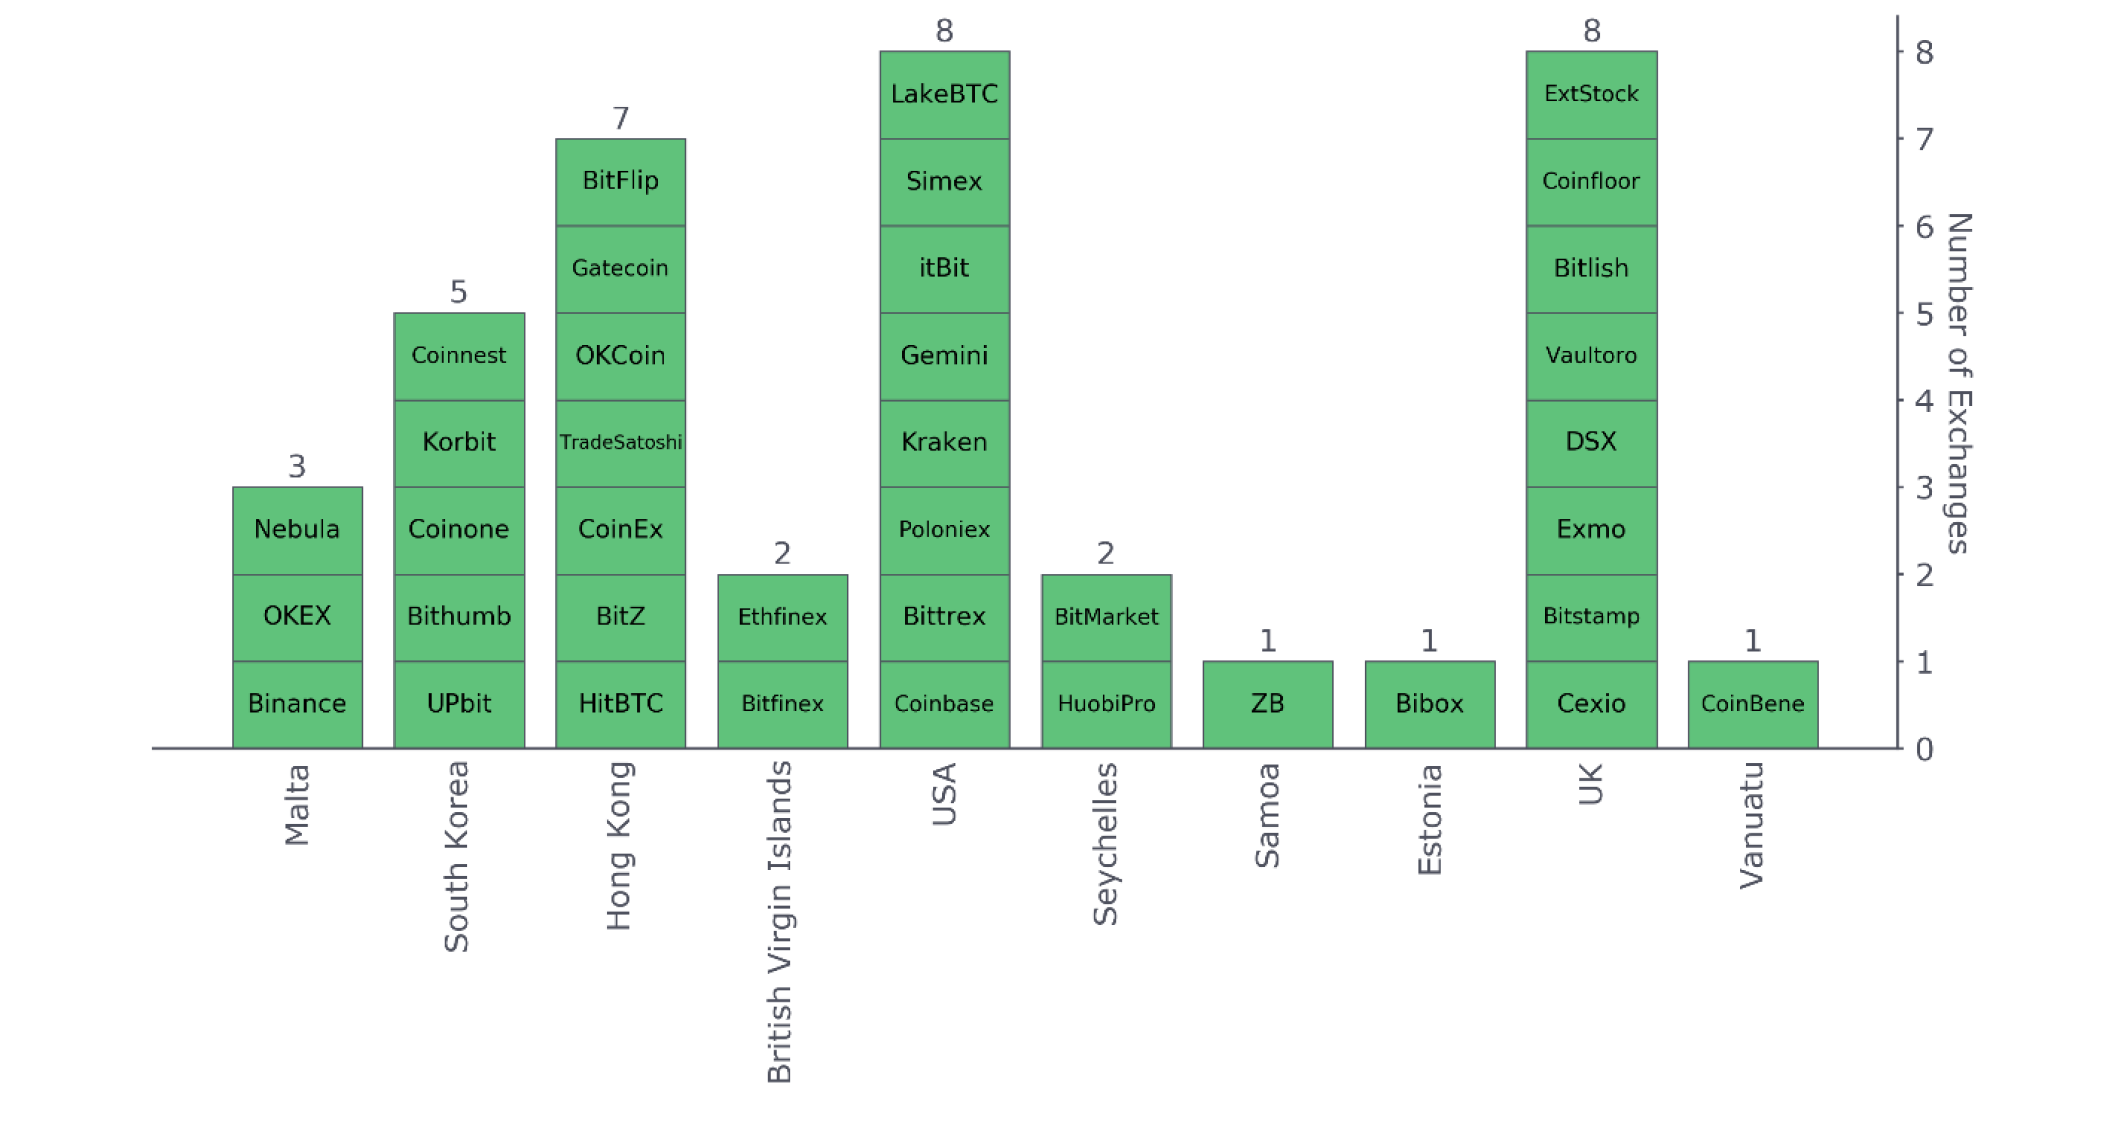
Well-known USA-based exchanges include Coinbase, Poloniex, and itBit, while those in South Korea include Upbit, Bithumb and Coinone.
Hong Kong exchanges include HitBTC, CoinEx and Bit-Z, while those in more remote jurisdictions include HuobiPro in the Seychelles, ZB in Samoa and Coinbene in Vanuatu.
Pair Offering Analysis
The following analysis aims to highlight both the total volumes produced by crypto-crypto vs fiat-crypto exchanges as well as the total number of exchanges that fall within each category.
Crypto to Crypto vs Fiat to Crypto – Average 24H Volume and Exchange Count
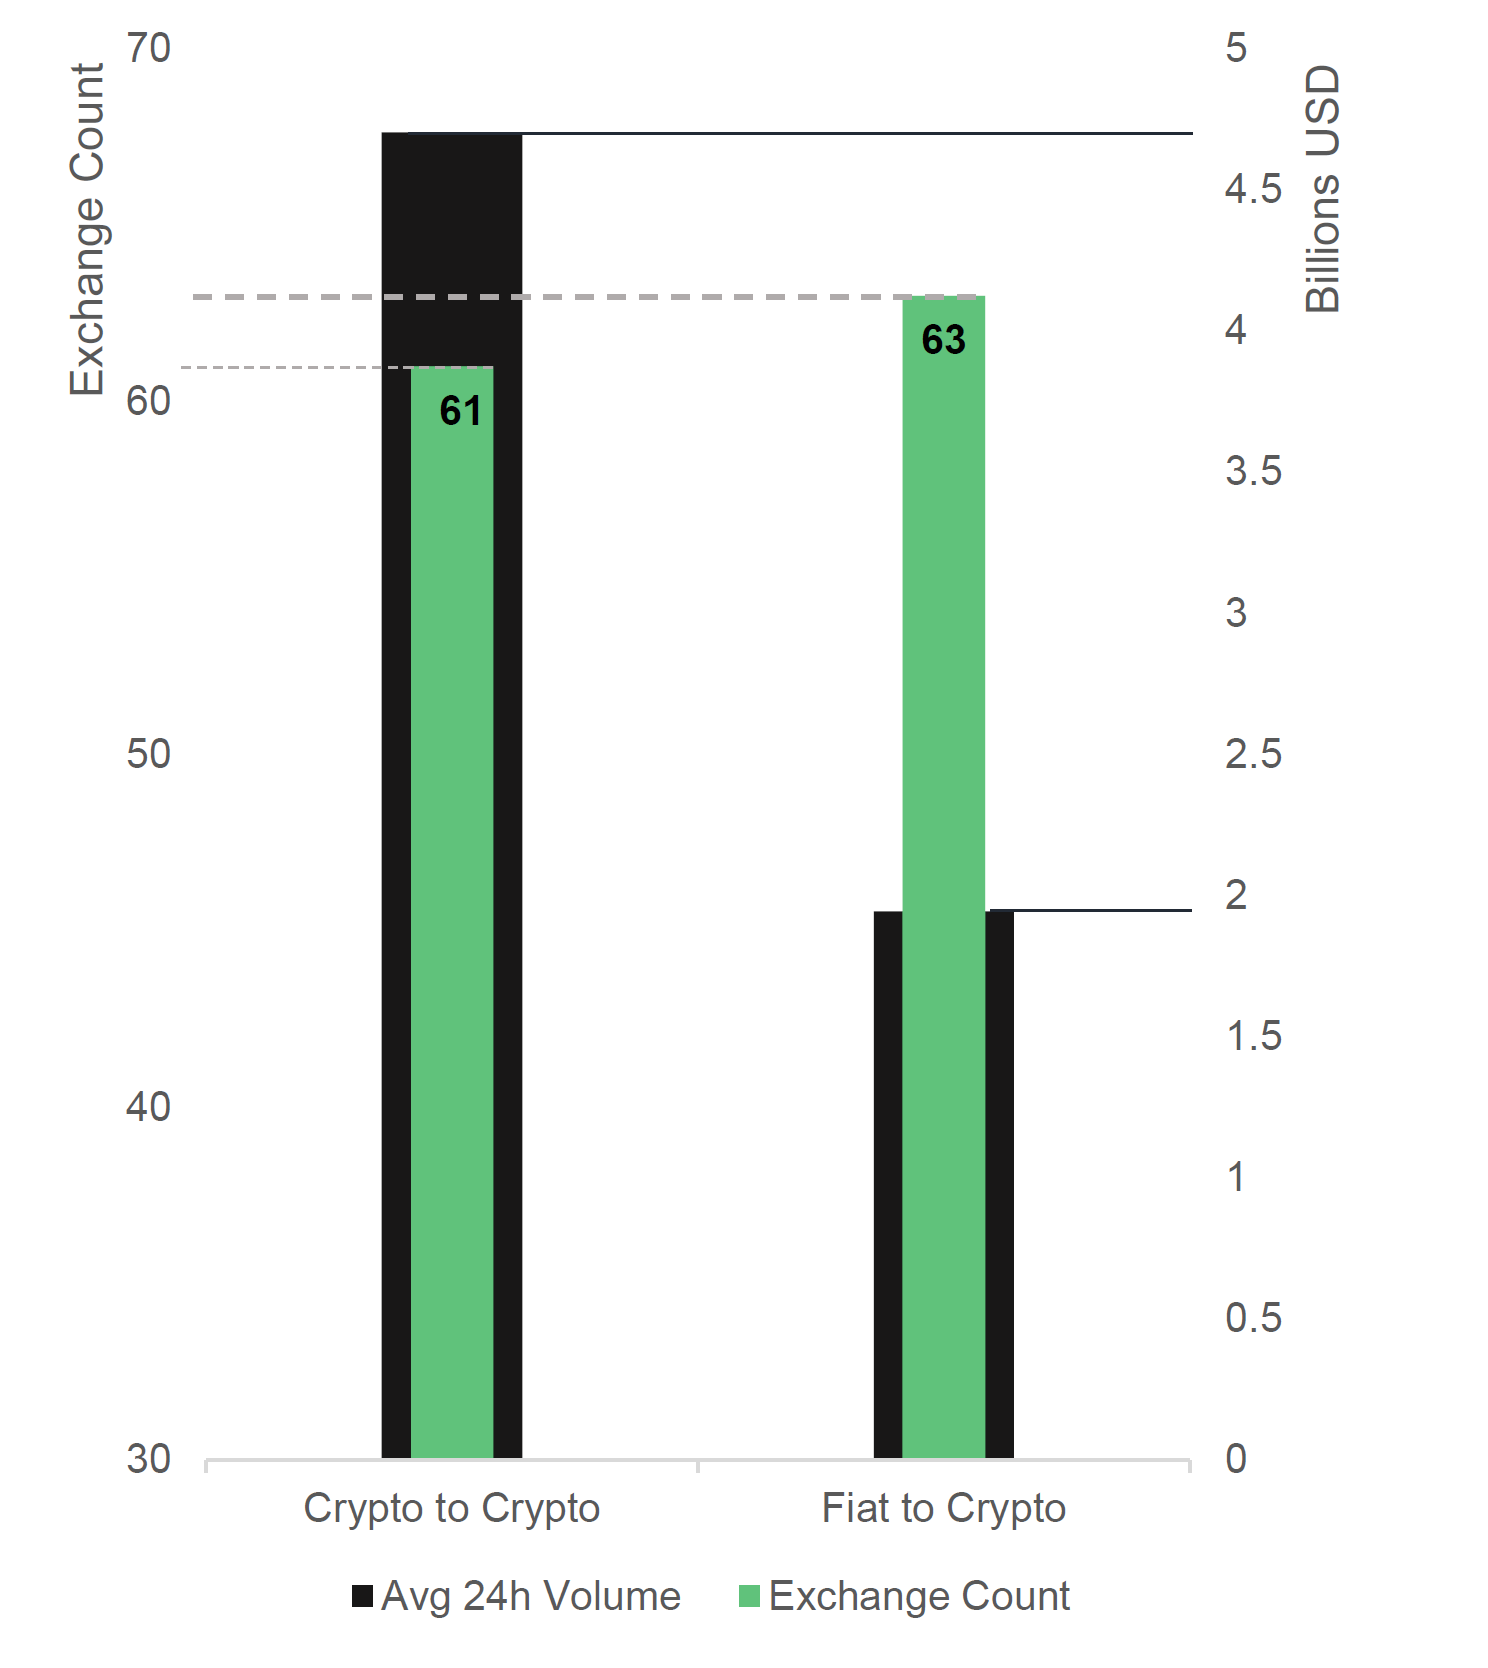
On average, exchanges that offer only crypto-crypto pairs constitute approximately three quarters of the total spot trading market (~4.7 billion USD)
Those that that offer fiat-crypto pairs constitute only a quarter of the total exchange market (~2 billion USD) on average. In terms of exchange count, approximately half of all exchanges offer crypto-crypto.
Trade Data Analysis
This analysis aims to shed light on the trading characteristics of given exchange. It helps to answer whether an exchange’s volumes might be the product of consistently large trades, or the product of many small trades which may suggest the use of algorithmic trading or bots.
Average 24H Trade Frequency vs Average Trade Size – Top 25 Exchanges
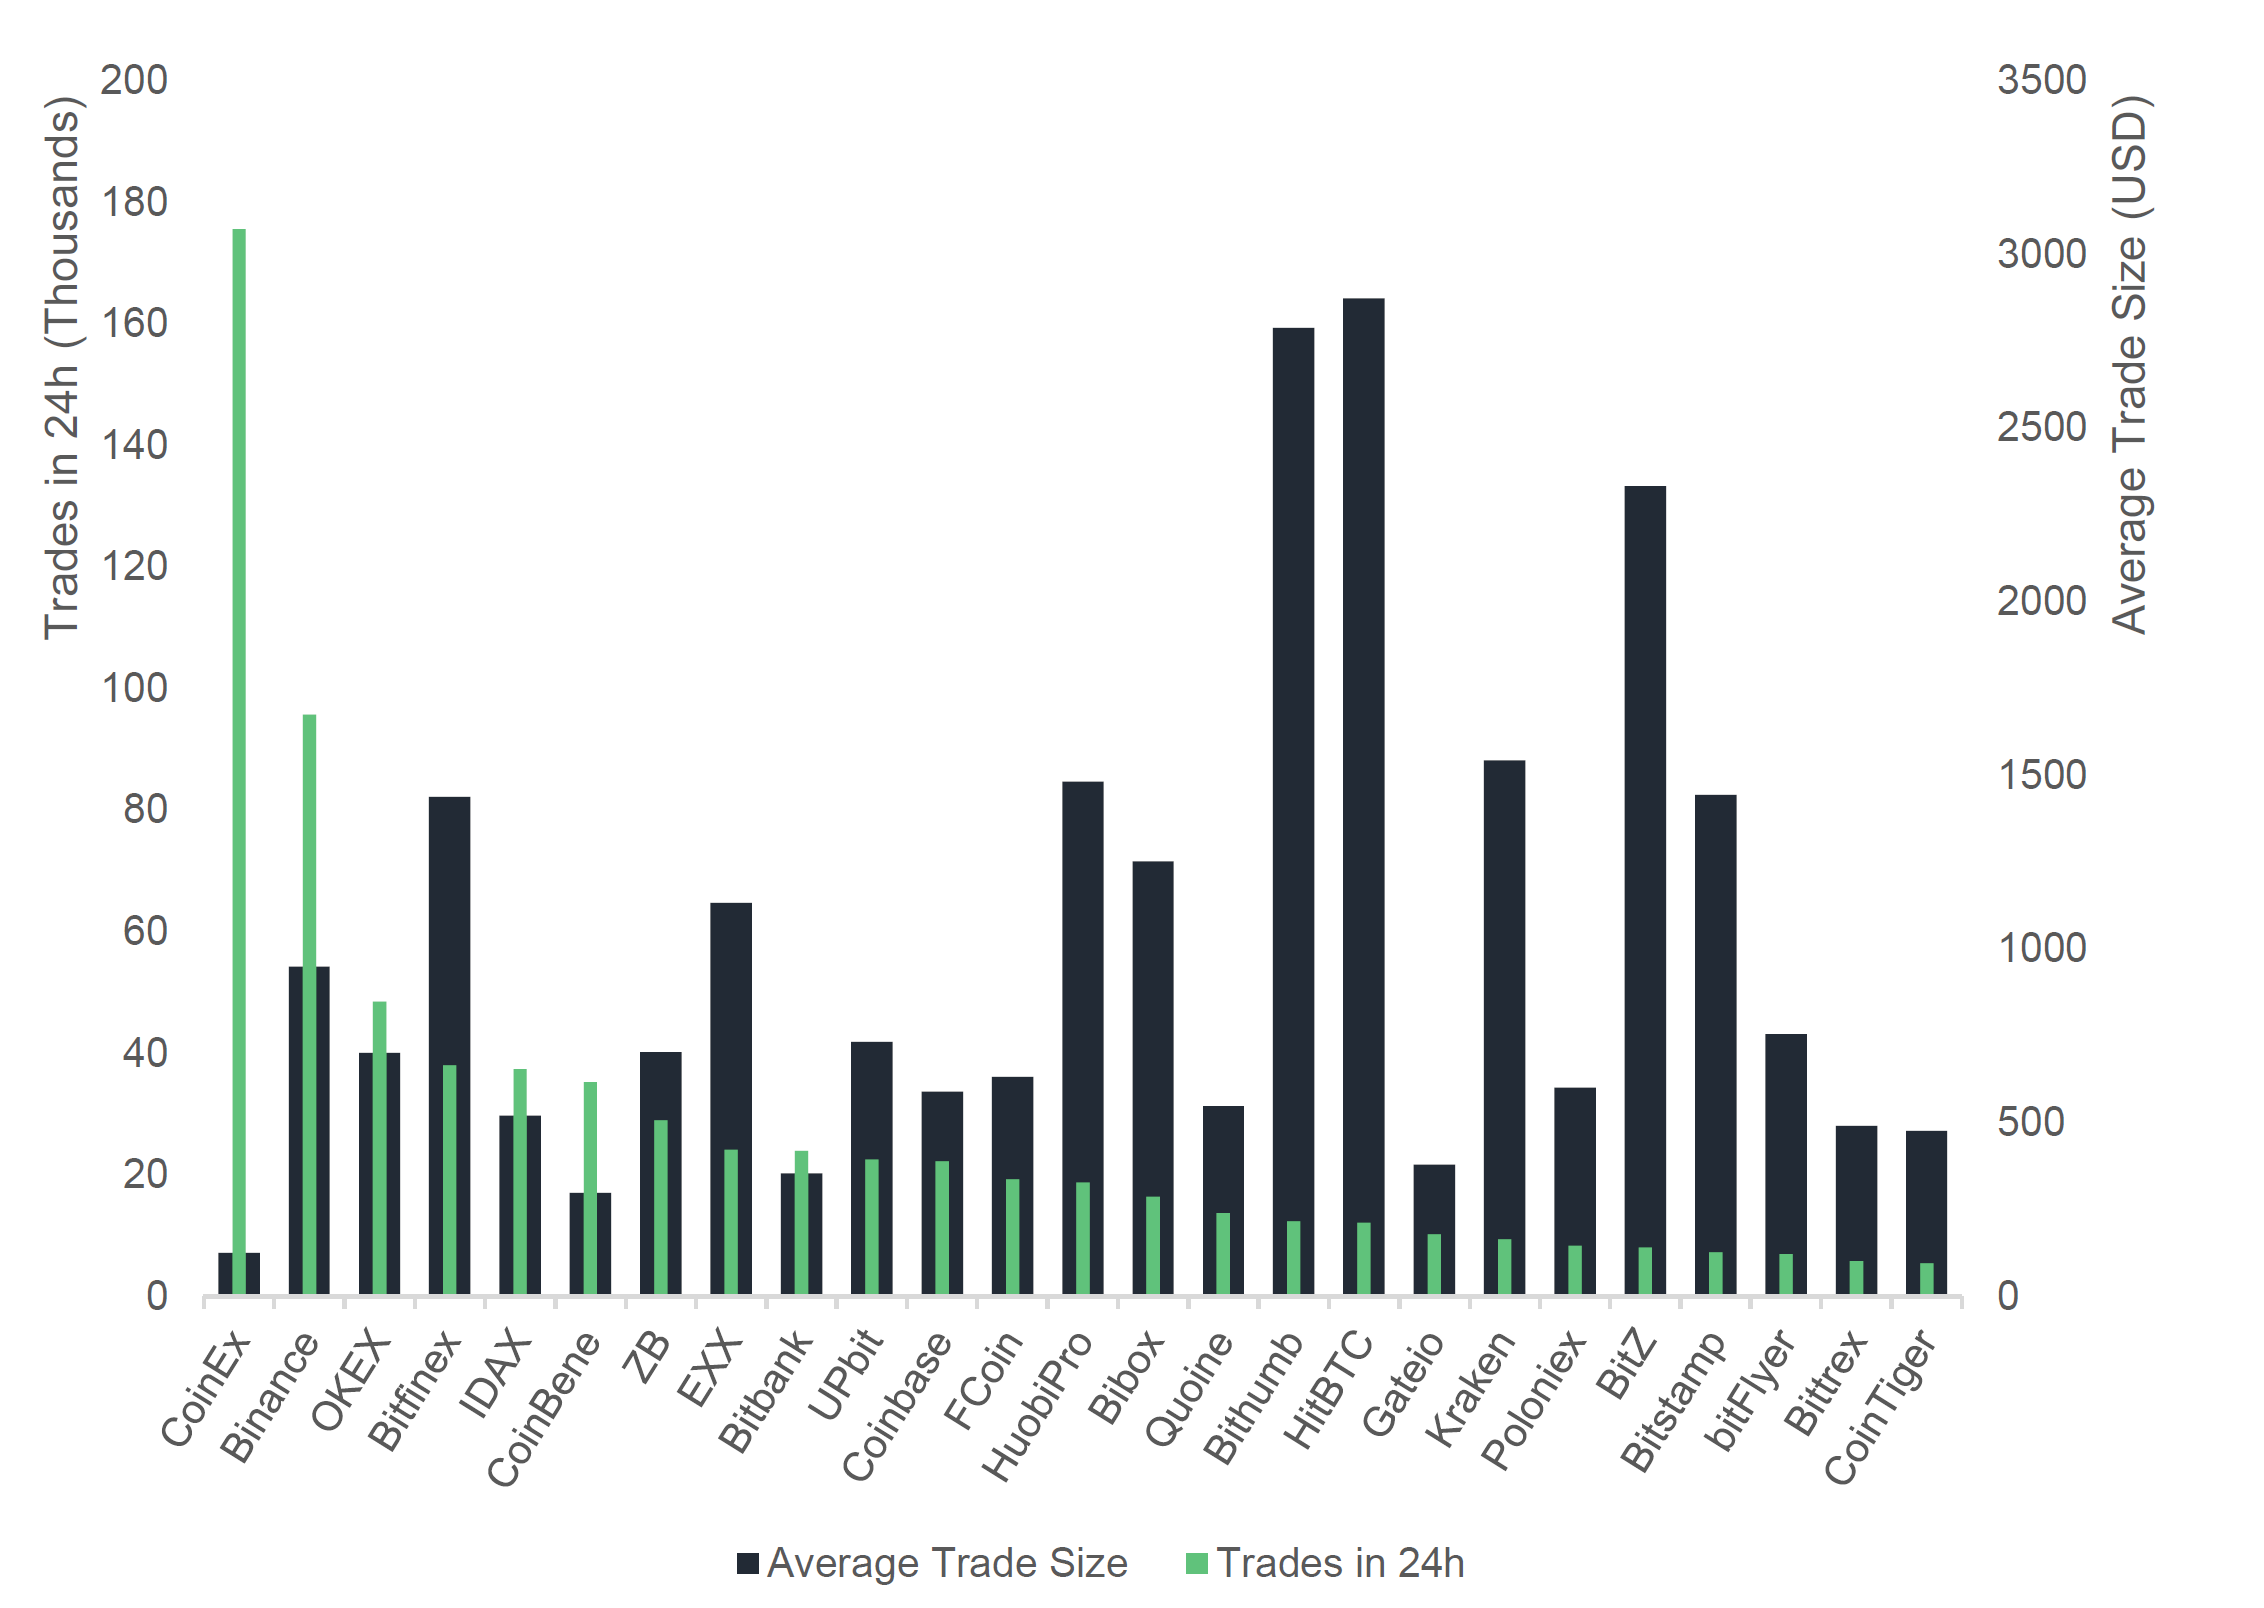
CoinEx, a well-known trans-fee mining exchange, has a significantly higher trade frequency and lower trade size than other exchanges in the top 25.
This may point to algorithmic trading, given its almost 176 thousand daily trades at an average trade size of 125 USD. In contrast, Bithumb and HuobiPro had an average trade size of just under 3,000 and 1,500 USD respectively.
Average 24H Trade Frequency vs Average Trade Size – Top Exchanges
| Exchange | AVG 24H Volume (Millions) | Average Trade Size (USD) | Trades in 24H (Thousands) | |
| 1 | Binance | 977.5 | 950 | 95.7 |
| 2 | OKEX | 405 | 701 | 48.5 |
| 3 | Bitfinex | 368.5 | 1,438 | 38 |
| 4 | Bithumb | 323.2 | 2,788 | 12.4 |
| 5 | HuobiPro | 310.2 | 1,483 | 18.7 |
| 6 | HitBTC | 295.2 | 2,873 | 12.1 |
| 7 | ZB | 247.6 | 702 | 29 |
| 8 | UPbit | 211 | 732 | 22.5 |
| 9 | Bibox | 208.9 | 1,253 | 16.4 |
| 10 | EXX | 159.9 | 1,134 | 24.1 |
| 11 | BitZ | 143.9 | 2,333 | 8 |
| 12 | IDAX | 131.5 | 520 | 37.4 |
| 13 | CoinEx | 113.6 | 125 | 175.6 |
| 14 | CoinBene | 113.2 | 298 | 35.2 |
Web Traffic Analysis
This analysis examines the web traffic stats of the top exchanges within CryptoCompare’s total pool of exchanges. It is based on similar studies that have attempted to make a connection between the number of unique web users per domain and the subsequent 24h trading volume for that specific domain. This analysis assumes that the more unique visitors an exchange attracts, the higher its trading volume.
Average Daily Visitors versus 24H Volume – Alexa Rankings Above 100,000
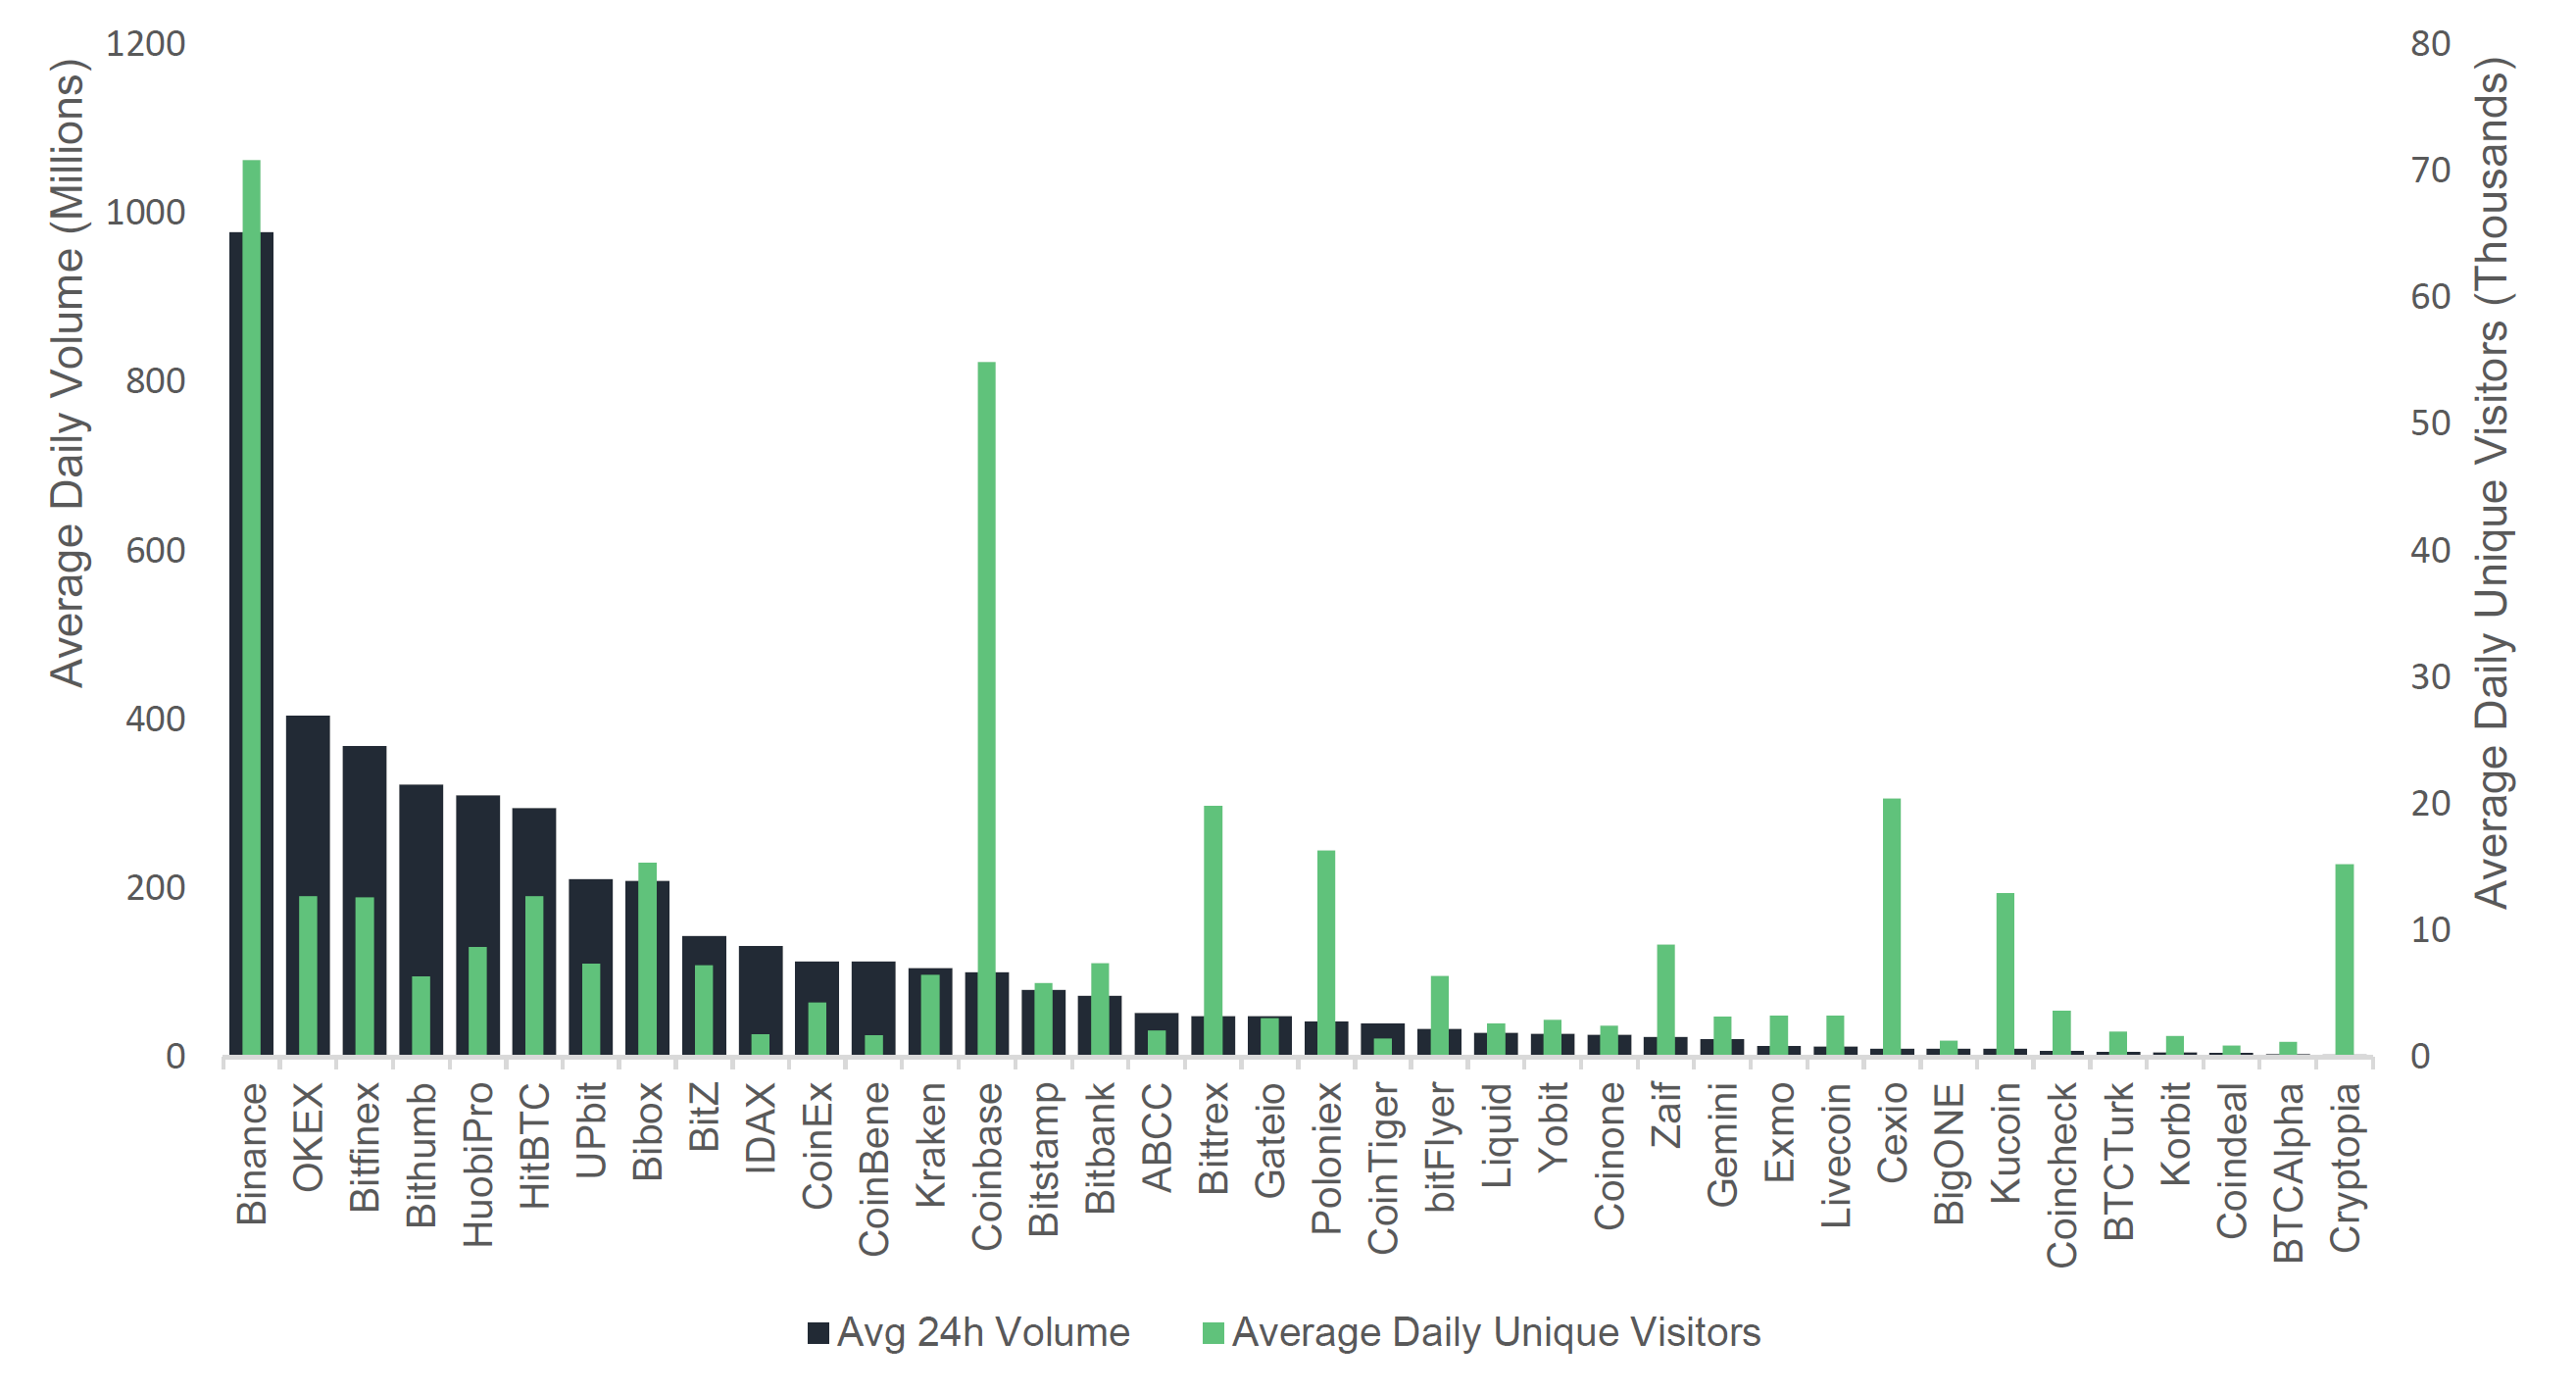
IDAX and CoinBene appear to have lower average daily visitors compared to similarly sized exchanges by daily volume.
The figure above represents the top exchanges by volume that have an Alexa ranking above 100,000. The reason for this is that according to Alexa, any ranking below this may not be statistically significant.
What we can see that exchanges such as IDAX and CoinBene have lower Average Daily Unique Visitor numbers than other exchanges with similar volumes such as Kraken, Bitstamp, and CoinEx.
Binance has the highest average daily visitor count, in line with its high trading volumes. Meanwhile, exchanges such as Coinbase, Cex.io and Bittrex have significantly greater numbers of daily visitors than other exchanges with similar daily volumes. In Coinbase’s case, this can be attributed to the exchange’s reputation and age.
Average Daily Visitors versus 24H Volume – All Alexa Rankings
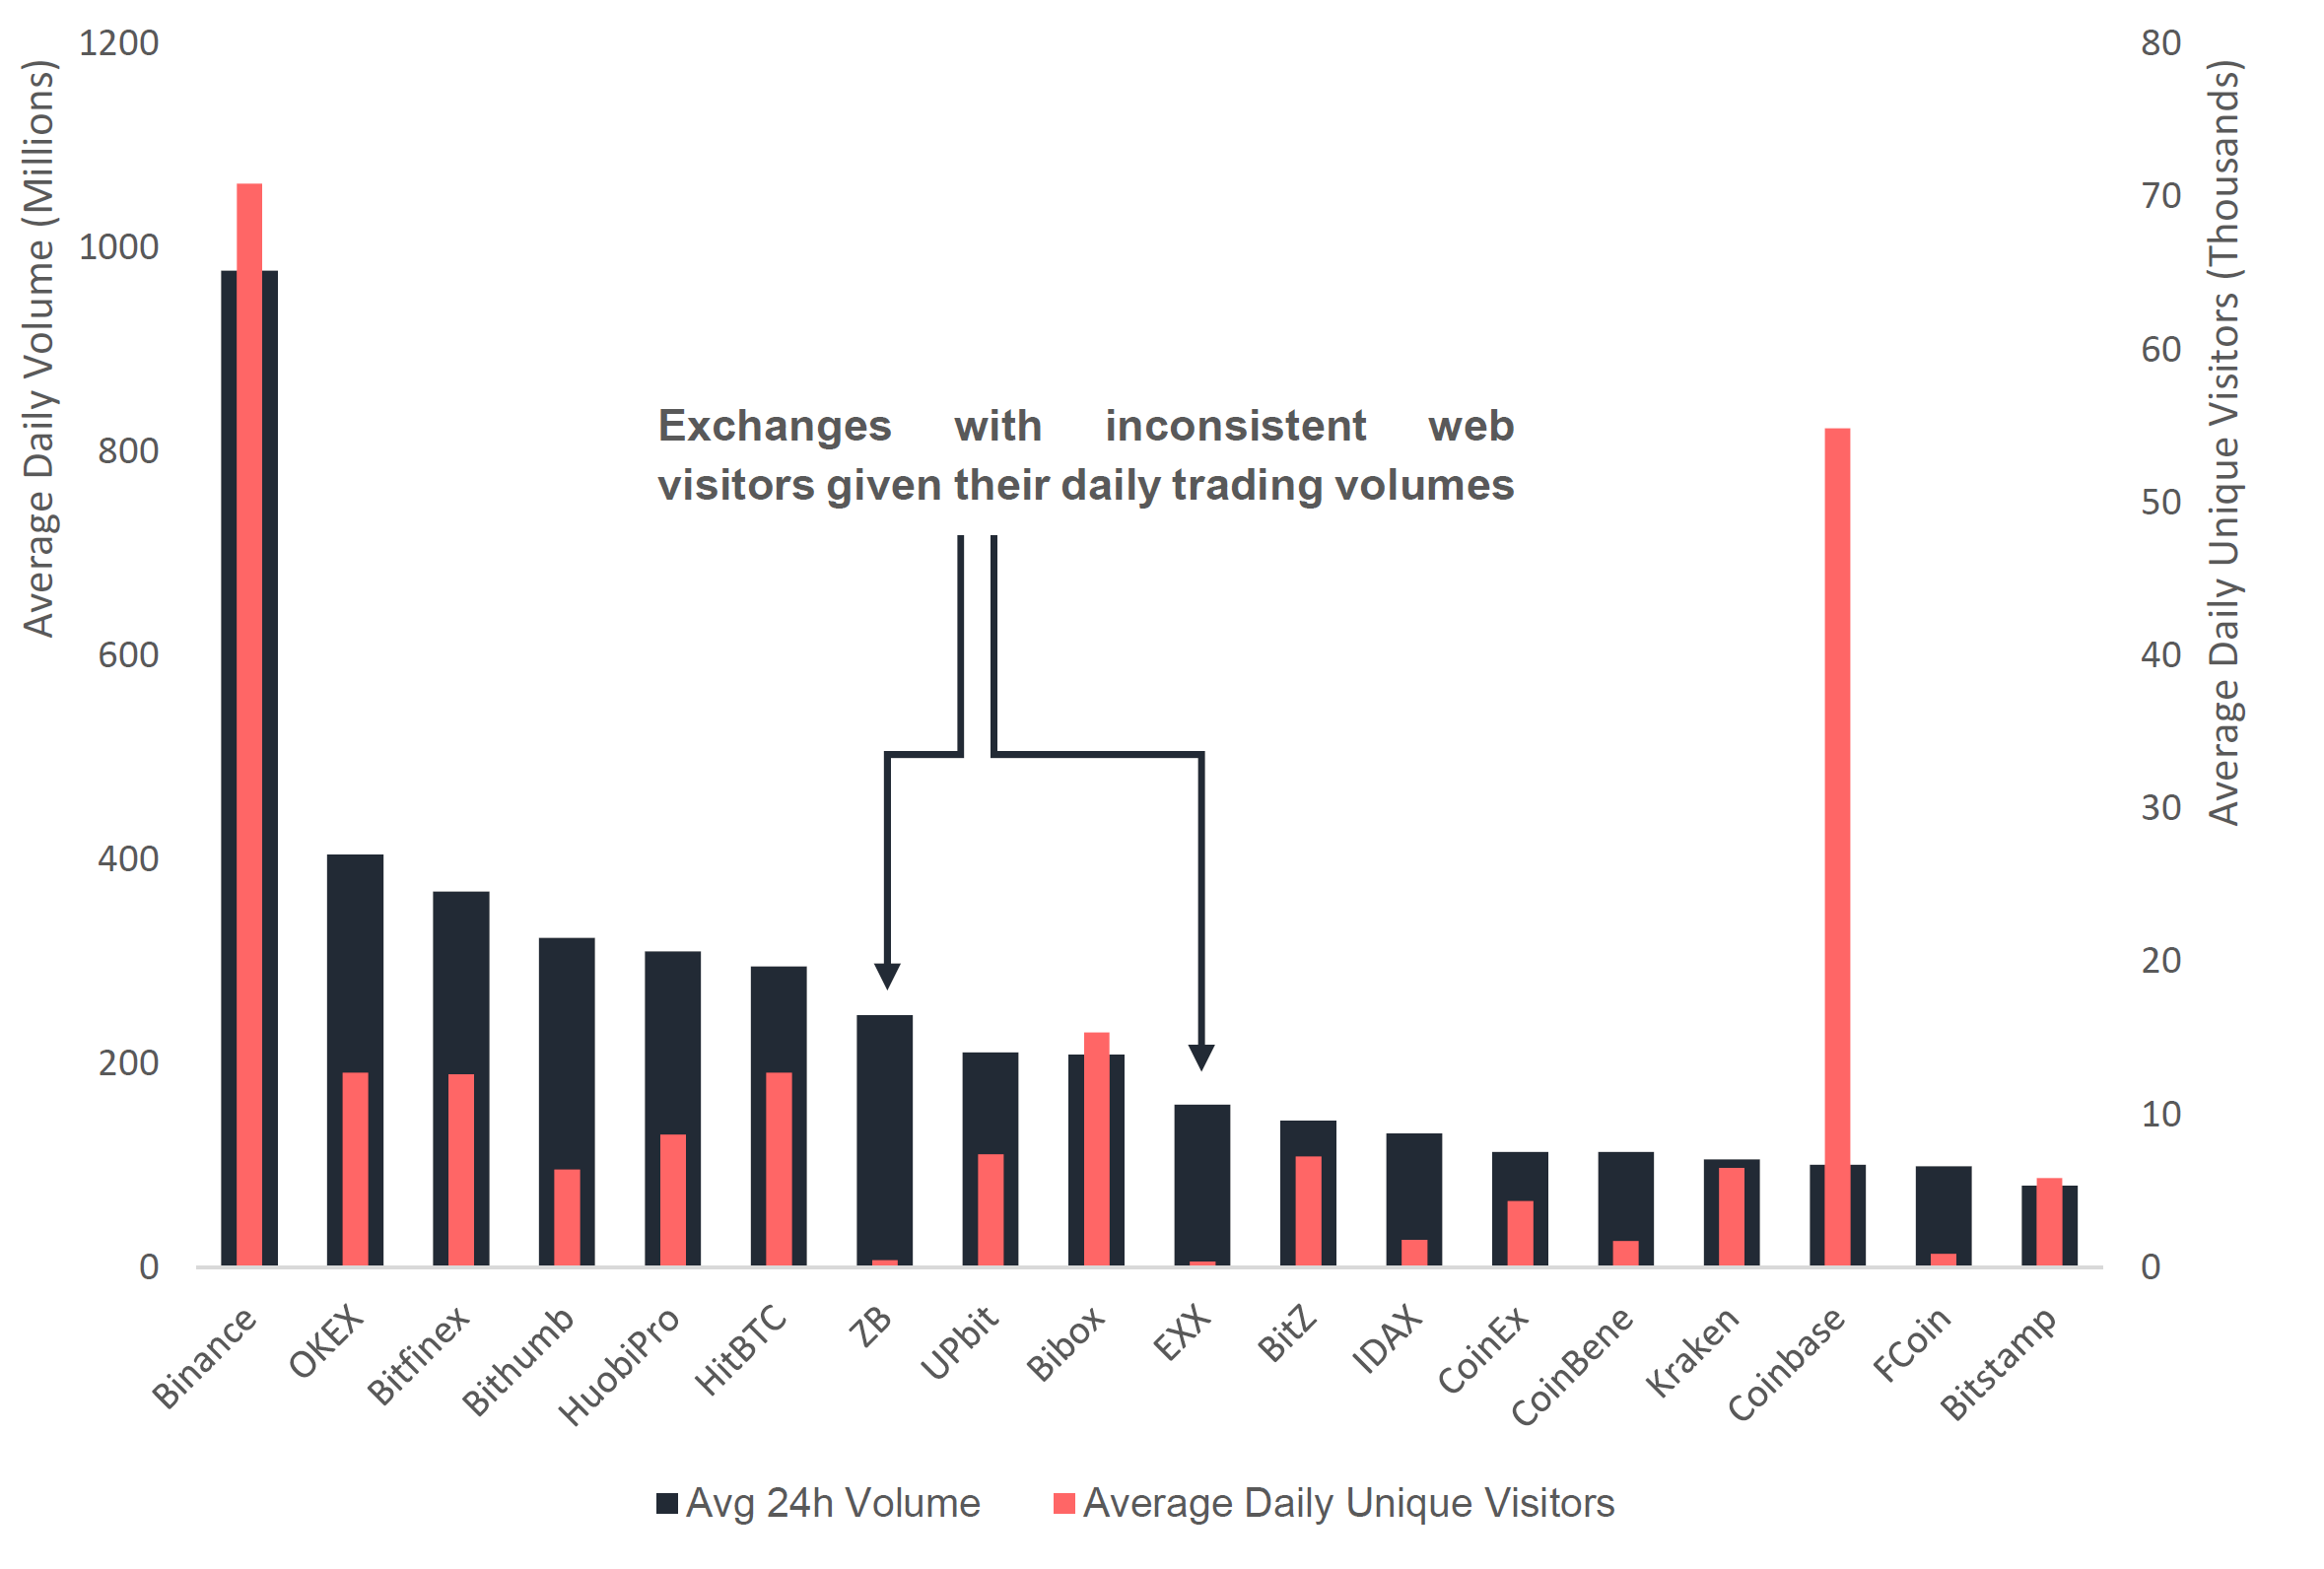
ZB and EXX attract significantly lower daily visitors than similarly-sized exchanges.
The above figure represents the top 20 exchanges by 24h volume regardless of whether their Alexa rankings are below 100,000. Noticeably, unique visitor counts for exchanges ZB and EXX are significantly lower than other exchanges within a similar 24h volume band.
These exchanges maintain average daily trading volumes of 248 million and 160 million USD
respectively. Despite this, their daily unique visitor counts amount to no more than 700 visitors per day.
Although there is a chance that these web statistics may present errors given Alexa rankings below 100,000, in the interests of mitigating any potential risks, these exchanges will be flagged until clarification is provided.
Order Book Analysis
The following order book analysis investigates the relative stability of various cryptocurrency exchanges based on snapshots of the average order book depth for the top markets on each exchange in 10-minute intervals over a period of 10 days. In the context of this analysis, average depth down is defined as the cumulative volume required (in USD) to reduce the price of a given market by 10%. This is compared to the average daily volume for the top 5 pairs. The result of this analysis is that we are able estimate the relative stability of a given exchange based on the ratio of depth down to average daily pair volume.
Average Order Book Depth Down vs Average Daily Exchange Pair Volume
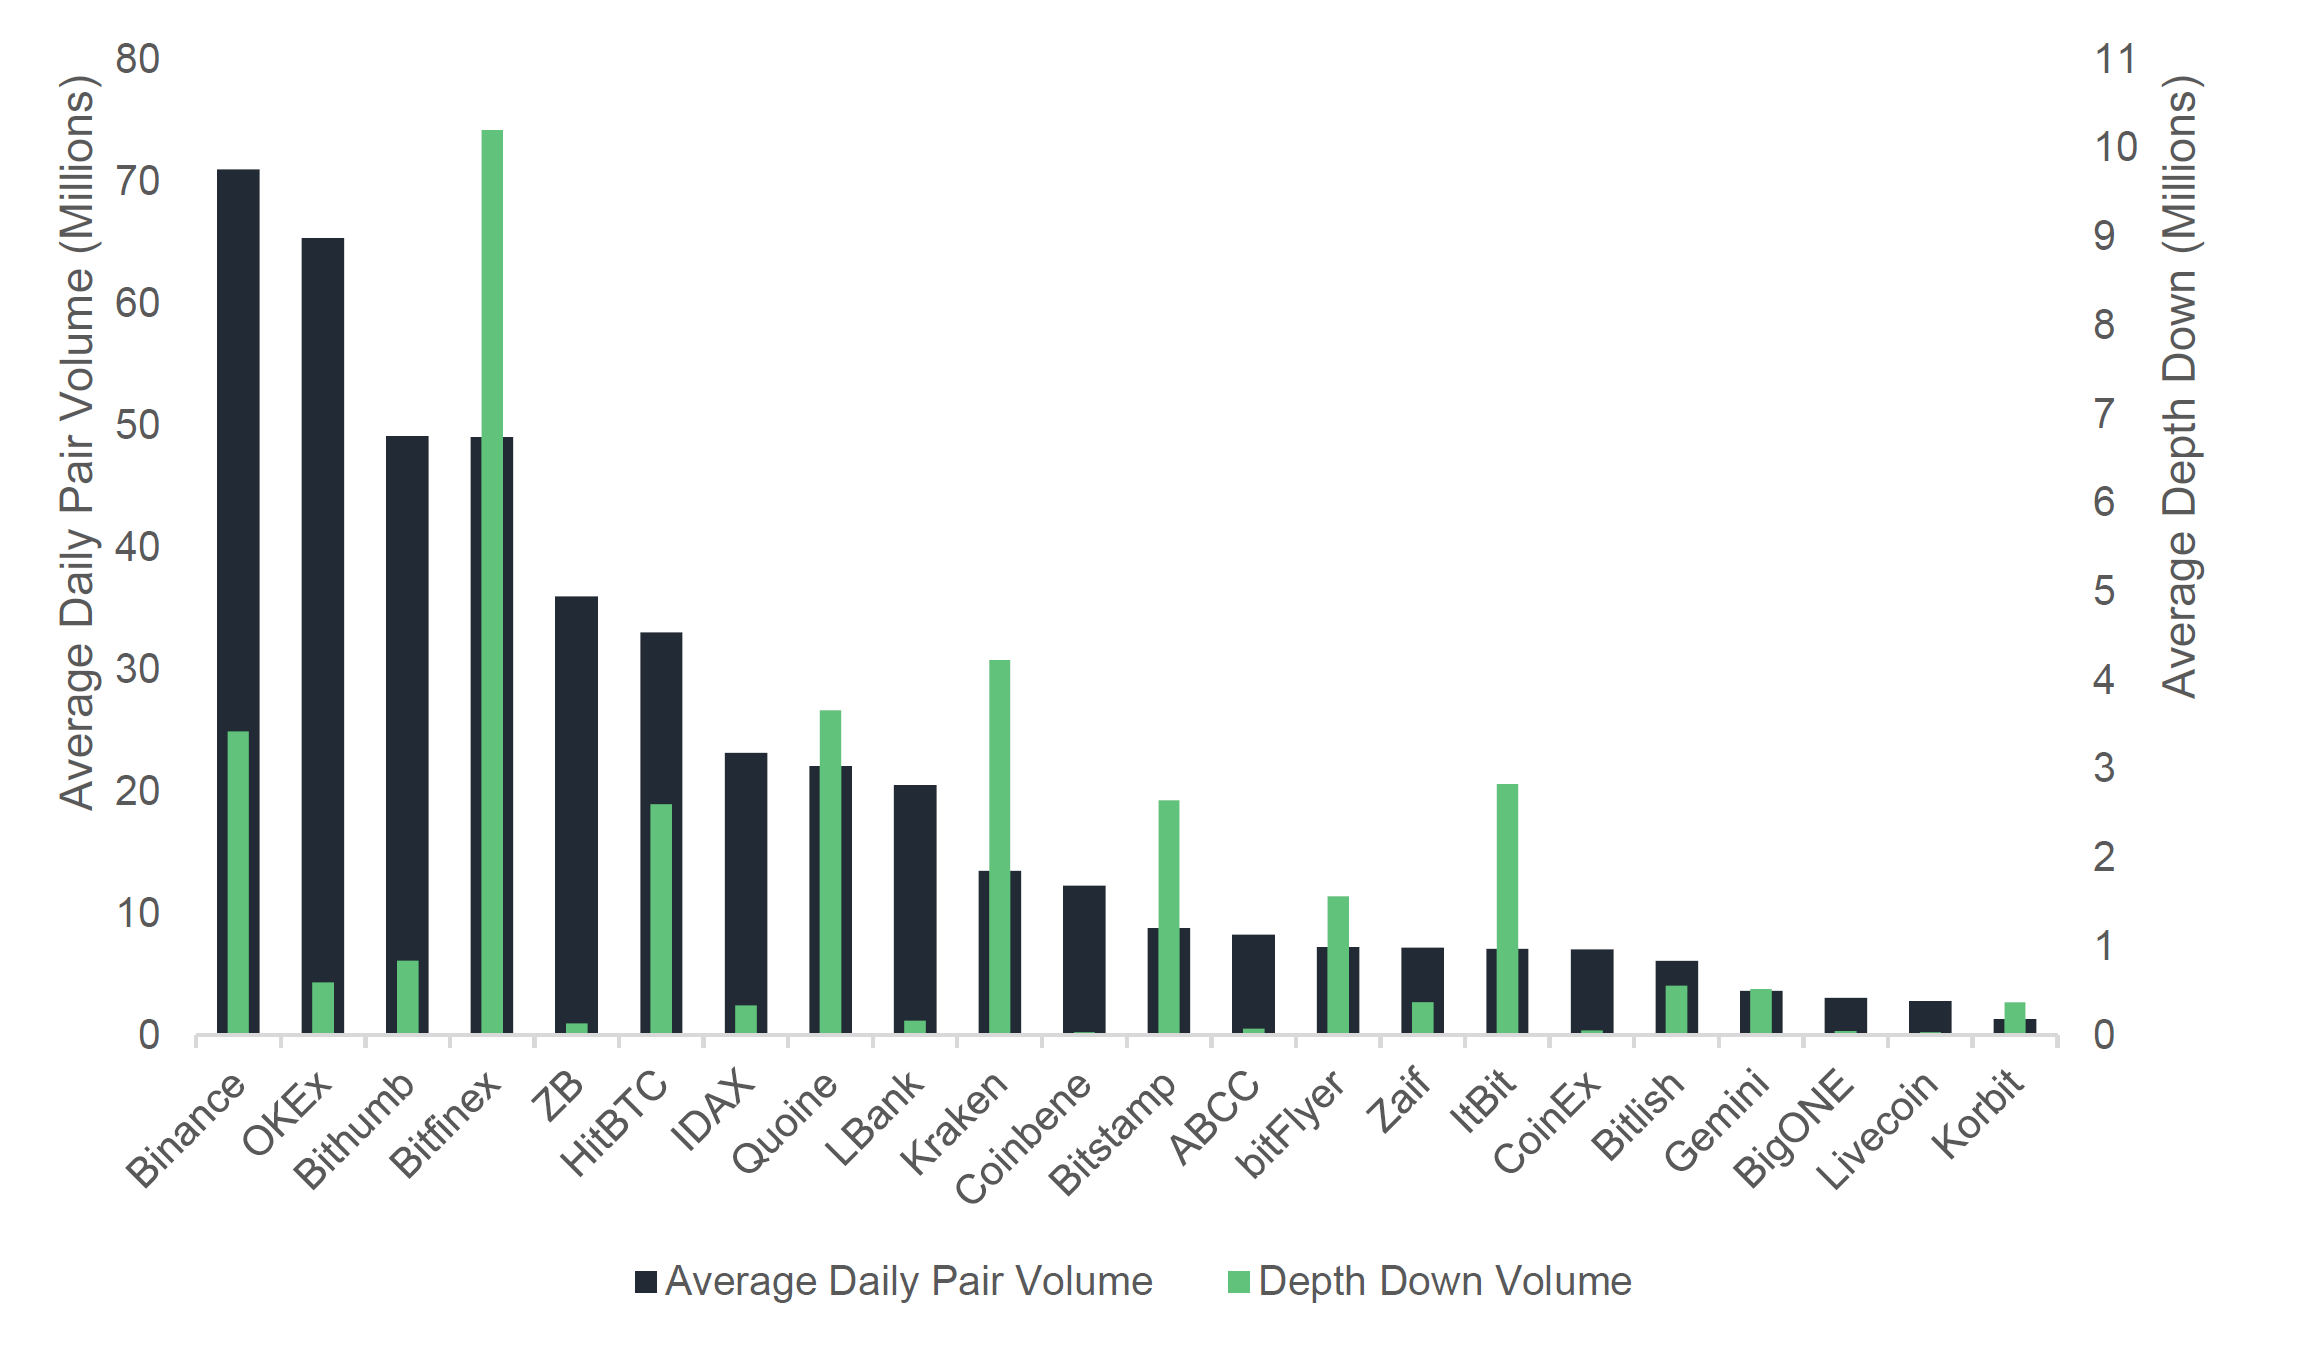
In relative terms, CoinBene, ZB and CoinEx have the thinnest markets.
Despite relatively large average volumes per top pair (~12 million USD), CoinBene’s average order book cumulative depth down (order book buy side) totals only 33 thousand USD. In other words, to move the price 10% downwards, a trader would need to sell 33 thousand USD worth of currency.
In contrast, Kraken which has similar average daily pair volumes (~13.5 million USD), has an average order book cumulative depth of 4.2 million USD. This is almost 130 times larger than that of CoinBene’s and therefore suggests a much more stable exchange.
Average Depth Down to Average 24H Pair Volume Ratio
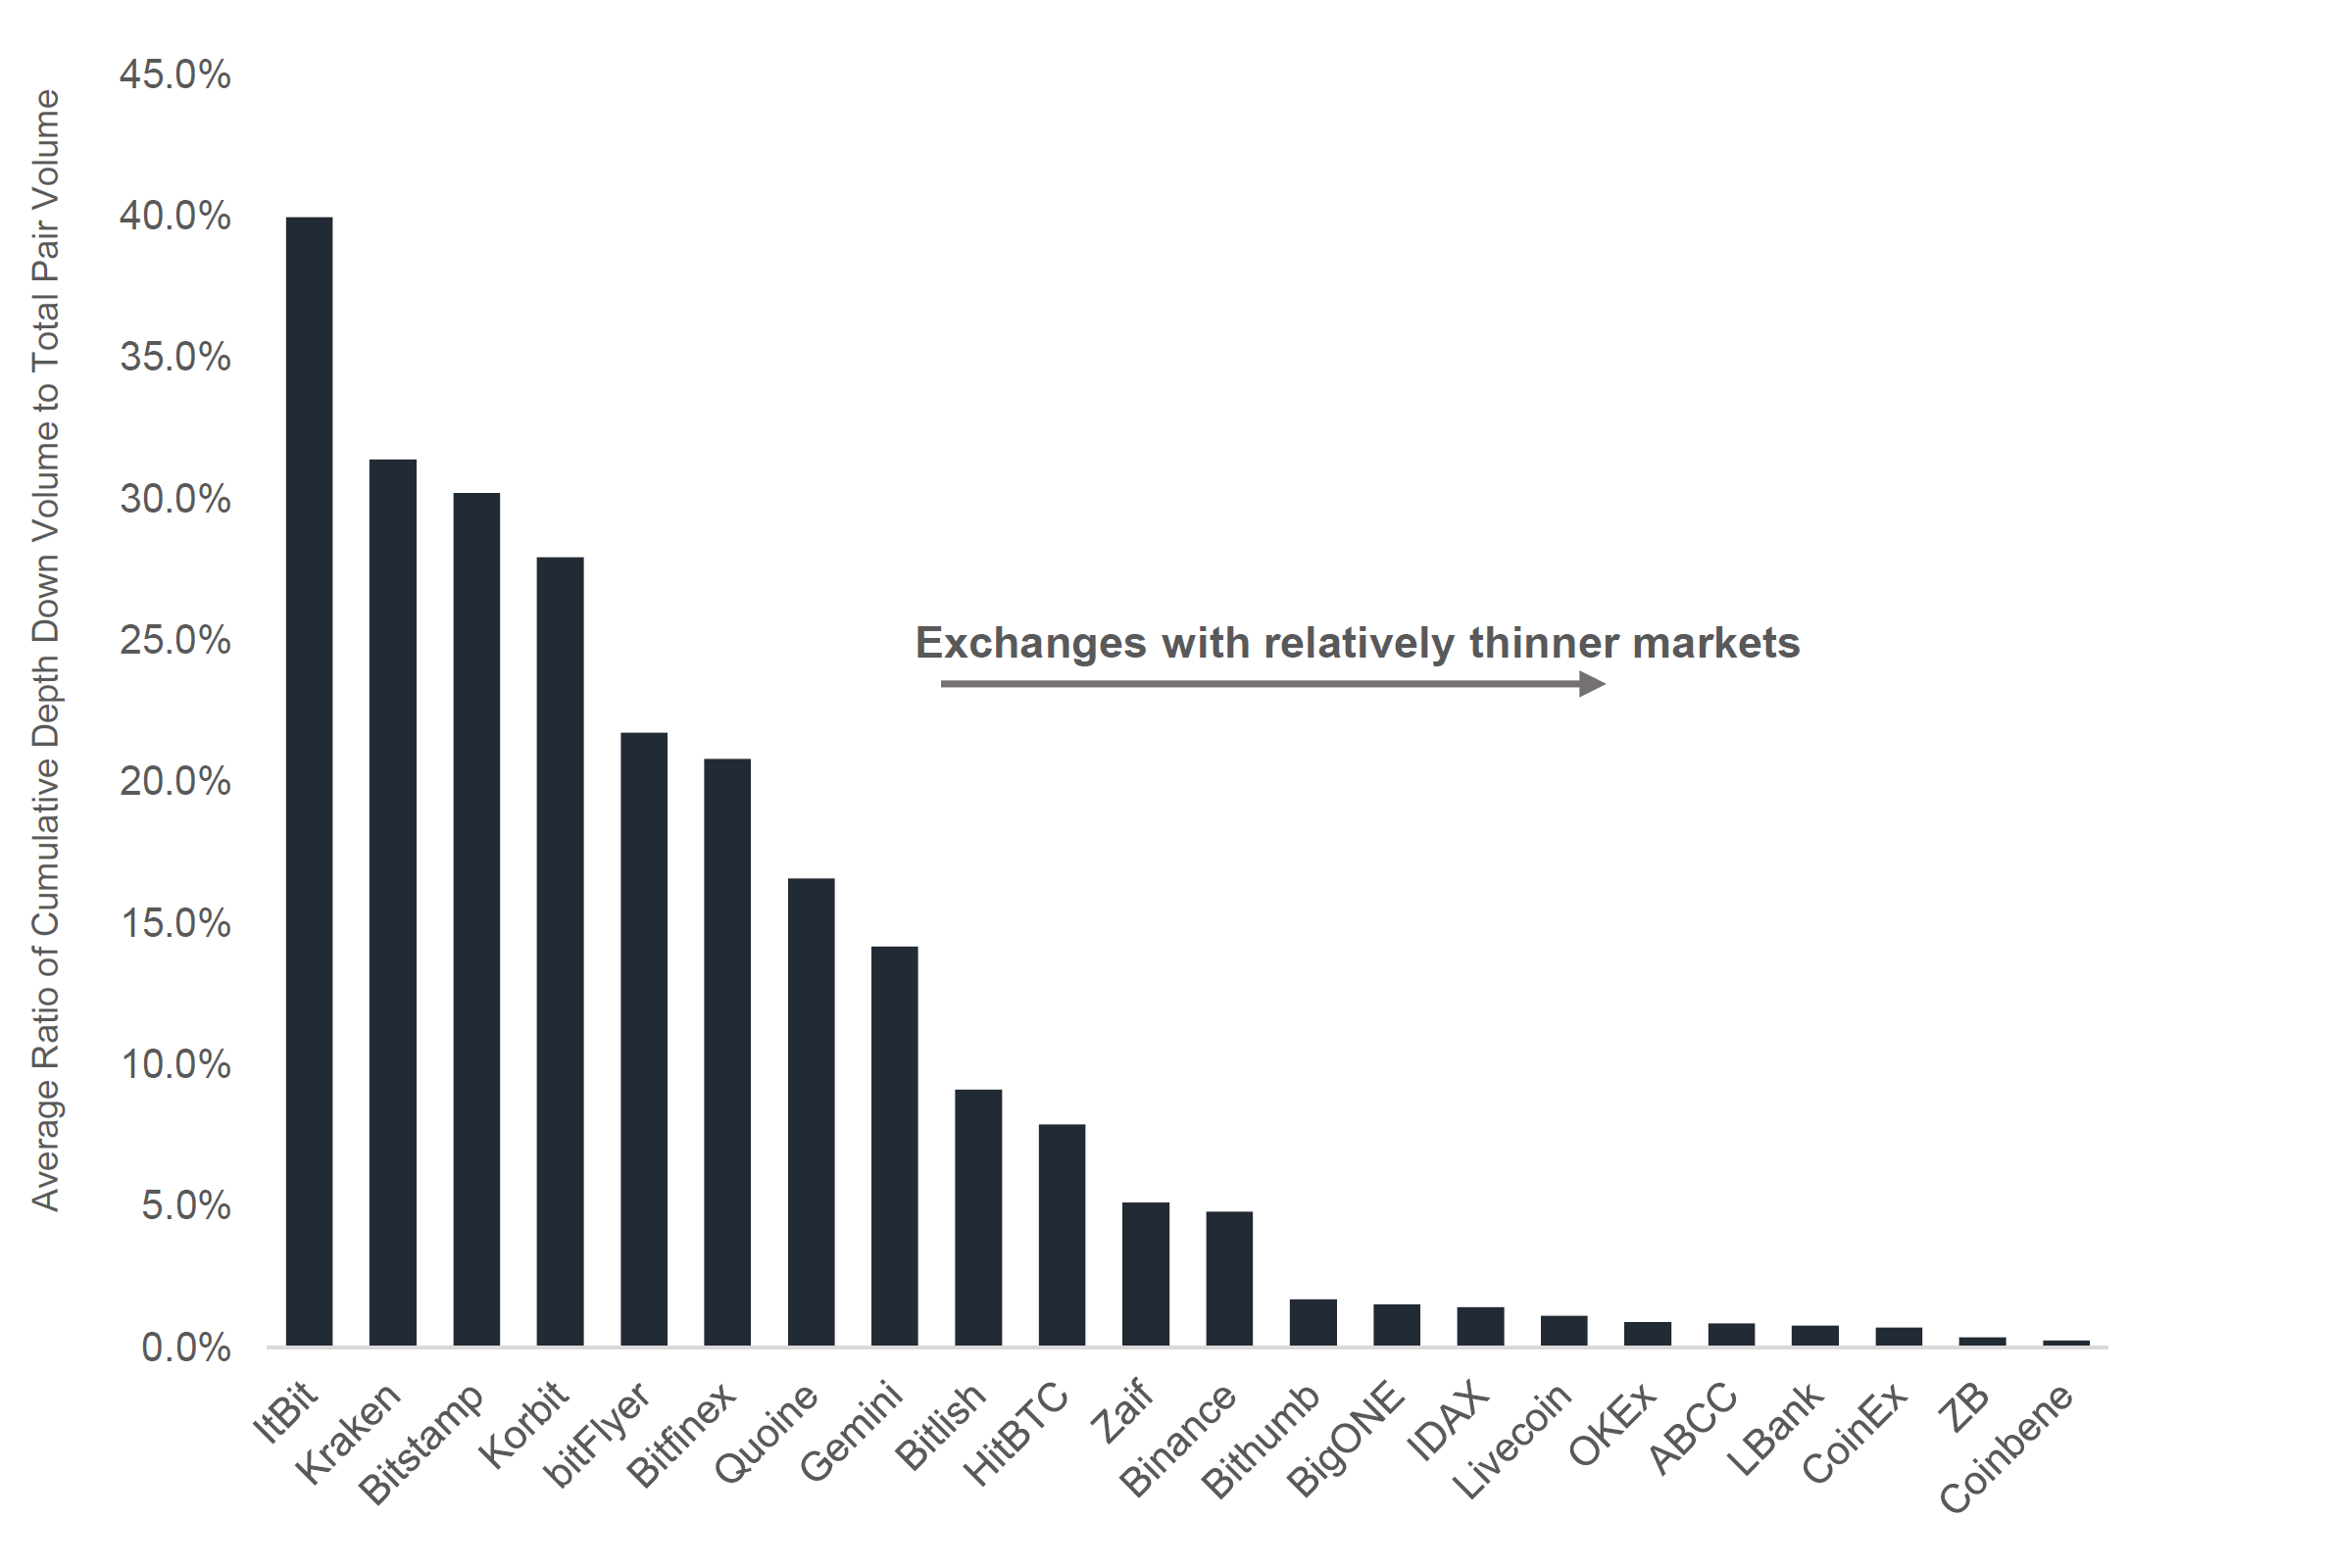
ItBit, Kraken and Bitstamp have relatively more stable markets compared to exchanges such as CoinEx, ZB and Coinbene.
In the case of ZB for instance, its depth to volume ratio was just 0.4%. I.e. in order to move the price down 10%, a trader would only need to sell 0.4% of average daily pair volume. These ratios are similarly low in the case of CoinEx (0.7%) and CoinBene (0.3%).
Meanwhile other exchanges such as Bitstamp and ItBit, had ratios of 30% and 40% respectively. This is a factor of 100 times greater than those of CoinBene’s for instance.
Transaction-Fee Mining Exchanges
Average 24H Trans-Fee Mining Volumes
The total average 24h-volume produced by trans-fee mining associated exchanges on CryptoCompare totals more than 550 million USD. This constitutes approximately 10% of total exchange volume over the last 30 days.
Decentralized Exchanges
Average 24H DEX Volumes
The total average 24h-volume produced by the top 5 decentralized exchanges on CryptoCompare totals just less than 2.4 million USD. This constitutes just 0.4% of total exchange volume.
Security Analysis – Top 100 Exchanges by 24H Volume
This security analysis aims to evaluate a pool of the top 100 exchanges by 24h volume considering the proportion of exchanges with both a public privacy and a terms & conditions page. In addition, we analyse the proportion of exchanges that have been hacked in the past as well as the publicly stated proportion of cold wallet vs hot wallet storage for users’ funds. In theory, the higher the amount of funds stored in “cold storage” (i.e. offline), the less exposed the funds held by a centralized exchange will be to hackers.
Proportion of Exchanges with both a Public T&C and Privacy Policy Page
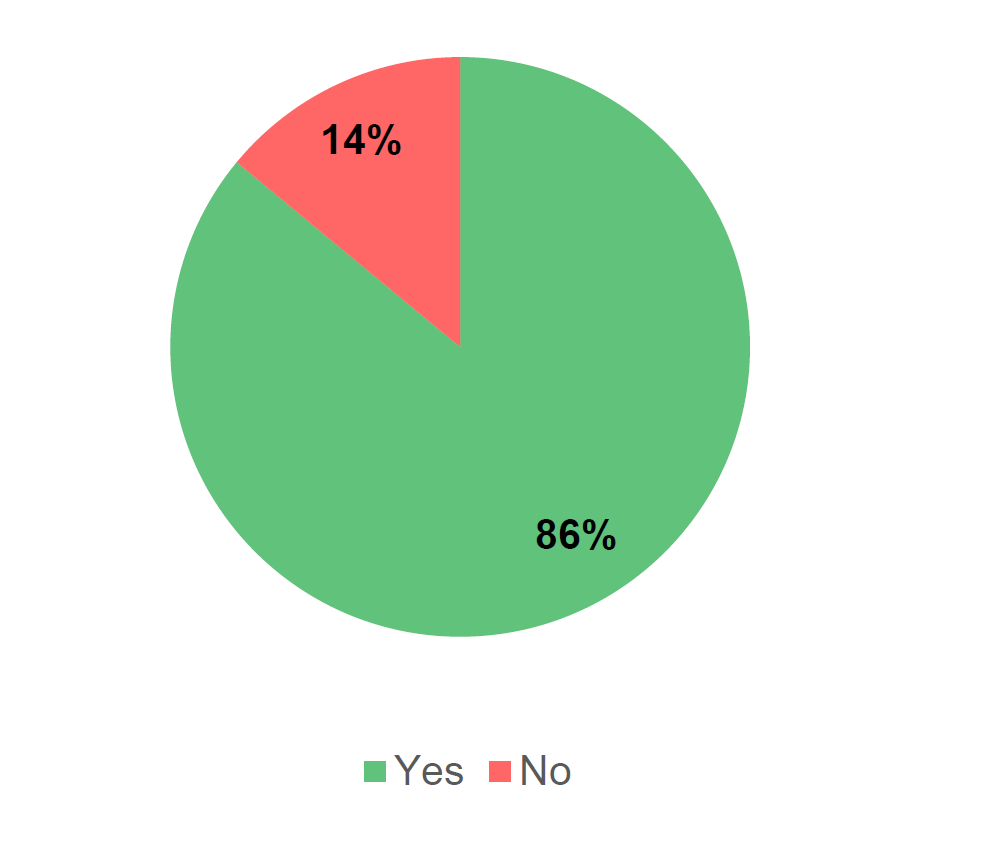
Out of the top 100 exchanges by 24h volume, only 86% have both a public privacy policy and terms & conditions page.
Proportion of Users’ Funds Held by Exchanges in Cold Storage
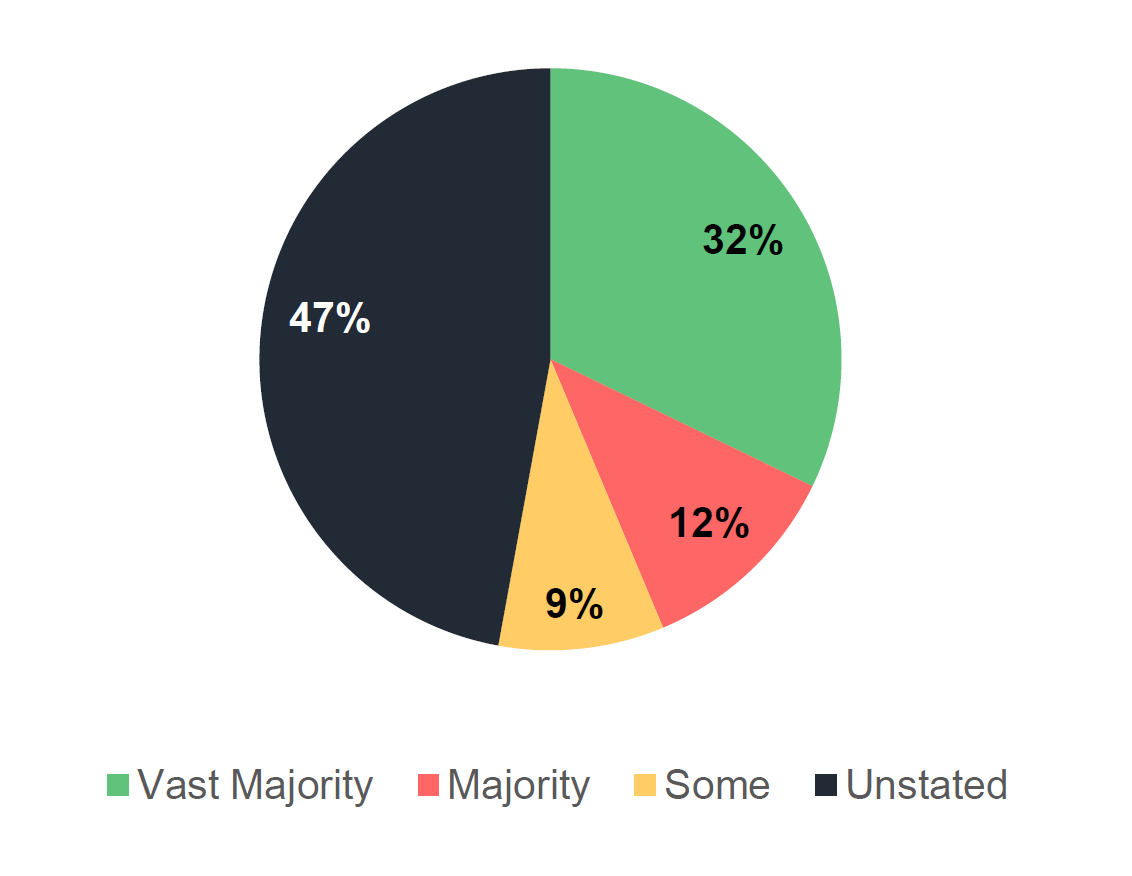
A third of top exchanges store the vast majority of users’ funds in cold wallets.
Proportion of Users’ Funds in Cold Storage by Exchange
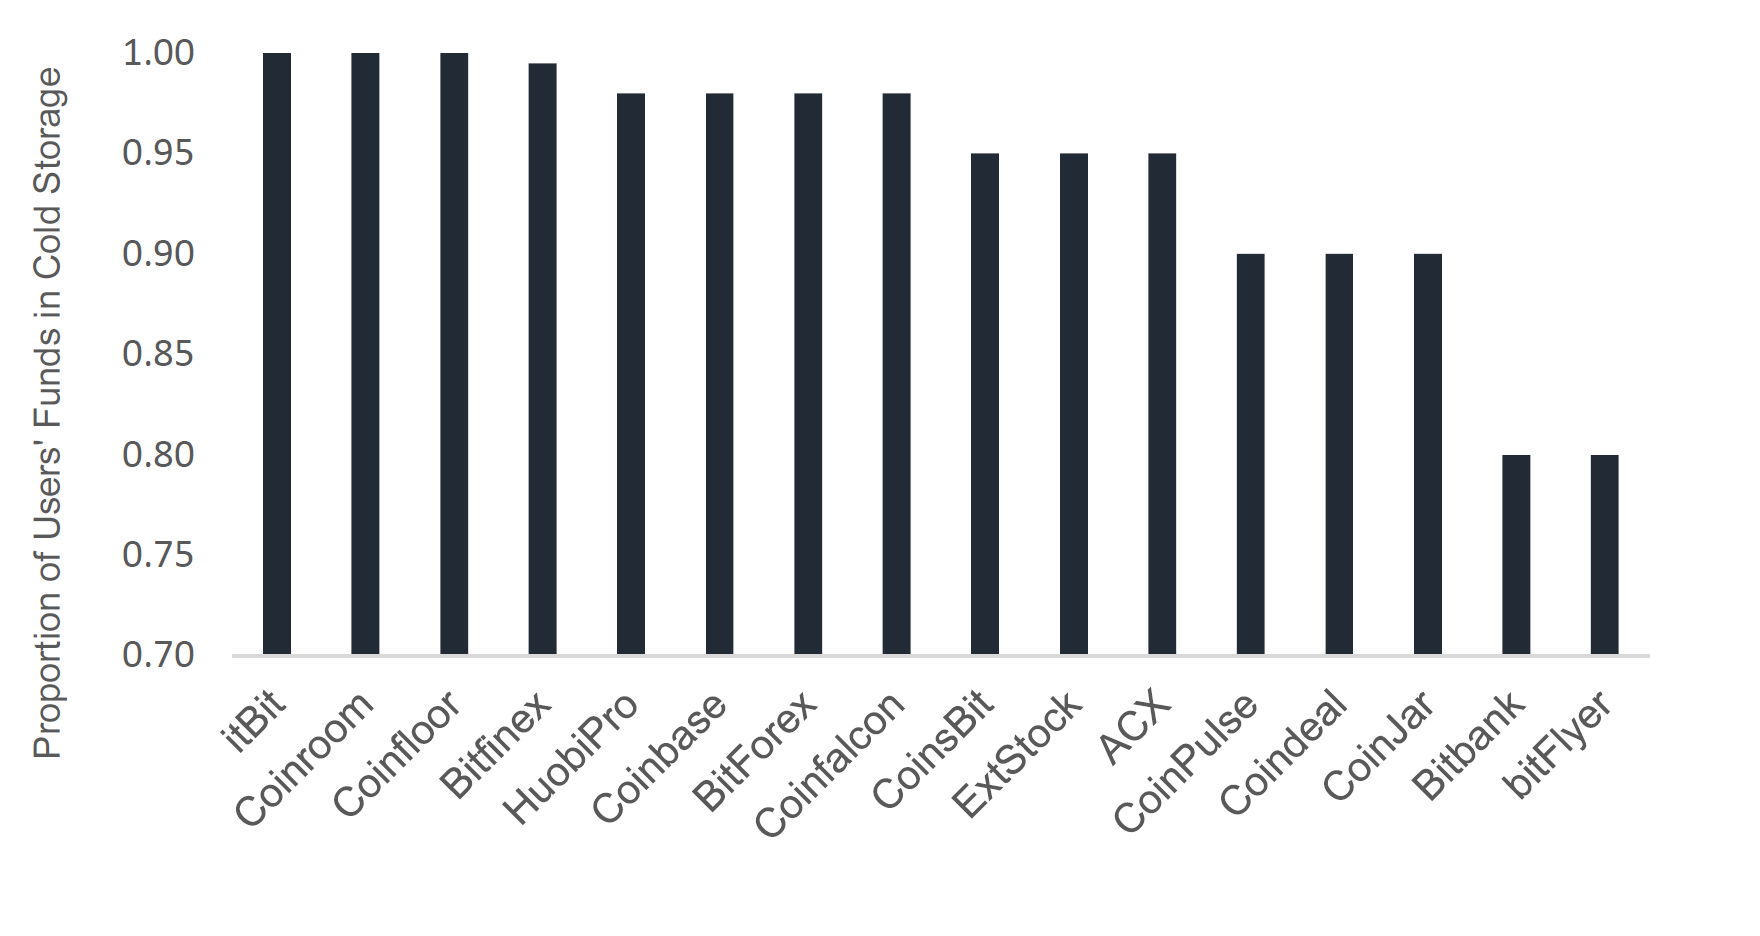
Exchanges itBit, Coinfloor, Bitfinex and Coinbase are among those that store the highest proportion of users’ funds offline.
Proportion of Exchanges Hacked in the Past
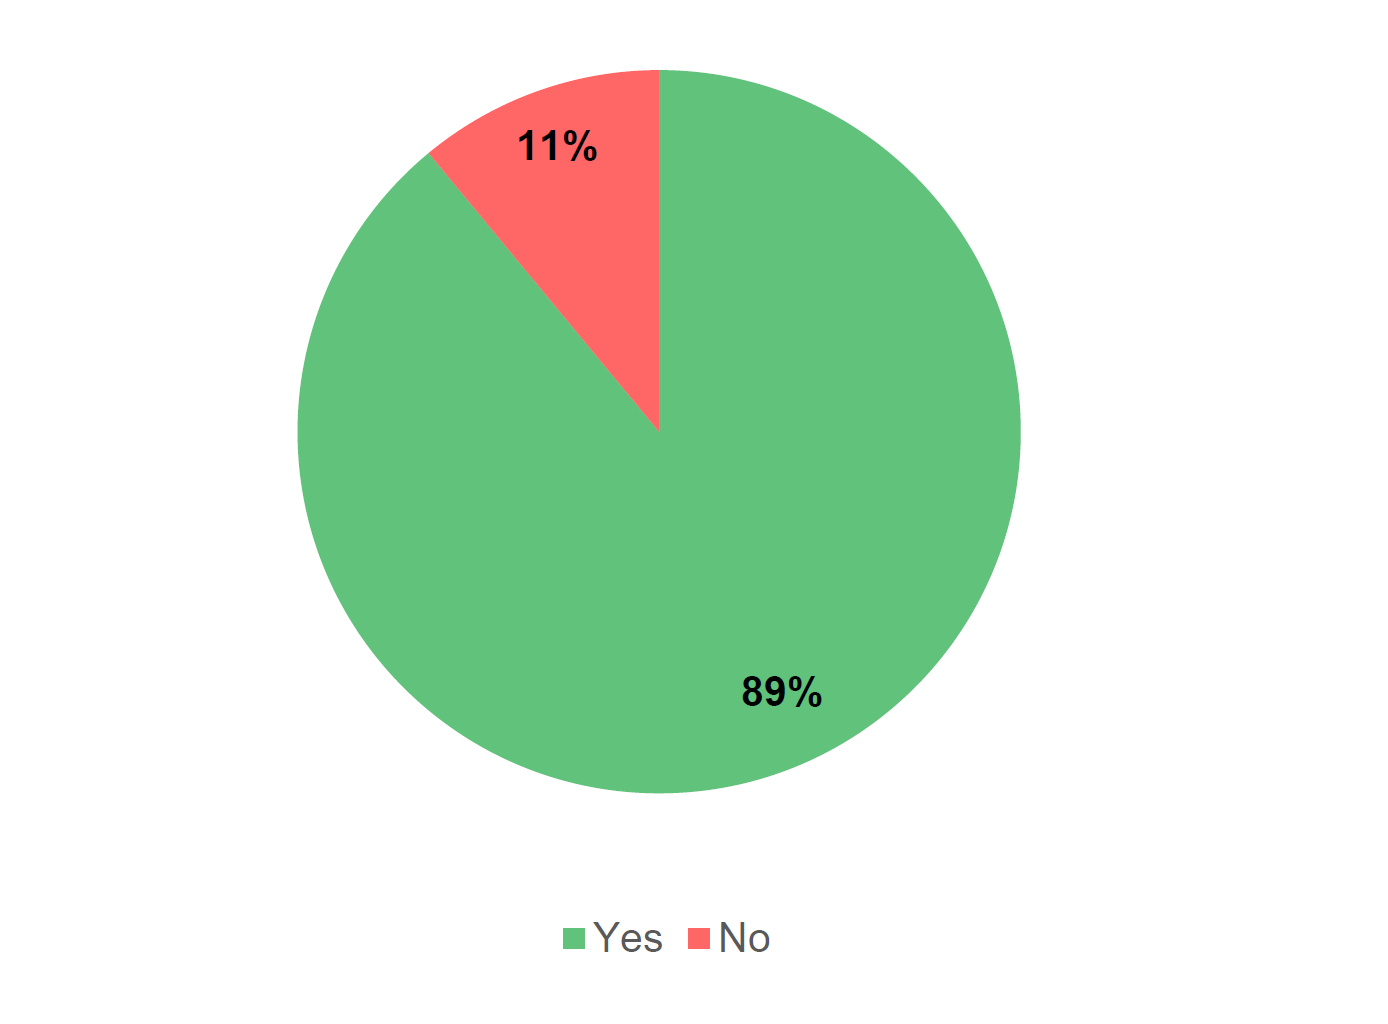
11% of top exchanges have been hacked in the past.
KYC Requirements Among the Top 100 Exchanges
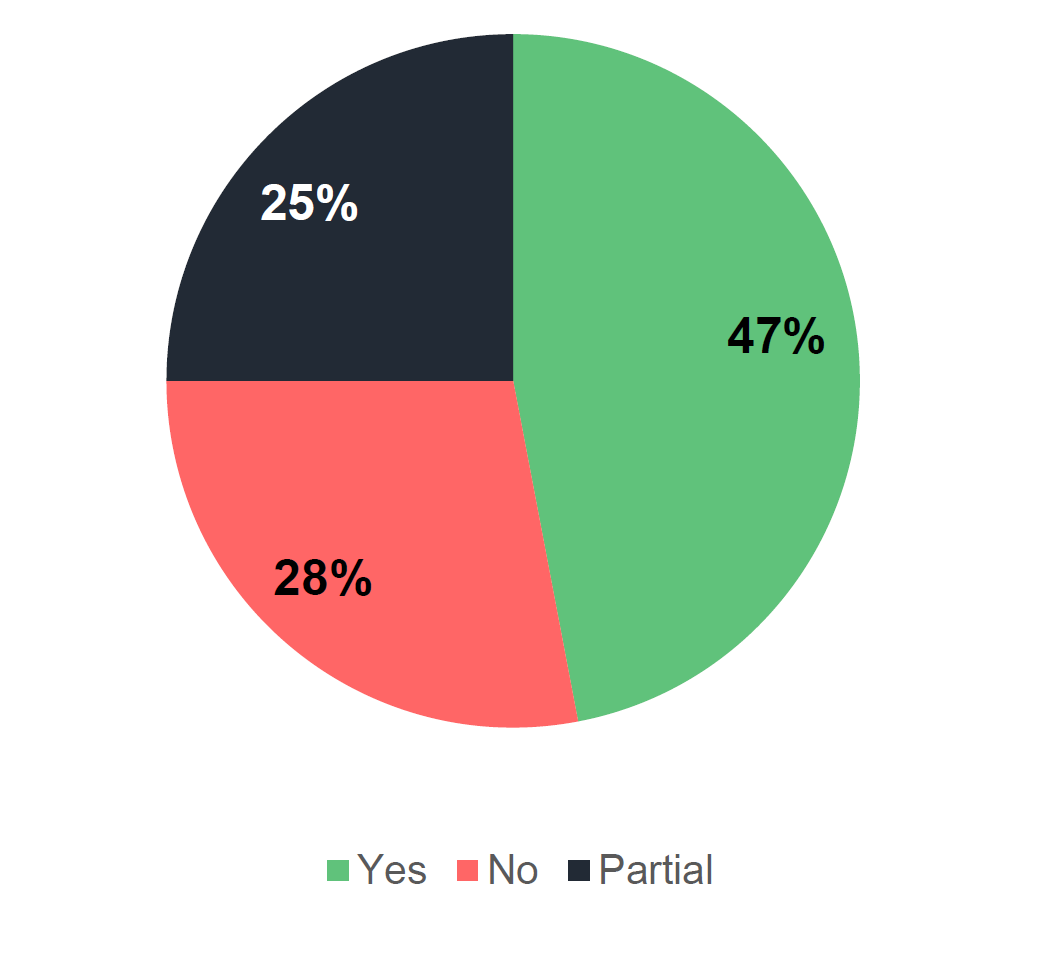
Just under half of top exchanges impose strict KYC requirements, while more than a quarter do not require KYC.
Those that impose partial requirements (25%) require KYC verification in order to conduct certain activities such as to withdraw fiat, to trade fiat pairs, or to increase maximum trading amounts.
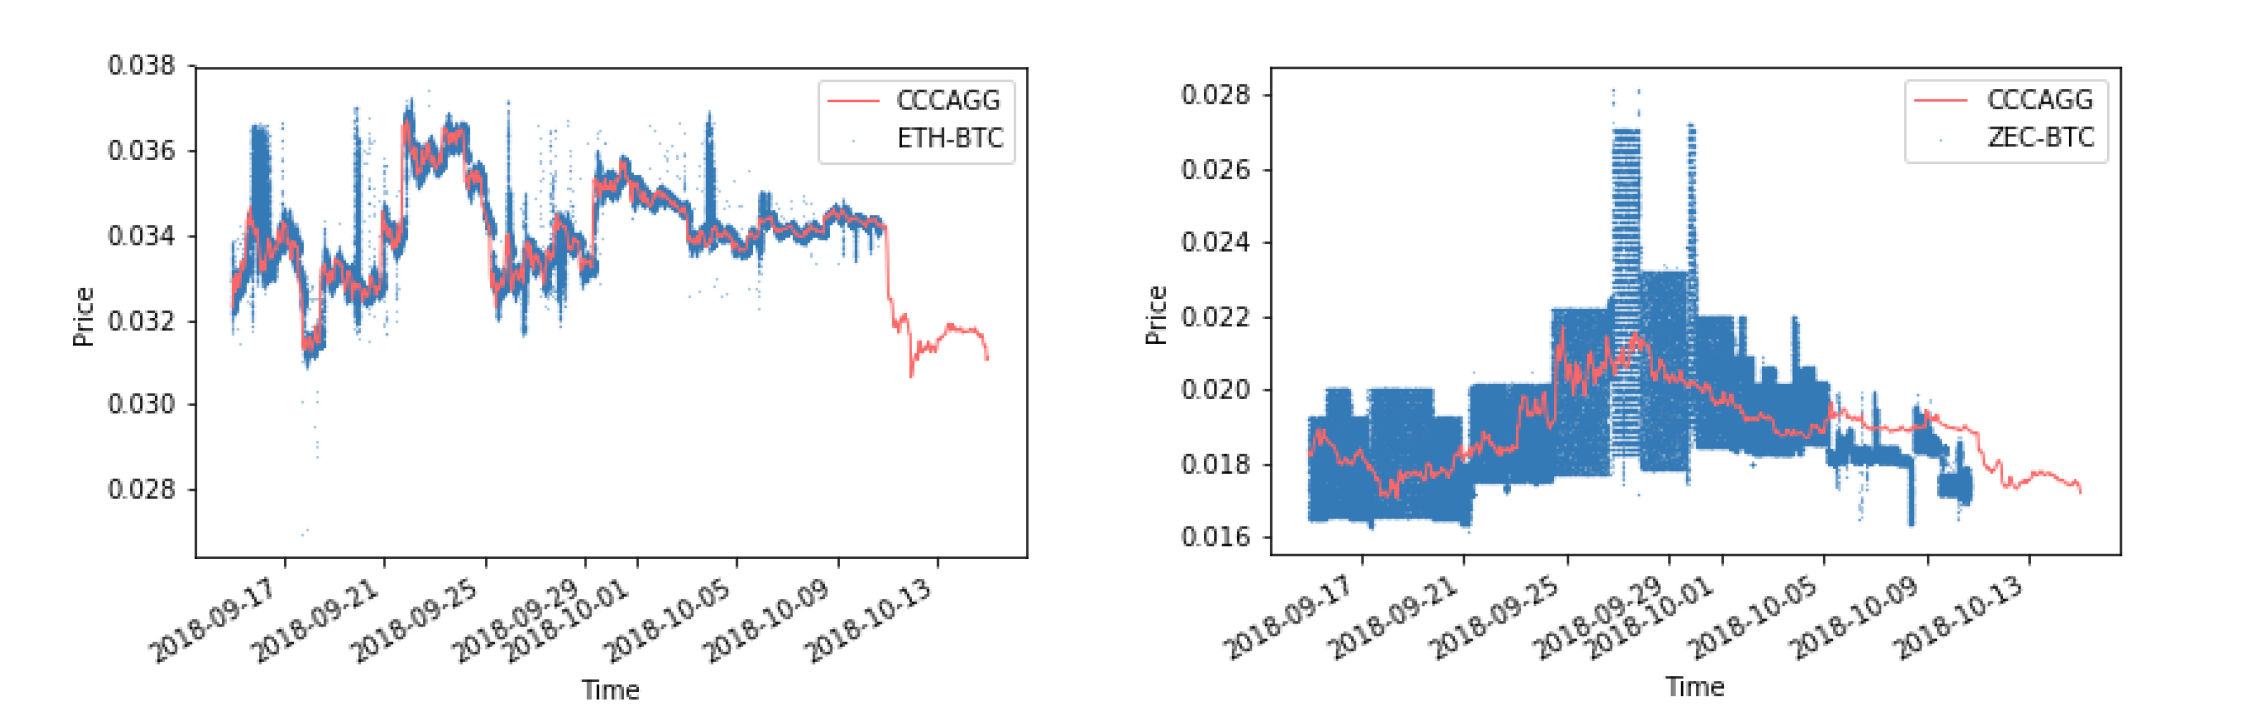
Trade Data Assessment of New Exchanges
A visual inspection of the trades on the new exchanges is now carried out. Snapshot data cannot capture volatility, so these trade graphs allow the characteristic trading to be assessed in light of its effect on the CCCAGG. Graphs were produced of all trades vs the CCCAGG for the top 5 trading pairs for each new exchange over the last month.
BCEX
BCEX displays high volatility on both of the pairs that it trades. Buying of large amounts of the order book is visible, suggesting a very thin market. The price on this exchange will accordingly not reflect the price of the cryptocurrency well, so it will not be included.
CoinTiger
Top trading pairs on CoinTiger display agreement with the CCCAGG, but due to anomalous volumes further monitoring will be carried out before considering inclusion into the CCCAGG.
iCoinBay
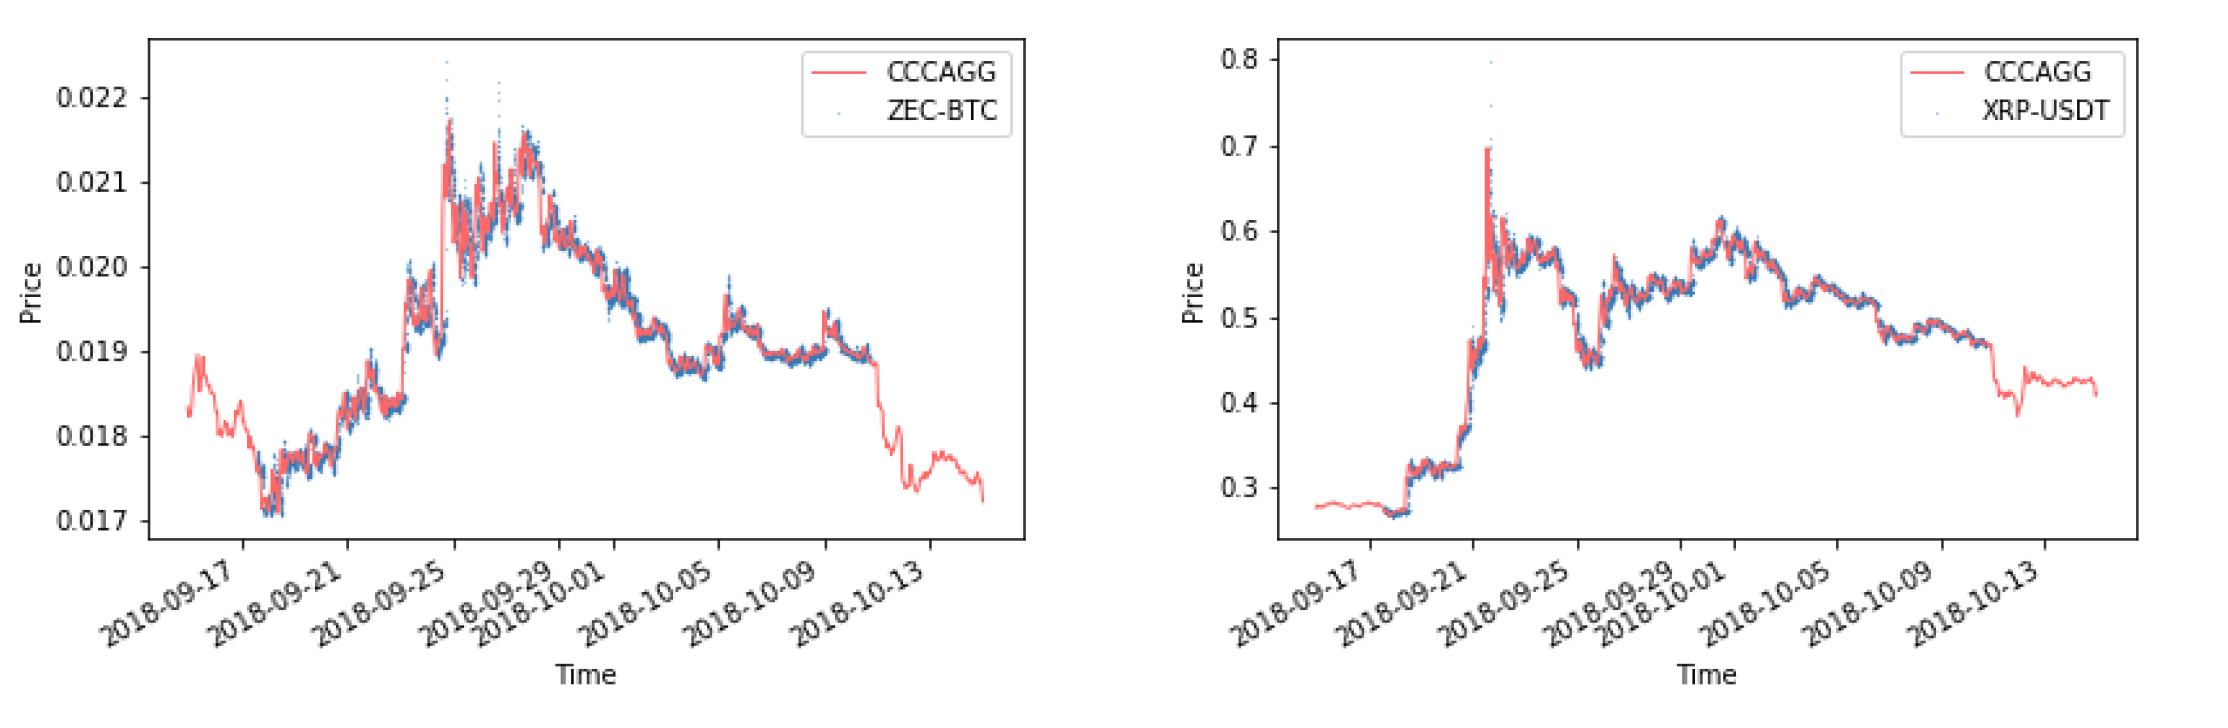
Pairs on ICoinBay show agreement with the CCCAGG. This exchange is a possible inclusion to the CCCAGG.
Iqfinex
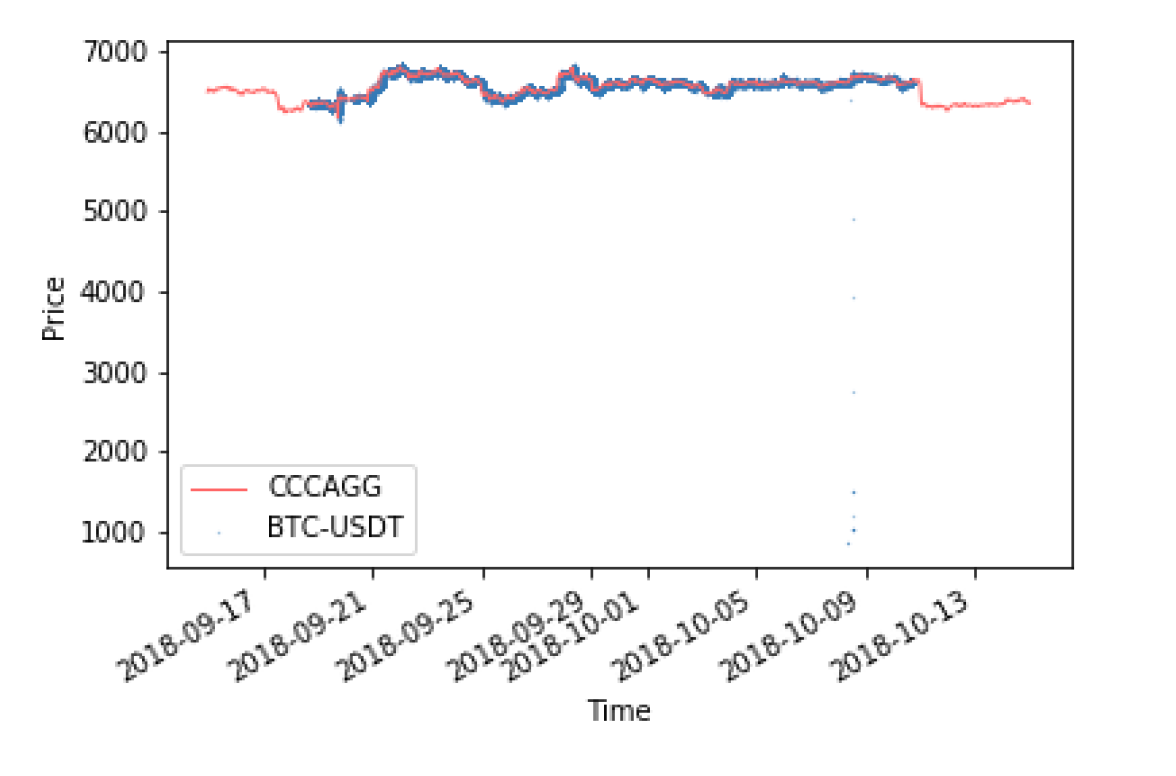
A flash crash on the largest trading pair elicits a longer period of assessment before consideration for inclusion into the CCCAGG.
Liqnet
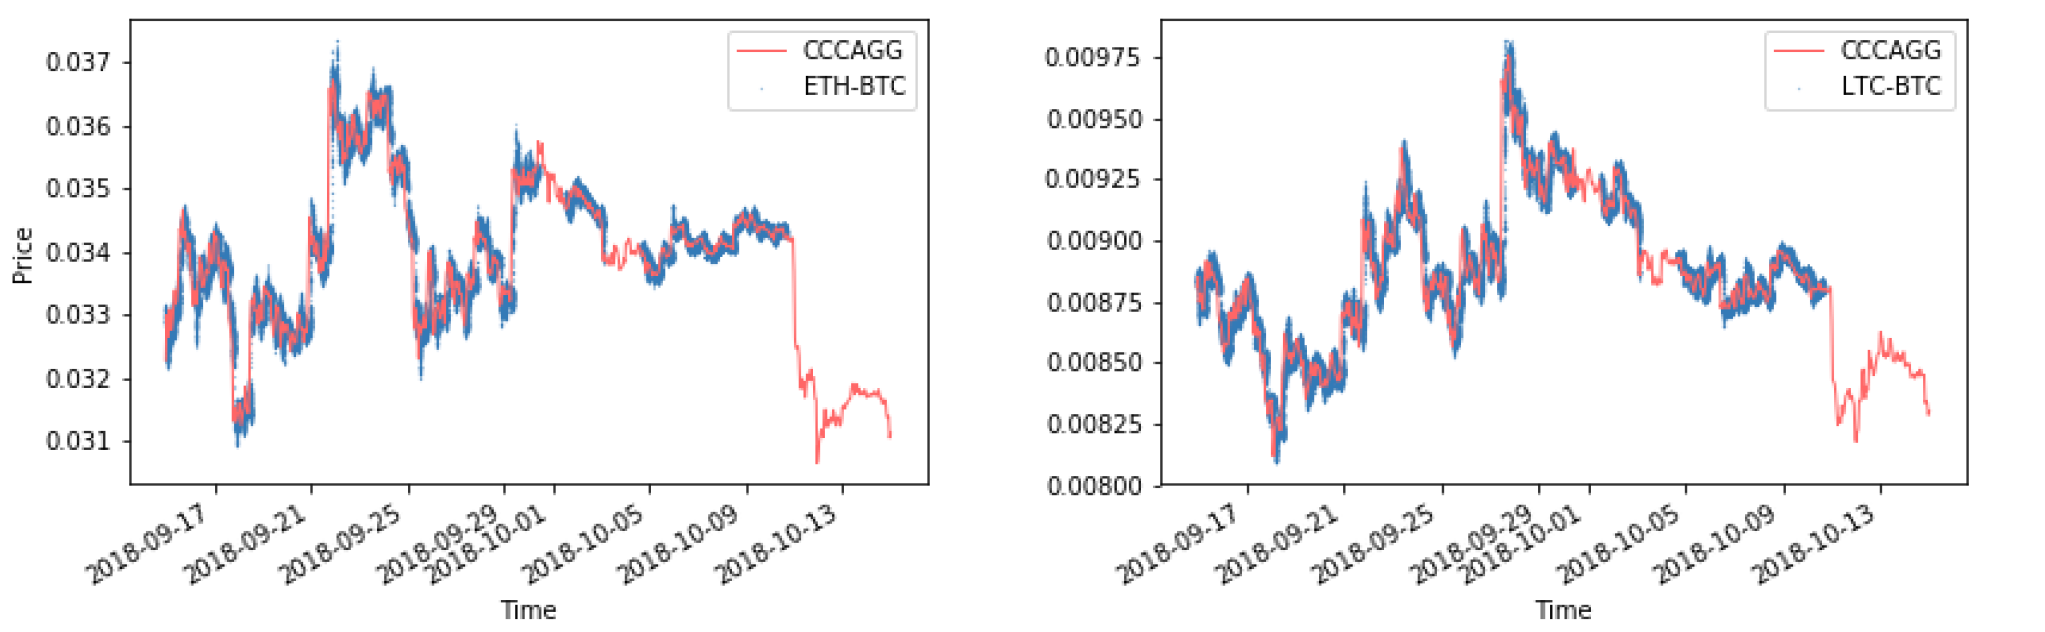
Pairs on Liqnet show agreement with the CCCAGG. However, large amounts of API downtime can be observed. The quality of the exchange API will be monitored and the exchange will be considered for inclusion in the event of an improvement in API provision.
P2PB2B
Poor agreement with the CCCAGG gives grounds to exclude P2PB2B.
StocksExchange
StocksExchange displays some unusual trading activity and a flash crash. The exchange will not be included due to trading behaviour.
Example Assessment of BTC to USD and Future Exchange Methodology Additions
This section provides a quantitative analysis of trade data received from exchanges. The purpose is to provide an understanding of what the exchange trading ecosystem looks like, and to allow for selection of exchanges that best represent the price of a cryptocurrency.
In order to make comparisons across exchanges, an estimate of the trading price of the cryptocurrency needs to be ascertained. For the BTC-USD pair, all trades over a 30-day period were collated and plotted. In this time period, there were around 6.5 million unique trades. The trades are plotted such that colour indicates the density of points in the area.
All BTC to USD trades over 30 days
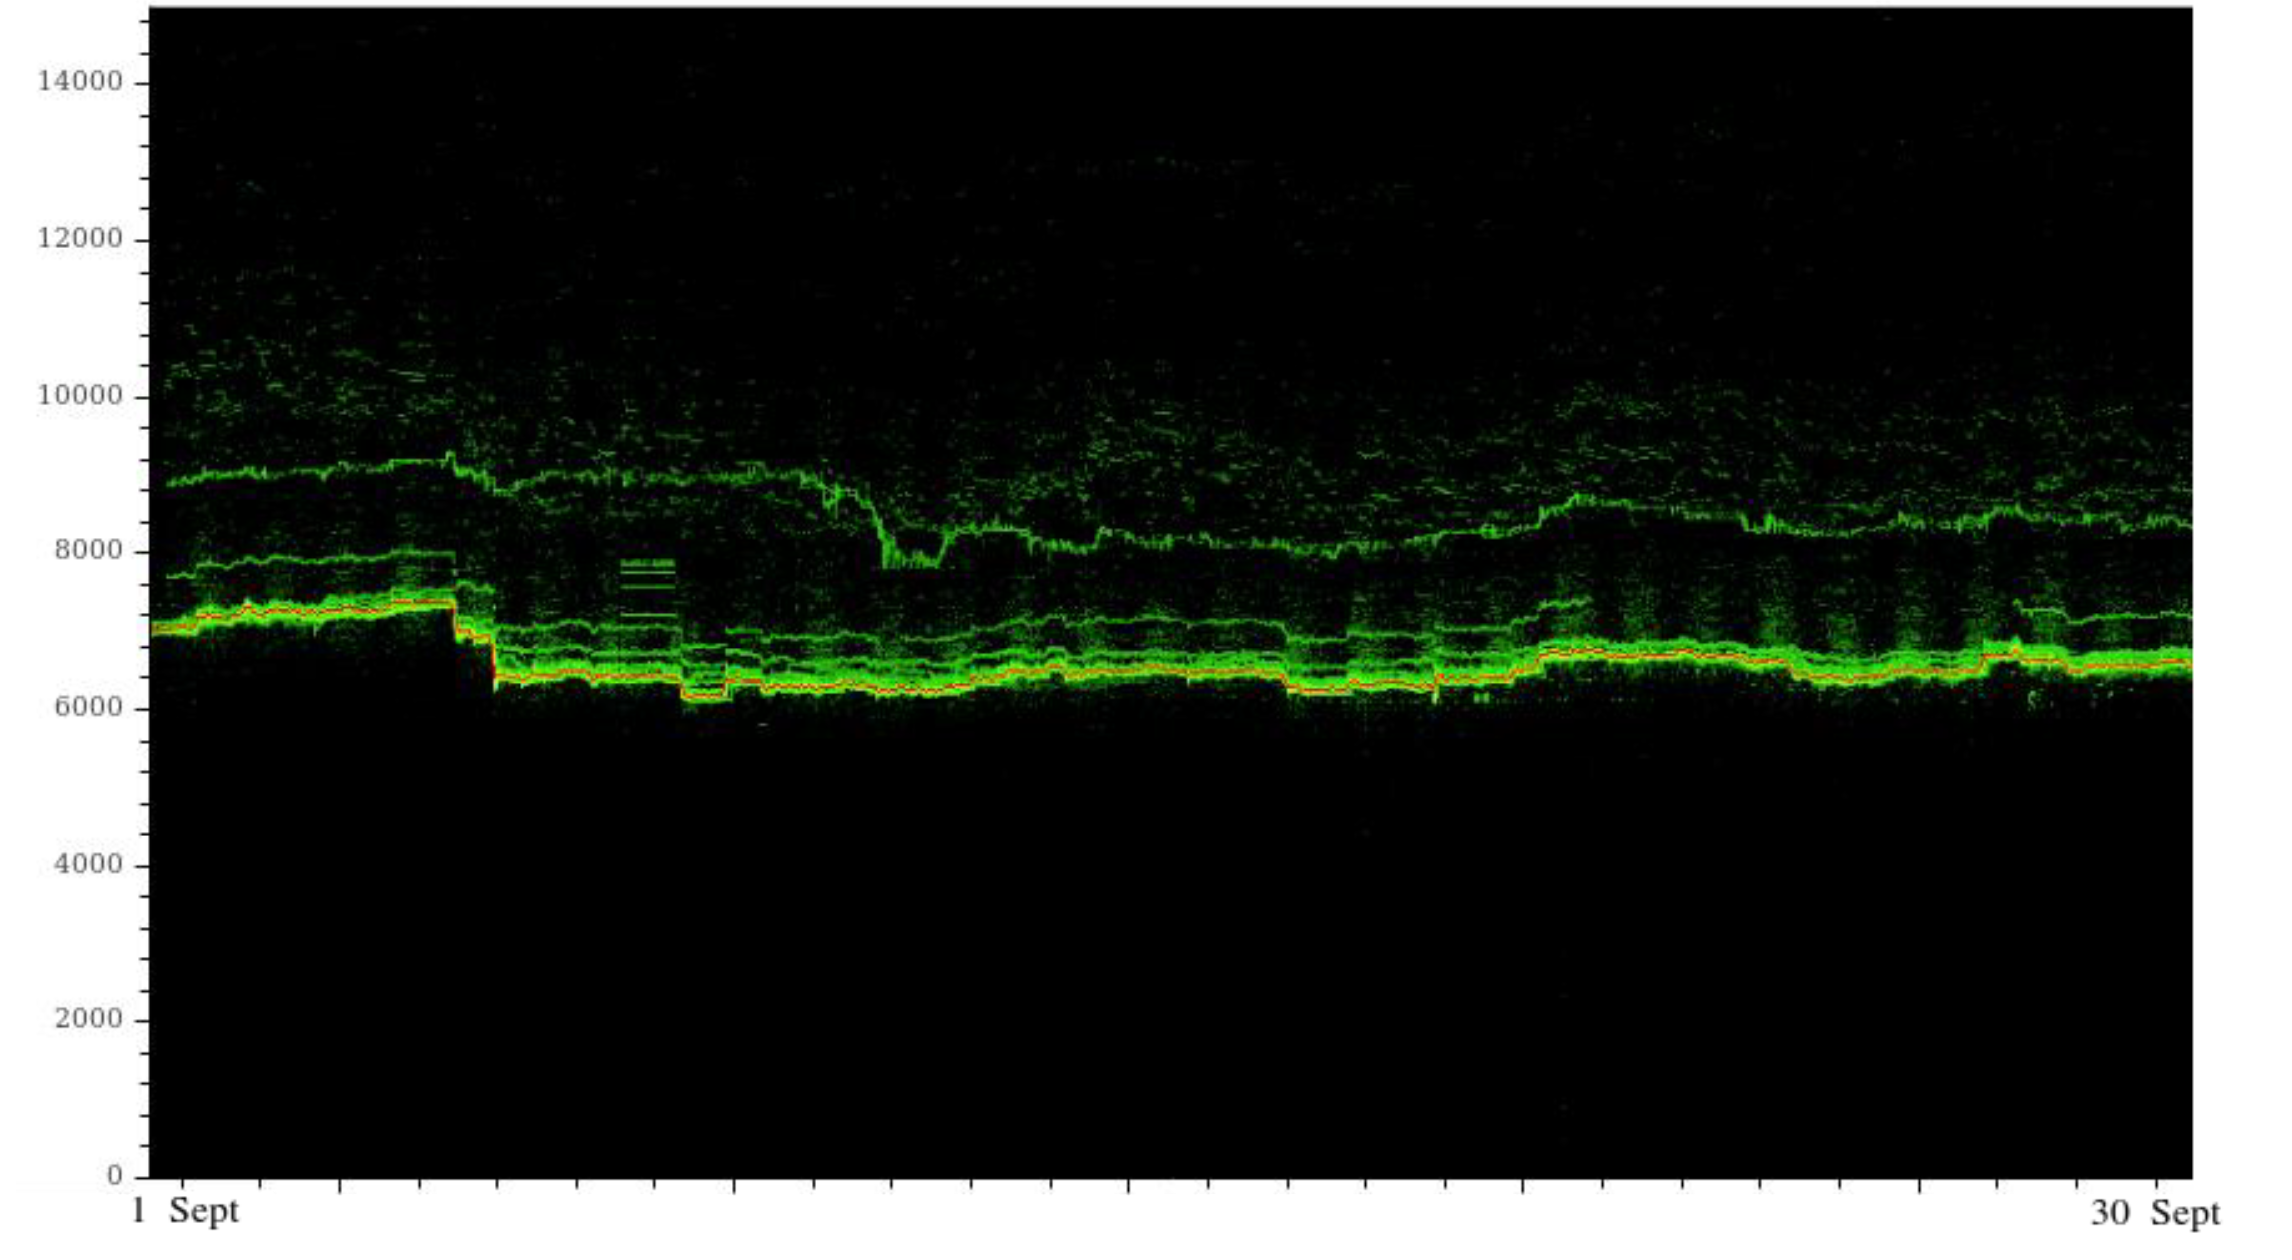
This graph represents the entire ecosystem of the price of BTC-USD trading over a 30-day period. This is now used to generate a representative price for BTC. The median was selected to calculate a trading price for the cryptocurrency. The motivating factor behind this measure being used was the large number of outliers in the trade data set. To keep the computation tractable, trades were grouped into 1-hour long time bins, and the median for each of these bins was computed.
For the purposes of this investigation, volume weighting was not used. This was due to high volume buying up of order books being observed when looking at individual exchange trade data. It was hypothesised that the arithmetic median would better reflect the mid-price of the order books of the exchanges, as the majority of trades take place at the mid-price. The median should therefore reflect the price that the average trade was carried out at.
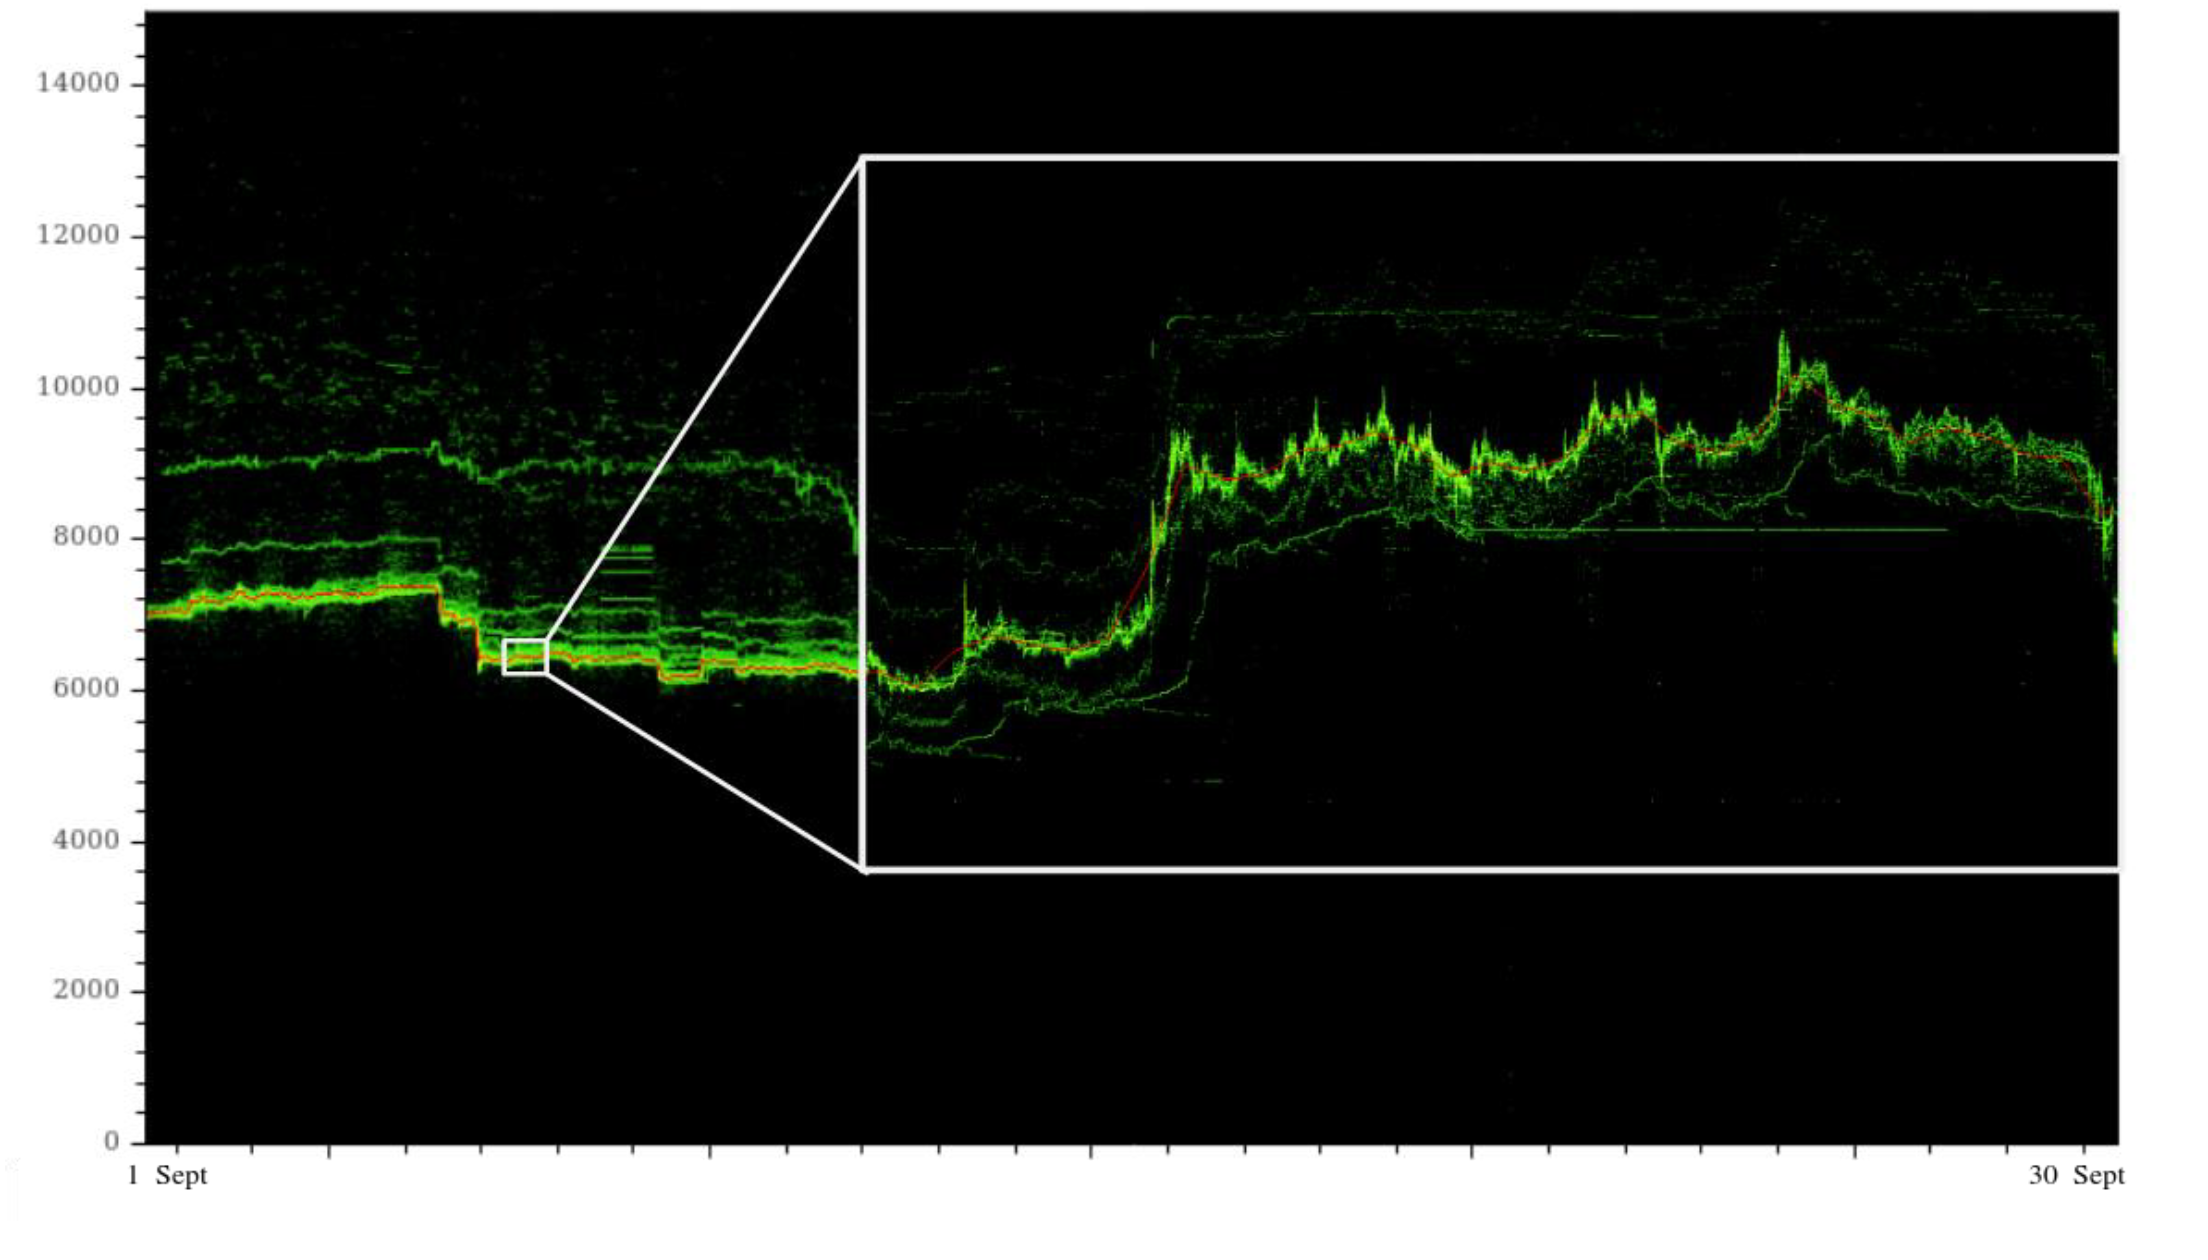
The 1-hour median line was then plotted on the trade data, and a visual inspection of a section of the above graph shows that the line follows the highest trade density, which is indicative that it is a good estimate of the trading price of the cryptocurrency.
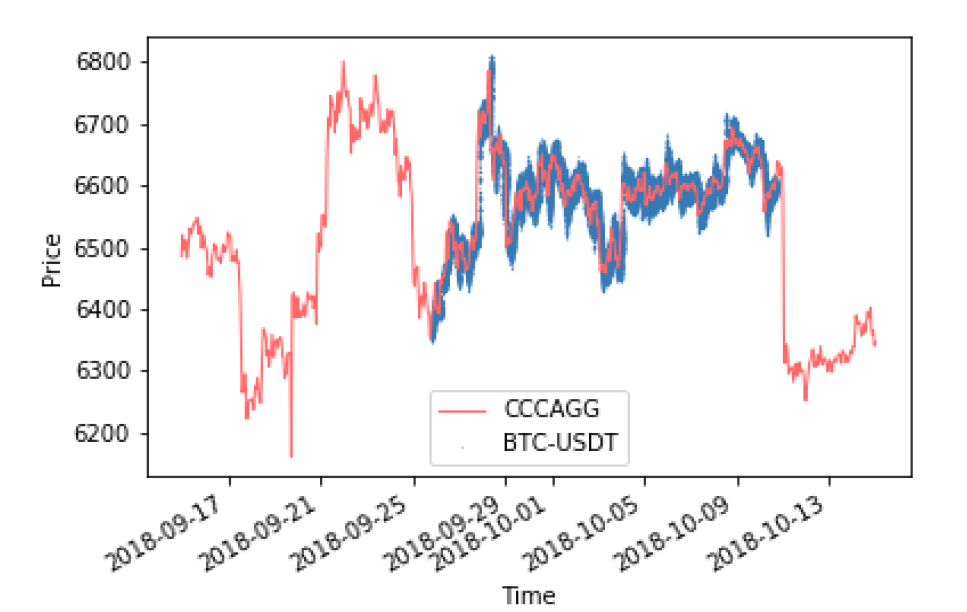
BTC to USD trades over 30 days with hourly median price line
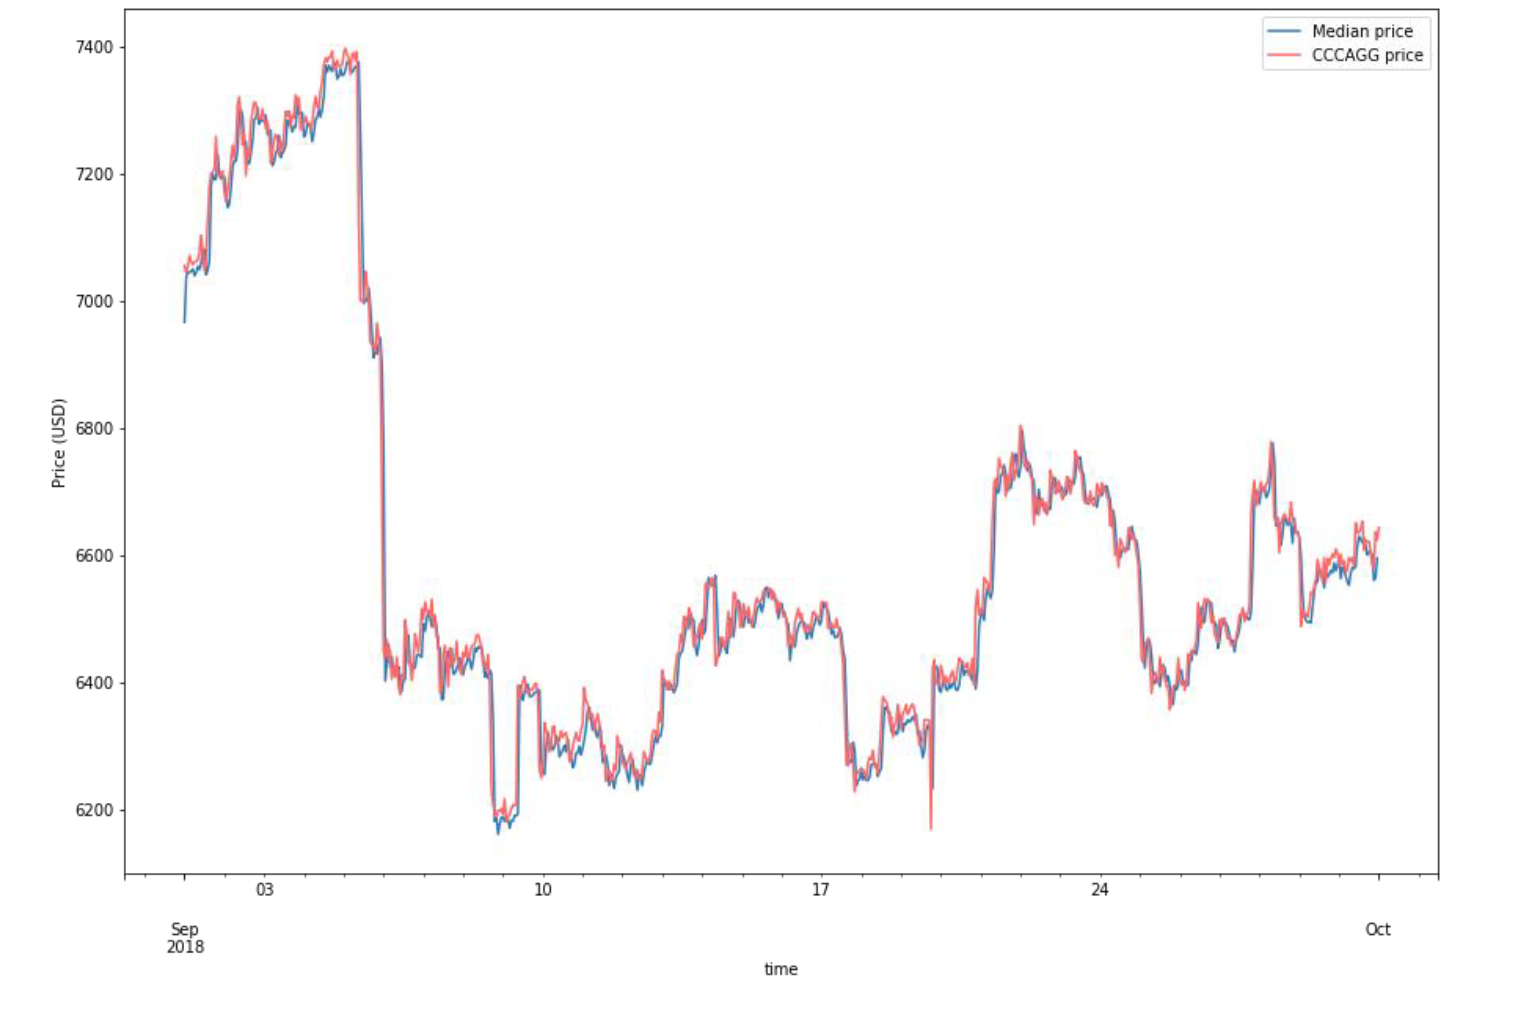
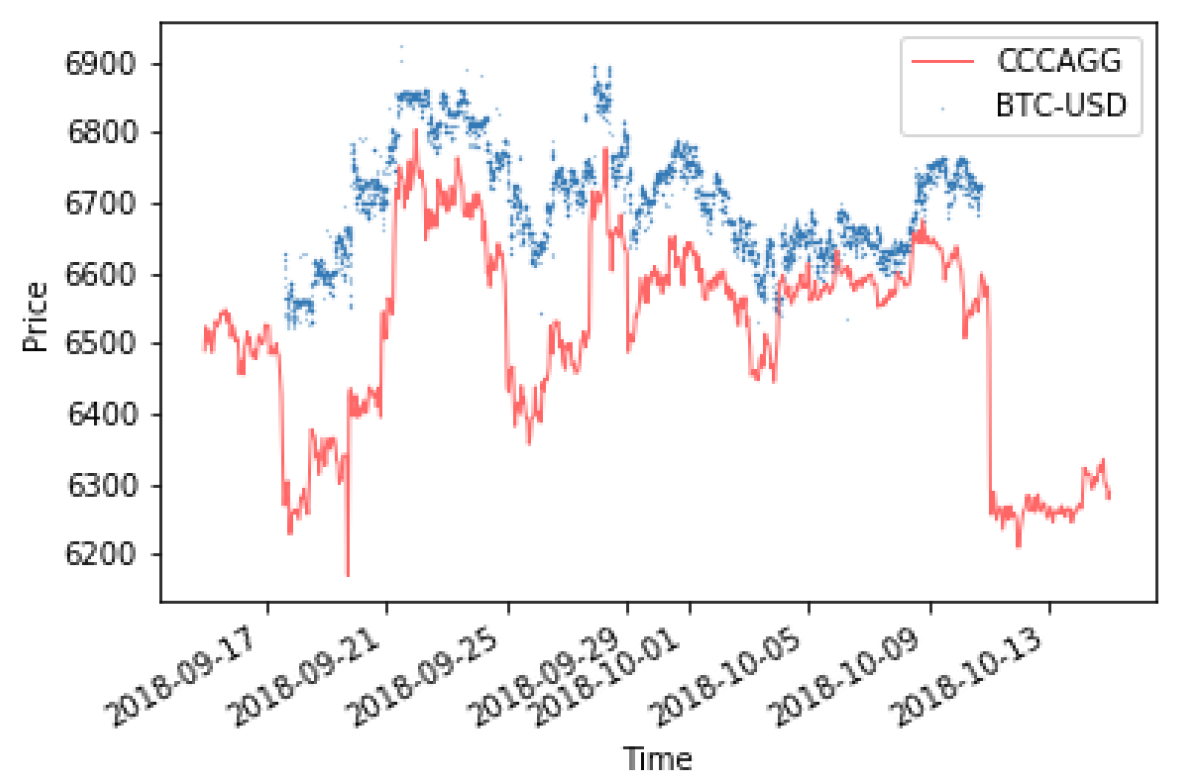
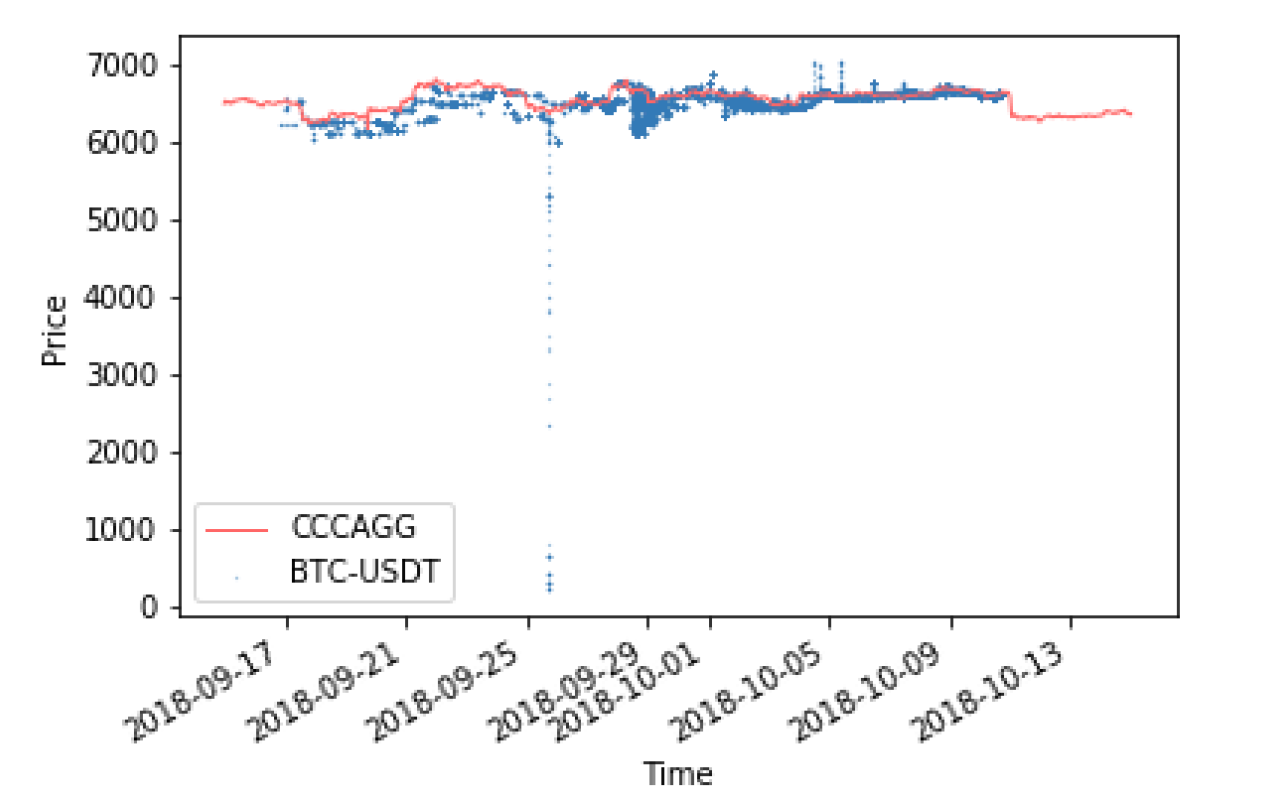
CryptoCompare’s CCCAGG is an aggregation of trade prices, and aims to reflect the current trading price of an asset. It is possible to validate the CCCAGG price by comparing it to the median trade price. It can be seen that there is agreement between the two measures, suggesting that the CCCAGG is accurately capturing the trading price.
CCCAGG Price vs Median Trade Price for BTC to USD