Abstract: In this report we examine Benford’s law, a mathematical rule which describes the frequency of the leading digit in various real world sequences of numbers. We look at various datasets from the cryptocurrency ecosystem, such as coin prices and trading volume data. We explain that this mathematical concept should not be looked at in isolation and that a strong understanding of the underlying economics is necessary to draw strong conclusions. We note that for a minority of trading platforms, notably OKEX and HitBTC, the reported trading volume figures appear to result in a distribution which does not follow Benford’s law. However, this pattern does not imply inappropriate manipulation of the data and there are many potential legitimate explanations for the unexpected distributions.
(Ben Affleck explaining to Anna Kendrick the abnormally high occurrence of the digit 3, potentially indicating financial fraud, in the 2016 Hollywood movie “The Accountant”. Screen captured 41 minutes and 40 seconds into the film)
Overview of Benford’s law
Benford’s law concerns the frequency distribution of the first digit from various real world sequences of numbers. One might think that the frequency distribution of the first digit in most scenarios would be 11.1% (i.e. 11.1% for 1, 11.1% for 2, 11.1% for 3, ect ) and this is indeed the case in many scenarios, for instance a random number generator should result in such a frequency distribution. However, there are some real world scenarios in physics, geology, biology, chemistry, architecture, demographics, finance, business or other fields, where a different frequency distribution is observed, one matching the chart below, where 1 is the most common (occurring 30.1% of the time), followed by 2, etc.
Frequency distribution of the first digit in an exponentially growing geometric series
(Source: BitMEX Research)
(Note: The geometric series starts at the number 1, grows by 2% each interaction and contains 5,000 numbers)
Justifying exactly why the above phenomenon is observed can be challenging and there does not appear to be a concise explanation applicable in all scenarios. The major characteristic necessary in order to observe Benford’s law appears to be that the data must span across several orders of magnitude.
In our view, good way of explaining the phenomenon is by considering a basic geometric series. For instance, consider a geometric series of numbers, growing by 10% each iteration. When the series has reached the level of 24 (40% of the way through the twenties), the next number in the series is 26.4, still well within the twenties, with 2 as the leading digit. If the geometric series is at 84 (40% of the way through the eighties), the next number in the sequence is 92.4 and the leading digit has changed from 8 to 9. This shows how some series, which could occur for instance in finance or nature, result in the observation where lower value leading digits are more common than higher value digits.
Applying Benford’s Law to Business and Finance
Before joining BitMEX Research, many of the team used to work as investment analysts or portfolio managers covering equities. Back in 2015, inspired by a paper from the Association of Certified Fraud Examiners, a colleague proposed that we could use Benford’s law as a tool to look for financial fraud in reported financial statements. The theory was that if corporate financials accurately reflected the real world, the numbers should follow Benford’s law, however if they had been nefariously manipulated or generated randomly, the numbers should deviate significantly from Benford’s law, which could be a flag for financial fraud. However, as the below scenarios illustrate, it may not be as simple as that.
Consider the following two somewhat contrived examples:
Example 1 – Analysing the sales of a high-growth American technology company – Google
The Amercian internet conglomerate Google [GOOGL US] generated sales of only around $200,000 in 1999. The company grew significantly over the last 20 years and today has sales of over $100 billion. Google’s sales therefore spanned many orders of magnitude and Benford’s law may be appropriate to analyse the group’s financial metrics.
Example 2 – Analysing the sales of a low-growth Japanese utility company – Hokkaido Electric
The Japanese hydroelectric, thermal and nuclear power generating company Hokkaido Electric Power [9509 JP] had sales Y752 billion in financial year ended March 2019. While 25 years ago, the company had sales of Y544 billion and at no point in the last 25 years did sales leave the Y500 billion to Y800 billion range. The leading digit of the company’s annual revenue figure was either 5, 6 or 7 in each of the last 25 years, certainly not following Benford’s law. This is not necessarily an indication of fraud or other financial impropriety, it may merely indicate the company’s conservative nature, low population growth in Japan, a low-growth economic backdrop and Japan’s relatively low inflation rate.
Frequency distribution of the leading digit
| Leading Digit | Benford Model |
Google Sales (1999 to 2019) |
Hokkaido Electric Sales (1995 to 2019) |
| 1 | 30.1% |
33.3% |
0.0% |
| 2 | 17.6% |
19.0% |
0.0% |
| 3 | 12.5% |
9.5% |
0.0% |
| 4 | 9.7% |
9.5% |
0.0% |
| 5 | 7.9% |
4.8% |
72.0% |
| 6 | 6.7% |
9.5% |
12.0% |
| 7 | 5.8% |
4.8% |
16.0% |
| 8 | 5.1% |
4.8% |
0.0% |
| 9 | 4.5% |
4.8% |
0.0% |
(Source: BitMEX Research)
(Note: Google sales are in US$ while Hokkaido Electric’s sales are in Japanese yen)
The purpose of the above examples is to illustrate that one cannot blindly apply Benford’s Law to financial analysis. In order to conduct this analysis effectively, one may need both a strong understanding of mathematics and the underlying economics of the businesses in question. In our view, infering stong conclusions about the operations of financial markets based on statistical or mathematical analysis, without a strong enough understanding of the assumptions and principles behind the mathematics and how they apply to finance, is a mistake made too often, particularly by macro economists and econometricians. We are keen not to repeat this error in this report.
When we analysed our equity portfolios using Benford’s law, we were able to detect that stocks in certain sectors, such as technology, biotech or commodities often followed Benford’s law, while the picture was more mixed when looking at more stable sectors like food, utilities, retail or construction. When conducting a basic analysis of stocks, its possible Benford’s law is more a measure of volatility or growth than of any nefarious manipulation of the figures.
While Benford’s law may be considered a tool to flag potential fraud, it certainly does not provide proof of it. In this report, we will not to fall into the trap of overestimating the power of Benford’s law as a method of detecting fraud when evaluating the cryptocurrency space.
Cryptocurrency Prices
Below we have applied the Benford analysis to cryptocurrency prices. In general the results show that cryptocurrency price movements do follow Benford’s law.
Frequency Distribution of the Leading Digit of Coin Daily Percentage Price Changes – 12 Months ended November 2019
(Source: BitMEX Research, Coinmarketcap)
When looking at the square root at the sum of the squared differences from the Benford model, Stellar, Bitcoin Cash and Litecoin have the highest deviation, while Ethereum and Ripple have the lowest deviation. It should be considered highly unlikely that this is evidence of price manipulation in Stellar, Bitcoin Cash and Litecoin, for several reasons:
- All the coins follow Benford’s model reasonably closely and some deviation is expected given randomness
- A lower deviation may simply indicate the coin price is more volatile, therefore the percentage price changes are more likely to move across orders of magnitude,
- One year’s worth of price data may be too short to draw appropriate conclusions (for example, the longer the time horizon for the Bitcoin price, the more closely the distribution follows Benford’s law)
- Other factors we have not considered could be driving the deviations
Cryptocurrency Trading Platforms
After looking at the coins, we moved our analysis on to cryptocurrency trading platforms, by looking at the daily trading volume of the USD vs BTC trading pair. The results here are more interesting and the deviations are more significant. Most of the platforms in our sample set follow Benford’s distribution reasonably closely, but with a few notable exceptions such as BitForex, HitBTC and OKEX.
Frequency Distribution of the Leading Digit of Cryptocurrency trading platform daily BTC vs USD daily trading volume
(Source: BitMEX Research, Investing.com)
(Notes: Daily trading volume since 12 December 2018.)
Results Table – Frequency Distribution of the Leading Digit of Cryptocurrency trading platform daily BTC vs USD daily trading volume
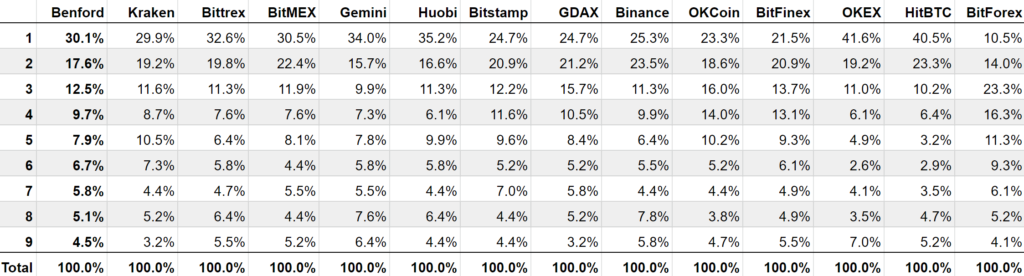
(Source: BitMEX Research, Investing.com)
(Notes: Daily trading volume since 12 December 2018.)
Square root of the sum of the square differences from the Benford distribution
(Source: BitMEX Research, Investing.com)
(Notes: Daily trading volume since 12 December 2018. BTC vs USD)
While the above deviations from Benford’s law do appear significant and potentially interesting, the same caveats apply as in the coin price section of this report. Namely, the distribution could be a measure of growth or volatility, the time periods may be too short or some other factors could be driving the deviations.
Conclusion
The conclusion to this piece is certainly not that Benford’s law proves that OKEX and HitBTC fake their trading volume numbers, or even that the analysis proves that Kraken and Bittrex don’t fake their numbers. As we explained above, there are many factors which could influence how closely the numbers follow the Benford distribution, many of which can be wholly legitimate, such as whether the platform was going through a period of strong growth or was in a more stable period. CryptoCompare’s exchange review takes a more holistic approach to evaluating exchanges, far more robust than merely applying one idiosyncratic mathematical concept. However, if one is already familiar with some of the economics and trends of the cryptocurrency trading platform space, this analysis may provide useful additional information.