Abstract: In this report we analyse and discuss the average level of precision (round numbers) in Bitcoin transaction output values. We evaluated almost 1.3 billion Bitcoin outputs with non-zero values since the network was launched, representing a total value of over 5.4 billion bitcoin of spend, worth over US$12 trillion. We then placed these transaction outputs into buckets, based on the degree of precision. The level of precision has maintained a strong upward trajectory in the last decade. Currently over 70% of Bitcoin outputs use the highest available degree of precision (one satoshi), while the equivalent figure in 2012 was around 40%. Since 2019 only 0.6% of outputs spend an integer number of Bitcoin, compared to around 10% in 2012. We conclude that the primary driver for this may be the increased prevalence of fiat denominated payments, compared to the higher level of experimental usage of the network in the past. The data also suggests the Bitcoiner dream of achieving unit of account status is nowhere in sight, at least for now.
Figure 1 – Proportion of Bitcoin outputs by value precision bucket
(Source: BitMEX Research, Bitcoin blockchain)
(Notes: Up to block height 613,999, excludes outputs with a value of zero, outputs are in groups of 1,000 blocks)
Overview
In this report we examine the precision or rounding of all Bitcoin’s transaction outputs. We assessed all 1.3 billion outputs in Bitcoin’s history and placed them into buckets based on the precision of the output value. We used 14 buckets, which are the 14 powers of 10, with 1 satoshi being the highest level of precision and 100,000 bitcoins the lowest. The below table (Figure 2) illustrates all the results, while the above chart (Figure 1), shows the change in the prevalence of each precision bucket over time.
Our data shows a marked increase in precision in the last 10 years, which surprisingly continued even beyond 2018. Currently over 70% of Bitcoin outputs use the highest available degree of precision (one satoshi), considerable growth since the c40% level in 2012. Since 2019 only 0.6% of outputs spend an integer number of bitcoins, compared to over 10% in 2012.
Explanations for apparent data anomalies:
- 10 bitcoin bucket (2009 & 2010) – It should be noted that our data includes coinbase outputs. In 2009 and 2010, the block reward was 50 (a multiple of 10 bitcoins) and there was very low transaction volume and almost no fees, therefore a very high proportion of outputs fell into the multiple of 10 bitcoin category. From 2011 onwards, the data is more indicative of non-coinbase transactions.
- 10 satoshi bucket (2013) – The small pick up in volume in the 10 satoshi bucket towards the start of 2013 is due to the Satoshi Dice gambling game. We base this view on a brief analysis of transaction volumes associated with addresses starting 1dice…, which show the game peaked in around March 2013.
- 1,000 satoshi bucket (2015) – The large increase in the proportion of outputs in the 1,000 satoshi precision bucket in the summer of 2015, is due to the so called “Flood attack“. An example of one of these “attack transactions” can be seen here, the transaction has 35 outputs, 34 of which have a value of 1,000 satoshis. This attack is often believed to be somehow related to the “blocksize war”, which plagued the community from the 2015 to 2017 period. This is also visible in Figure 4 below.
Results & analysis
The main results are summarised in Figure 2 below. The table shows that in general higher precision outputs are the most common, with 60.1% of outputs using the highest available precision and 10.1% using the second highest. At the lower end of the precision range, the lowest used precision is the 100,000 bitcoin bucket, where there are only 15 outputs. There are no outputs on the blockchain with precision lower than 100,000 bitcoin.
Figure 2 – Number of bitcoin outputs by level of precision (All of Bitcoin history)
| Level of precision | Output count | Proportion of outputs |
| 1 satoshi | 767,583,616 | 60.1% |
| 10 satoshis | 127,476,617 | 10.0% |
| 100 satoshis | 74,360,123 | 5.8% |
| 1,000 satoshis | 73,209,931 | 5.7% |
| 10,000 satoshis | 105,094,419 | 8.2% |
| 100,000 satoshis | 53,612,672 | 4.2% |
| 1,000,000 satoshis | 42,418,988 | 3.3% |
| 10,000,000 satoshis | 18,776,570 | 1.5% |
| 1 bitcoin | 12,306,498 | 1.0% |
| 10 bitcoins | 2,713,160 | 0.2% |
| 100 bitcoins | 415,057 | 0.0% |
| 1,000 bitcoins | 28,373 | 0.0% |
| 10,000 bitcoins | 732 | 0.0% |
| 100,000 bitcoins | 15 | 0.0% |
| 1,000,000 bitcoins (and over) | 0 | 0.0% |
| Total | 1,277,996,771 | 100.0% |
(Source: BitMEX Research, Bitcoin blockchain)
(Notes: Up to block height 613,999, excludes outputs with a value of zero)
Bitcoin’s largest ever transaction output by value (500,000 bitcoin), which also happens to be one of the 15 bitcoin outputs in the 100,000 bitcoin precision bucket
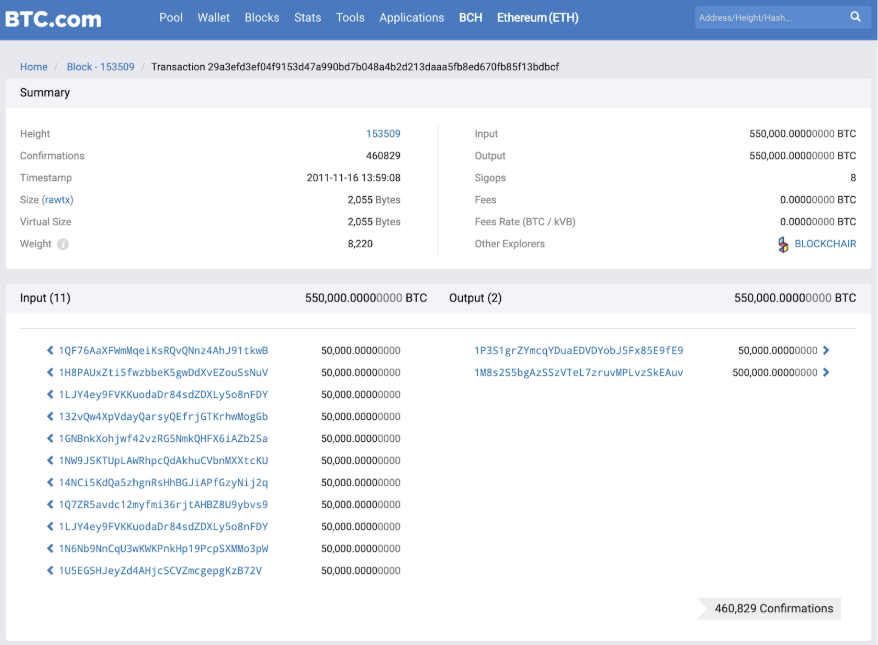
(Source: BTC.com)
The below charts (Figure 3 and 4) illustrate the growth in the total number of Bitcoin outputs and how this progressed over time. In Bitcoin’s history there has been almost 1.3 billion transaction outputs. Of course only a fraction of these outputs remain unspent (sometimes called the UTXO). The UTXO set currently stands at just over 65 million or 5.1% of the cumulative total output count.
Output of the gettxoutsetinfo command on Bitcoin Core, showing c65 million unspent outputs
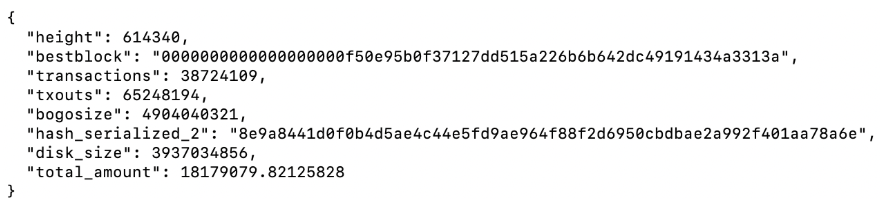
(Source: BitMEX Research)
Figure 3 – Cumulative number of bitcoin transaction outputs
(Source: BitMEX Research, Bitcoin blockchain)
(Notes: Up to block height 613,999, excludes outputs with a value of zero, outputs are in groups of 1,000 blocks)
Figure 4 – Number of Bitcoin transaction outputs vs Bitcoin price
(Source: BitMEX Research, Bitcoin blockchain, Coinmarketcap for the Bitcoin price)
(Notes: Up to block height 613,999, excludes outputs with a value of zero, outputs are in groups of 1,000 blocks)
Figures 5 and 6 below show the total value of the Bitcoin outputs and how this has also grown over time. The c1.3 billion outputs spent around 5.5 billion bitcoin. This may represent spend of over US$12 trillion, based on the Bitcoin spot price at the time the spends occurred.
Figure 5 – Cumulative total value of bitcoin in transaction outputs
(Source: BitMEX Research, Bitcoin blockchain)
(Notes: Up to block height 613,999, outputs are in groups of 1,000 blocks)
Figure 6 – Value of Bitcoin in transaction outputs vs Bitcoin price
(Source: BitMEX Research, Bitcoin blockchain, Coinmarketcap for the Bitcoin price)
(Notes: Up to block height 613,999, outputs are in groups of 1,000 blocks)
The total cumulative average output value size is 4.26 bitcoin. As Figure 7 below illustrates, this average figure has fallen over time, perhaps due to Bitcoin’s price increase.
Figure 7 – Average output value
(Source: BitMEX Research, Bitcoin blockchain)
(Notes: Up to block height 613,999, excludes outputs with a value of zero, outputs are in groups of 1,000 blocks)
Privacy considerations
The level of precision in Bitcoin transactions can have important privacy considerations. When making a typical Bitcoin denominated transaction, with two outputs, one output going to the recipient and one as change, the output with higher precision can often be identified as change, reducing privacy.
As our data shows, the level of precision is increasing, such that most outputs now have the maximum level of precision. This could inadvertently be positive news from a privacy perspective.
Conclusion
On the pathway to become money, many believe Bitcoin could achieve this in three steps. Firstly being used as a medium of exchange, perhaps driven by Bitcoin’s potential unique capability: censorship resistant electronic payments. After this Bitcoin may become a reliable store of value and finally, in the most ambitious and least likely step, achieve unit of account status. This is when goods and services are priced in Bitcoin, businesses report in Bitcoin and economic decisions are based on amounts denominated in Bitcoin.
Bitcoin’s potential pathway to becoming money
| Step 1 | Medium of exchange |
| Step 2 | Store of value |
| Step 3 | Unit of account |
If unit of account status is achieved or becomes more prevalent, then presumably the degree of precision should reduce rather than increase. The data in this report (Figure 1) indicates Bitcoin is moving in the opposite direction, the average degree of precision is still increasing. This may indicate a violation of the unit of account thesis, at least up until this point.
The increase in precision is likely to be driven by several factors. Earlier use cases of Bitcoin were more experimental, where Bitcoin denominated payments were more likely. For instance payments could be related to onchain gambling, onchain gaming, users getting their first coins or technical testing, where lower precision may be likely. In the last few years Bitcoin may have seen increased economic adoption, but perhaps increasingly fiat denominated economic usage, increasing the level of precision. For instance US dollar denominated trading and speculation or US dollar based commercial activity. In addition to this, in the period prior to mid 2010, when there was no clear spot price of Bitcoin, high precision may have been unnecessary. Now that the value of Bitcoin has appreciated considerably, there is more justification for such precision. Another factor may be Bitcoin’s longer history and the fact that more and more of the unspent outputs build up higher precision over time, such that the higher precision carries forward. In our view, it is for these reasons that during the first 10 years of Bitcoin’s development, precision has increased considerably.
As for if the trend will ever turn and the degree of precision decreases again, due to Bitcoin’s increased use as a unit of account, with goods and services denominated in Bitcoin, this is likely to be many years away, if it ever happens at all. Currently the battle is still very much ongoing with respect to the first step, the medium of exchange component in the pathway to becoming money, let alone unit of account status. At least for now, unit of account status, is still somewhat of a fantasy.